An Early Rally Stumbles

Ulli Market Commentary Contact

[Chart courtesy of MarketWatch.com]
  1. Moving the markets

An early rally lost steam mid-day when reports (Bloomberg) surfaced that trade negotiations ran into a brick wall, as the Chinese pushed back to get more assurances on tariffs. That story was then rebuffed, as the WSJ offered a different version:

Talks between the two nations are in the final stages, said individuals tracking the negotiations, with a target date for a deal by the end of April. That is about a month later than the two sides had initially planned.

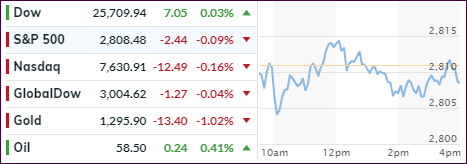
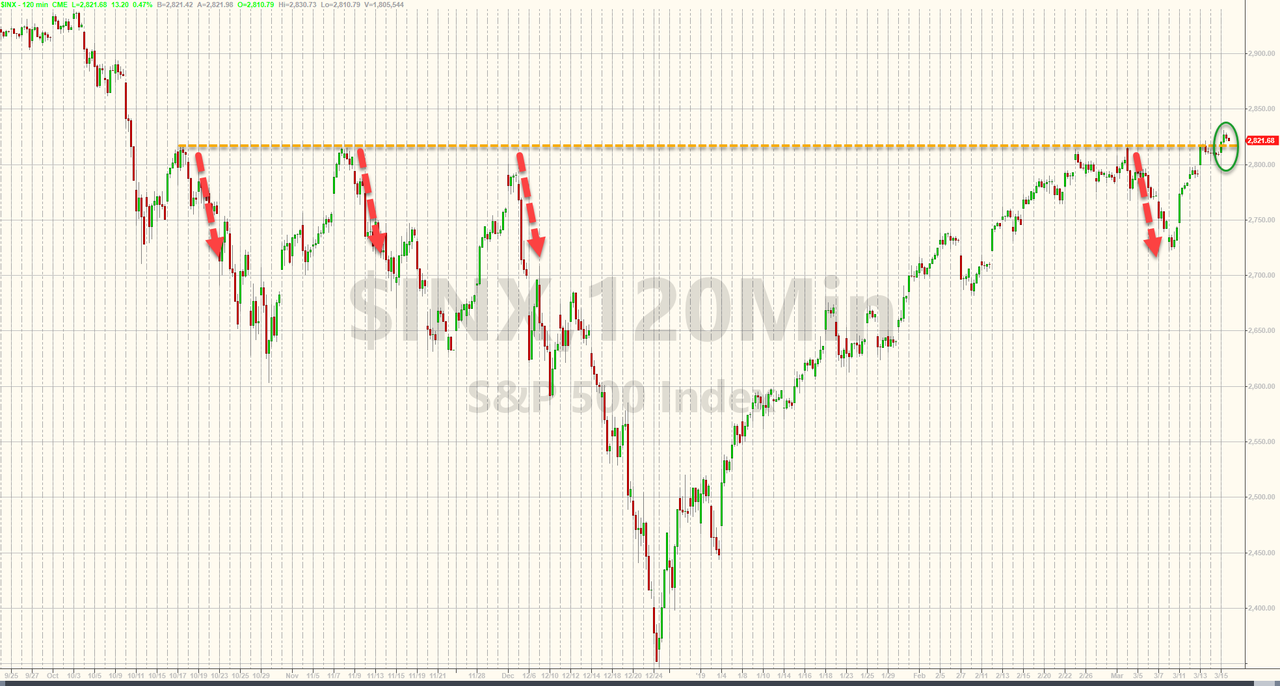
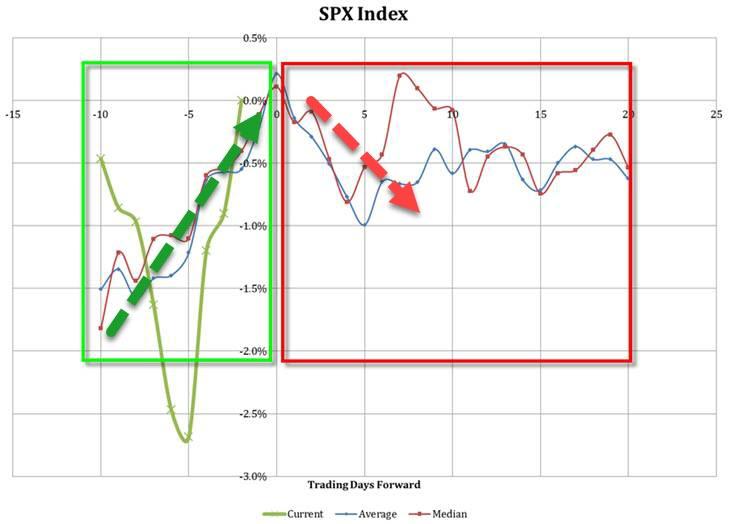
As a result, equities rebounded but momentum continued to slip with the major indexes ending up closing at their respective unchanged lines. Of course, motivation, or lack thereof, in anticipation of tomorrow’s Fed announcement on interest rates, played a role as well in traders’ minds to not make too aggressive of a commitment.

Transportations (IYT) were the ugly duckling of the day by shedding -1.39%, but YTD the index is up solidly. The Dow “lost” its 26k marker but should be able to regain it if the Fed does not disappoint.

And that is the big question du jour. ZH commented that markets have priced in 16 basis points of rate cuts for 2019, which to me means that Fed head Powell must present a very dovish viewpoint tomorrow to even have a chance to “please” the markets.

Read More

Edging Higher Ahead Of The Fed

Ulli Market Commentary Contact

[Chart courtesy of MarketWatch.com]
  1. Moving the markets

Friday’s quad-witching hour turned into a positive for equities in general while today’s market action ahead of the Fed meeting on interest rates was inconsistent but upward trending.

Most of the action happened at the opening, when a surge pushed stocks higher, which was followed by a lull throughout the session, before buyers stepped back in at the close to push the major indexes back to their morning highs.

Expectations are for the Fed, at their Wednesday meeting, to leave interest rates unchanged, but more importantly, every word presented in their final statement will be dissected and regurgitated. The goal is to analyze and figure out the Fed’s projected path on interest rates, such as one hike this year and anther one in 2020.

The hope is that the dovish and wait-and-see attitude adopted in January still has merit, because it was instrumental in pulling stocks out of the December bear market and creating this incredible rebound of 2019 that rescued the buy-and-hold crowd.

If the Fed maintains that policy, we may see more equity advances. If it doesn’t, we could see a sell-off that might retrace the 2019 gains. It would make sense to think that they will not do another policy U-turn, so the former is more likely than the latter. Still, the gap between stocks and bonds continues to widen and has reached 120 S&P points at this time.

While that may seem large to you, it would only take a ~4.2% correction on the S&P 500 to fall back in sync with the direction of bonds, which is certainly within the range of what’s acceptable.

Read More

ETFs On The Cutline – Updated Through 03/15/2019

Ulli ETFs on the Cutline Contact

Below, please find the latest High-Volume ETF Cutline report, which shows how far above or below their respective long-term trend lines (39-week SMA) my currently tracked ETFs are positioned.

This report covers the HV ETF Master List from Thursday’s StatSheet and includes 322 High Volume ETFs, defined as those with an average daily volume of more than $5 million, of which currently 244 (last week 150) are hovering in bullish territory. The yellow line separates those ETFs that are positioned above their trend line (%M/A) from those that have dropped below it.

Take a look:

The HV ETF Master Cutline Report

In case you are not familiar with some of the terminology used in the reports, please read the Glossary of Terms.

If you missed the original post about the Cutline approach, you can read it here.

ETF Tracker Newsletter For March 15, 2019

Ulli ETF Tracker Contact

ETF Tracker StatSheet

https://theetfbully.com/2019/03/weekly-statsheet-for-the-etf-tracker-newsletter-updated-through-03-14-2019/

ENDING A GOOD WEEK ON A POSITIVE

[Chart courtesy of MarketWatch.com]
  1. Moving the markets

The quadruple witching hour came and went and ended up having a positive effect on equities, which more than made up for last week’s pullback. Along the way, traders ignored the unreliable news reports about the U.S.-China trade negotiations as well as China’s latest data showing that their economic slowdown is alive and well.

To elaborate, today is “quadruple witching” Friday, when contracts for stock-index futures, stock index options, individual stock options and individual stock futures all expire. This can lead to increased volatility, which simply means today’s market direction is not a guarantee of things to come.

As a matter of fact, the opposite is a likely possibility, which ZH explains this way:

The risk is that both prior “witches” took place just ahead of major reversals in the S&P, the first in September, just as the market peaked, the second in December, just before the trough.

 For now, however, it is shaping up as another impressive week for US stocks, which have not only erased all of last week’s losses but are set for their second-best week of the year.

Bond market action surprised with the 10-year yield plummeting and closing at not only 2019 lows but also at the lowest since January 2018, while equities continued their relentless march to loftier heights, as the divergence widened. Even sliding EPS expectations and weakening macro data don’t seem to be able to contain the push to higher levels—at least not yet.

The S&P 500 finally managed to conquer and close above the 2,817 zone at the 5th attempt, but more work is needed in order to close in on the all-time high made  in September 2018.

Our Trend Tracking Indexes (TTIs) rallied along with the major indexes this week and climbed deeper into bullish territory. That does not mean we are complacent, but we are very aware that volatility could return with a vengeance. That is why our exit strategy remains in place, just in case bearish forces suddenly gain the upper hand again.

Read More

Weekly StatSheet For The ETF Tracker Newsletter – Updated Through 03/14/2019

Ulli ETF StatSheet Contact

ETF Data updated through Thursday, March 14, 2019

Methodology/Use of this StatSheet:

  1. From the universe of over 1,800 ETFs, I have selected only those with a trading volume of over $5 million per day (HV ETFs), so that liquidity and a small bid/ask spread are assured.
  2. Trend Tracking Indexes (TTIs)

Buy or Sell decisions for Domestic and International ETFs (section 1 and 2), are made based on the respective TTI and its position either above or below its long-term M/A (Moving Average). A crossing of the trend line from below accompanied by some staying power above constitutes a “Buy” signal. Conversely, a clear break below the line constitutes a “Sell” signal. Additionally, I use a 7.5% trailing stop loss on all positions in these categories to control downside risk.

  1. All other investment arenas do not have a TTI and should be traded based on the position of the individual ETF relative to its own respective trend line (%M/A). That’s why those signals are referred to as a “Selective Buy.” In other words, if an ETF crosses its own trendline to the upside, a “Buy” signal is generated. Since these areas tend to be more volatile, I recommend a wider trailing sell stop of 7.5% -10% depending on your risk tolerance.

If you are unfamiliar with some of the terminology, please see Glossary of Terms and new subscriber information in section 9.


  1. DOMESTIC EQUITY ETFs: BUY — since 02/13/2019

Click on chart to enlarge

Our main directional indicator, the Domestic Trend Tracking Index (TTI-green line in the above chart) is now positioned above its long-term trend line (red) by +2.90% after having generated a new Domestic “Buy” signal effective 2/13/19 as posted.

Read More

Slipping And Sliding To Nowhere

Ulli Market Commentary Contact

[Chart courtesy of MarketWatch.com]
  1. Moving the markets

Neither bulls nor bears were able to make much headway on a day reports of stalled progress in the ongoing U.S.-China trade talks added uncertainty. The struggle to extend the 3-day winning streak lasted all day, but in the end, we closed just about unchanged.

The dialog with China was further impacted by news that the scheduled meeting between Trump and Xi Jinping had been postponed until April, a clear sign that the warring parties are nowhere near an agreement. Trump hinted that much on Wednesday by admitting that he was in no rush to strike a deal. Obviously, this has kept a lid on any possible market advances.

Concerns about the slowing global economy accelerated when China’s industrial output did not meet expectations. As the second largest economy, China is seeing an expansion that is now considered to be the slowest in some 30 years—and this is based on “official” data. Reality may be worse than currently anticipated.

Also closely watched is the Brexit saga, with many analysts believing that a disorderly exit from the EU by Britain could agitate global markets. Some of this week’s upward momentum can also be attributed to tomorrow’s quadruple option expiration day, which historically tends to set a temporary top in the market, as this chart shows.

We’ll have to see if history repeats itself, or if the bulls can muster up enough upward momentum to push past the lurking S&P 2,817 overhead resistance level.

Read More