
ETF Tracker StatSheet
ENDING THE WEEK ON A BULLISH NOTE
- Moving the markets
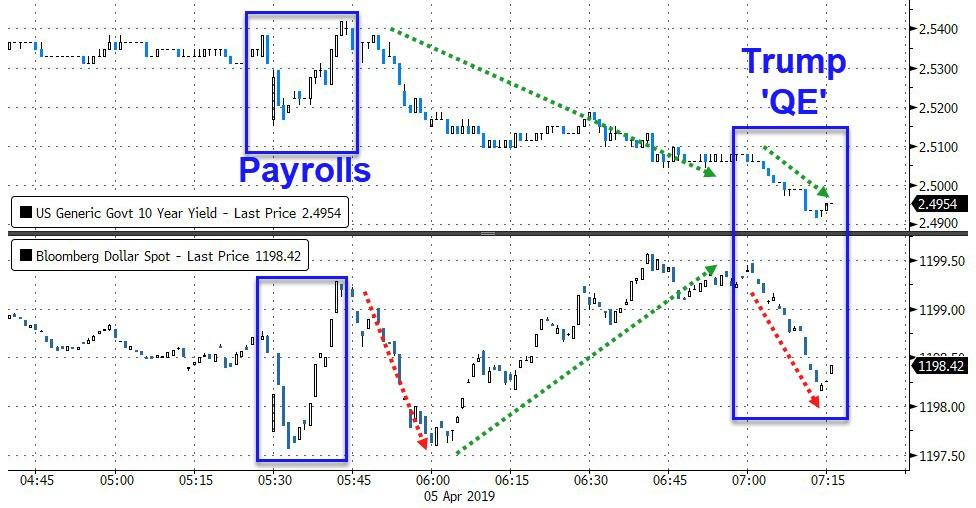
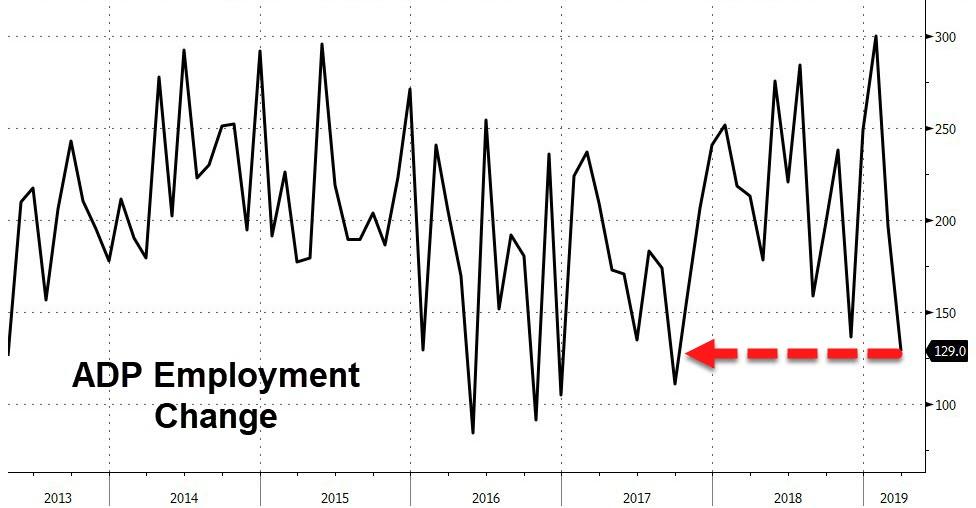
The much-anticipated March payroll report turned out better than hoped for with the BLS reporting that the US added 196k in payrolls in March, which was a tad higher than the 177k expected. This has analysts now proclaiming that February’s dismal gain of 20k, which was upwardly revised to 33k, was an outlier and that we have “normalized.”
While the headline print was all that the computer algos cared about, there was some weakness under the hood especially in manufacturing, shopping and a lower than expected average hourly earnings number. If you care to, you can read the details here.
Zero Hedge quipped:
So where was the Growth? Here are the three key sectors:
- Professional technical services: +34K, mostly computer systems design (+11.5K)
- Healthcare: +61K
- Food Services: +27K
In other words, Americans are eating themselves into obesity, at which point they need constant medical supervision. The good news: at least the American food epidemic will provide waiter/bartender and medical jobs for a long time to come.
While there was no long-term effect on equities, Trump temporarily caused a bit of confusion when he slammed the Central Bank by commenting:
“I personally think the Fed should drop rates, I think they really slowed us down, there’s no inflation, in terms of quantitative tightening, it should really be quantitative easing…you would see a rocket ship. Despite that, we’re doing very well.”
Hmm, this sounds just about the opposite from his tweet on 9/29/2011:
“The Fed’s reckless policies of low interest and flooding the market with dollars needs to be stopped or we will face record inflation.”
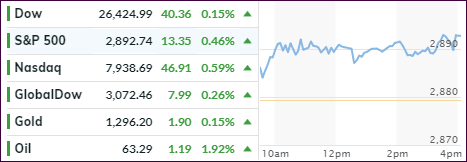
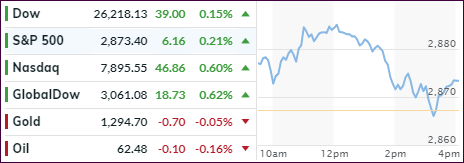
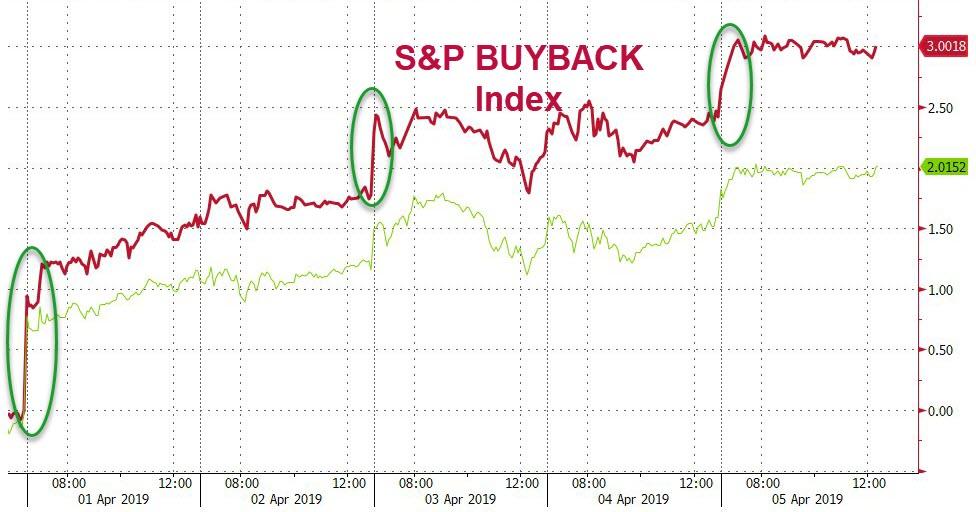
Be that as it may, the markets took it in stride with equities inching up and the S&P 500 closing at its high of the session. The biggest short squeeze in 2 weeks, along with Buybacks, added to bullish sentiment.
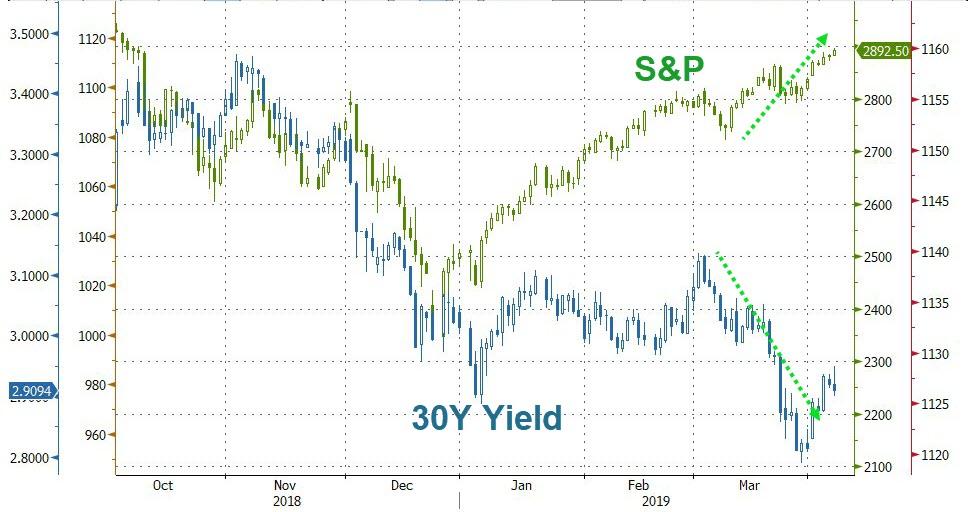
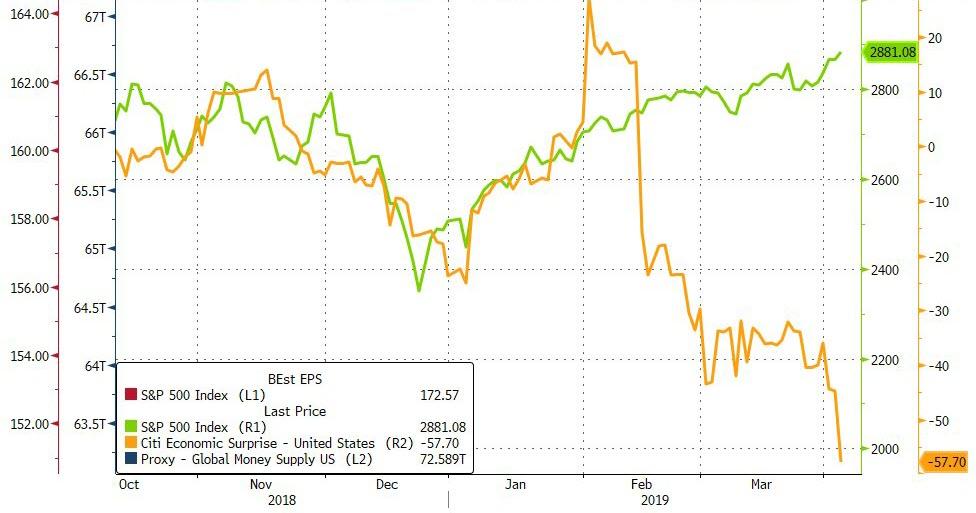
Still, the jaws of reality between stocks and bond yields paint a different picture and are widening every day. Sooner or later there will be an adjustment to bring this out of sync oddity back to normal.
The spread is currently some 500 S&P points, which means that a 20% drop of the index is required to normalize this relationship. To me, it’s not a question of “if” this happens but “when.”