
- Moving the markets
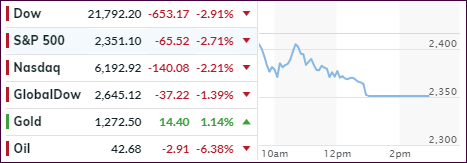
Even a Holiday shortened session wasn’t enough to give the bullish crowd some hope, as the major indexes plunged again with the S&P 500 finally dropping into bear market territory, a level defined as a 20% drop from recent highs.
Starting this mess was Treasury Secretary Mnuchin who, while on vacation, decided to call the heads of the six largest US banks on Sunday to assure them that there was plenty of liquidity in the system. He then proceeded set up a meeting with Plunge Protection Team (PPT) – on Christmas eve! Unfortunately, he also decided to tweet about it, which was akin to someone yelling “FIRE” in a crowed theater.
The fallout was immediate with the markets retreating, when a sudden rebound (PPT?) pushed the Nasdaq back above the unchanged line, before heavy selling set in, which sent the Dow down some 650 points. Good thing we had an abbreviated session, or the consequences could have been a lot worse.
As I pointed out before, this is now the worst December for the S&P 500 since the Great Depression (1931), and there are still 4 trading days left, which might create some problems for those who have not moved to the sidelines yet, as exit doors are getting increasingly crowded. You could consider this session to be a bloodbath, since volume was just about double of the recent average.
ZH noted that even the traditional safe-haven stocks were pummeled with the S&P 500 utilities index dropping as much as 4.6% intra-day, the most since August 2011, because of the continued threat of higher interest rates. That’s why cash on the sidelines never looked so good.
No one saw this market disaster coming except for our Domestic Trend Tracking Index (TTI), which generated a “Sell” effective 11/15/18. Since that moment in time, the S&P 500 has now lost -14.16% allowing all clients in my advisor practice to sidestep this financial tragedy, while the Buy-and-Hold crowd seems to end up with the short end of the stick again—for the third time this century.
Although I expect some sort of rebound make its presence felt, it will most likely only be a bounce in an ongoing bear market, which I believe has a long way to go.
I wish you a Merry Christmas!
- ETFs in the Spotlight
In case you missed the announcement and description of this section, you can read it here again.
It features 10 broadly diversified and sector ETFs from my HighVolume list as posted every Saturday. Furthermore, they are screened for the lowest MaxDD% number meaning they have been showing better resistance to temporary sell offs than all others over the past year.
The below table simply demonstrates the magnitude with which some of the ETFs are fluctuating regarding their positions above or below their respective individual trend lines (%M/A). A break below, represented by a negative number, shows weakness, while a break above, represented by a positive percentage, shows strength.
For hundreds of ETF choices, be sure to reference Thursday’s StatSheet.
Year to date, here’s how our original candidates have fared:
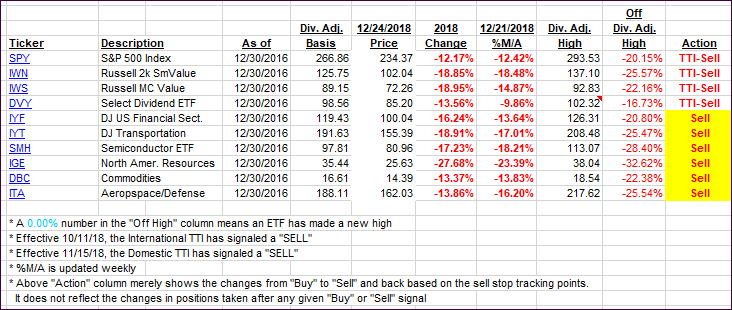
Again, the %M/A column above shows the position of the various ETFs in relation to their respective long-term trend lines, while the trailing sell stops are being tracked in the “Off High” column. The “Action” column will signal a “Sell” once the -8% point has been taken out in the “Off High” column. For more volatile sector ETFs, the trigger point is -10%.
- Trend Tracking Indexes (TTIs)
Our Trend Tracking Indexes (TTIs) got shoved deeper into bear territory. I am running out of superlatives to describe the magnitude of the current crushing of the financial markets…
Here’s how we closed 12/24/2018:
Domestic TTI: -15.27% below its M/A (last close -12.50%)—Sell signal effective 11/15/2018
International TTI: -12.03% below its M/A (last close -10.98%)—Sell signal effective 10/11/2018
Disclosure: I am obliged to inform you that I, as well as my advisory clients, own some of the ETFs listed in the above table. Furthermore, they do not represent a specific investment recommendation for you, they merely show which ETFs from the universe I track are falling.
Contact Ulli