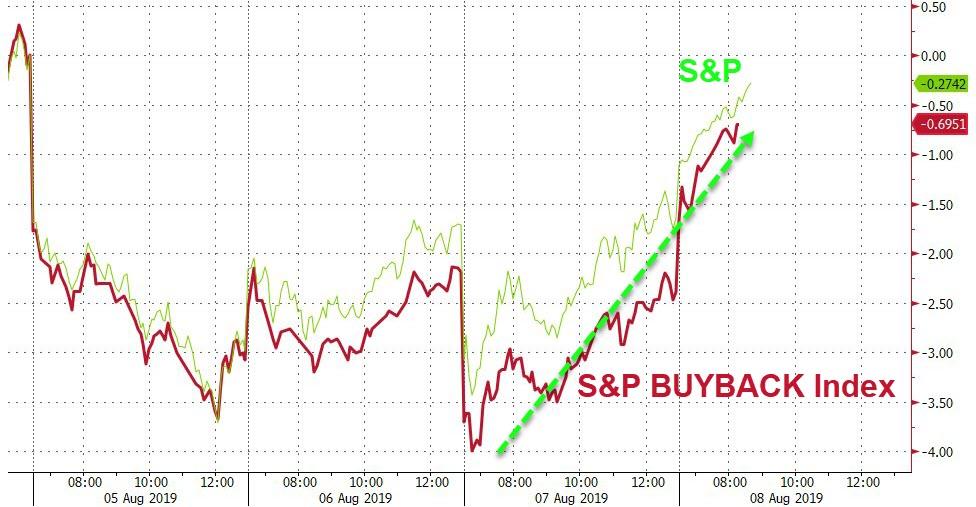
Two forces combined to pull
the markets out of the doldrums after Monday’s drubbing. For one, we saw
corporate buybacks
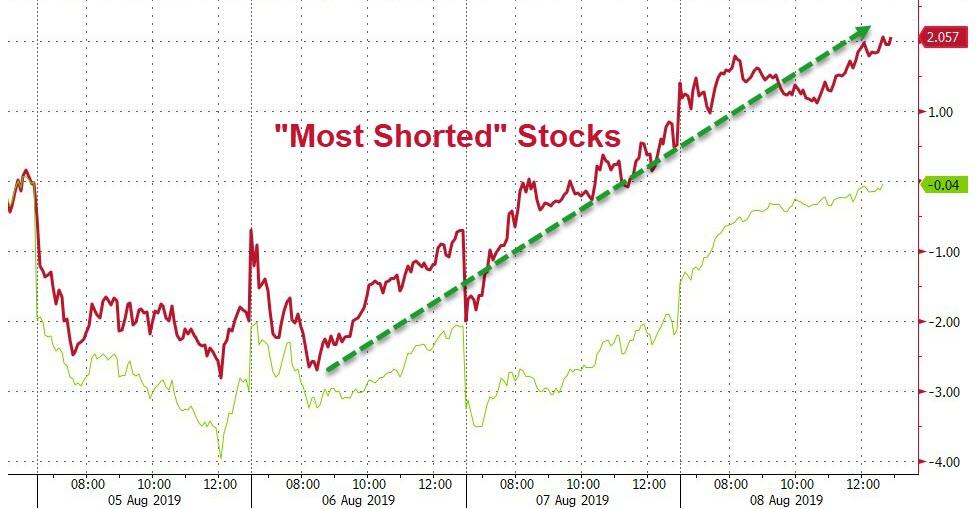
pick up speed, and two, a giant short-squeeze,
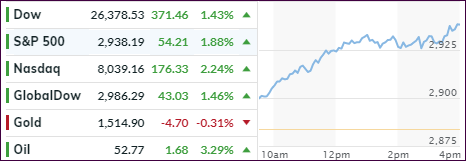
now its third day, threw an assist to push the S&P 500 slightly above last
Friday’s close. Both, the Nasdaq and S&P are back in the black for the week.
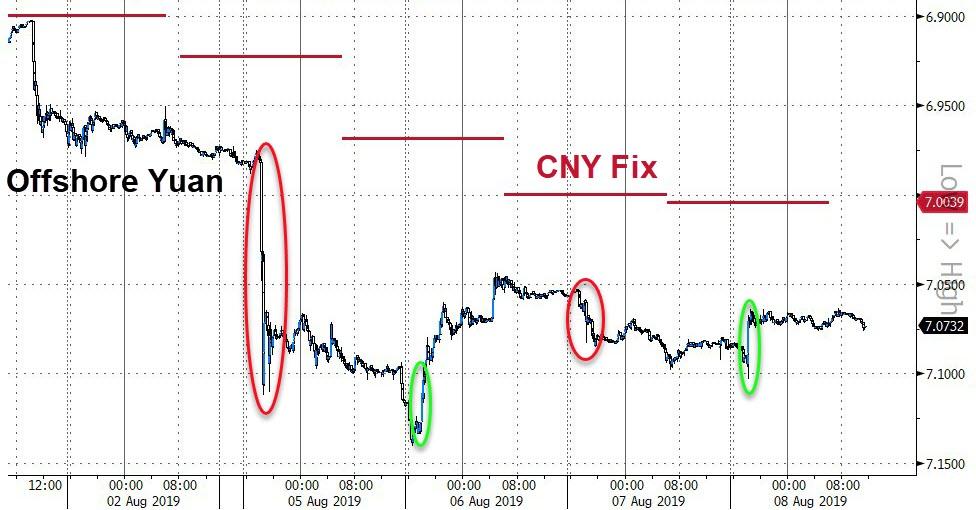
Setting the stage early on,
was China’s Yuan, the peg of which is still set at the weakest
level since 2008 but slightly higher than feared. That helped steady markets worldwide,
as global growth fears subsided a tad and allowed the Global Dow to finally
show a gain after the recent spanking.
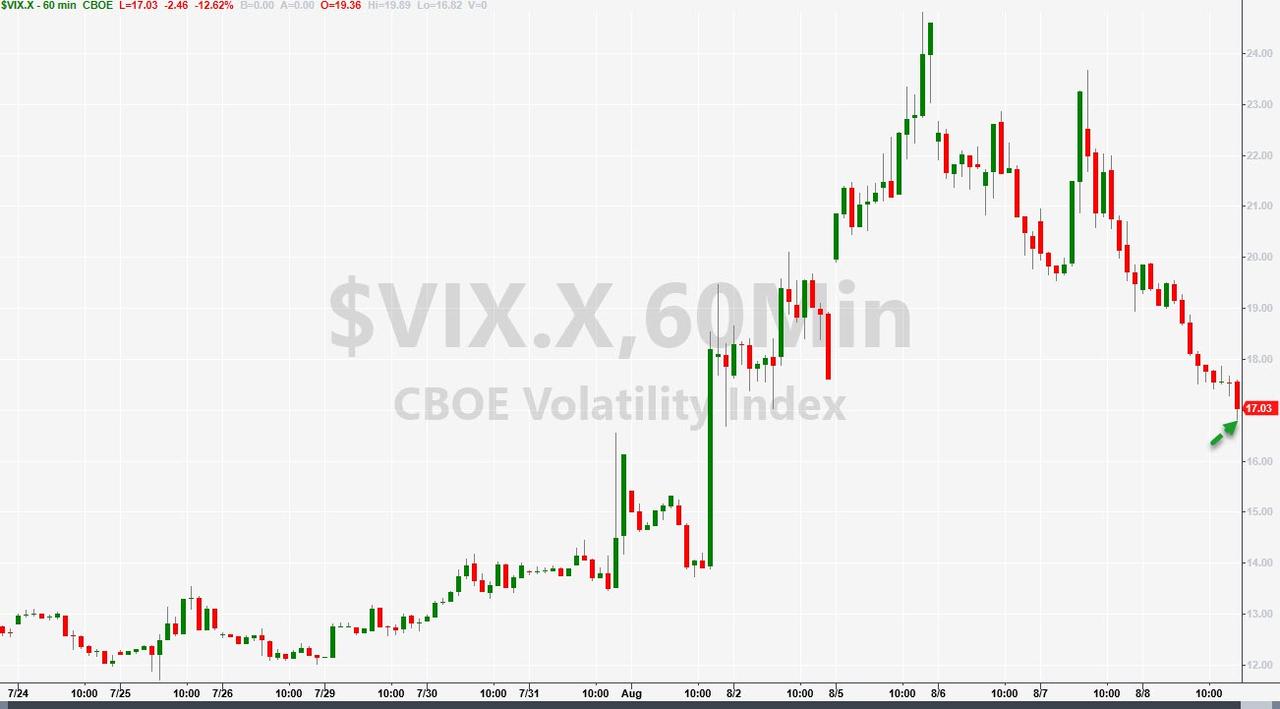
While the markets seem to have
stabilized for the time being, traders are still uneasy, as it would not take much
to turn this trend around and retest Monday’s lows. Soothing the mood on Wall Street,
however, was the volatility
index (VIX), which dropped back from its recent highs to settle at a not so
nerve-wrecking 16 level.
In the end, for us trend followers,
no damage was done, and the major trend direction remains bullish, keeping us on
board until that fact materially changes.
The markets lucked out, as
an early sharp sell-off found some footing, after which buyers stepped in to scoop
up assets at lower prices with all losses being wiped out by the end of the
session. Whether that was just a one-day outlier, or a resumption of the bullish
trend, remains to be seen.
The Nasdaq led the major
indexes, with the S&P barely moving into the green, while the Dow was left
behind and remained a fraction in the red.
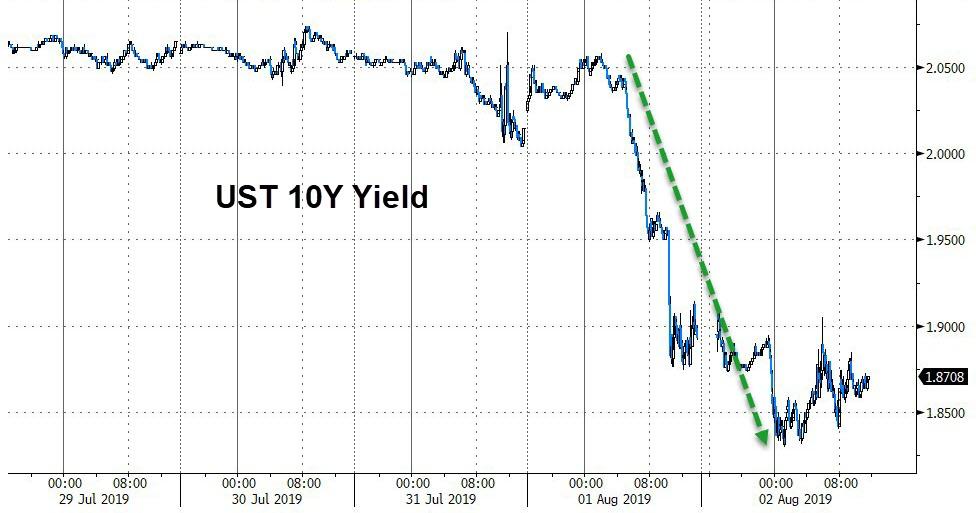
Bond yields took a sharp dive
early on with the 10-year touching 1.62%, then recovering and ending up 1 point
at 1.72%. Still, it appears the race to the bottom is on, meaning that yields
eventually may end up in negative territory.
On a global scale, we know
that some $14 trillion of bonds, or 25% of the market, are yielding negative
rates already. At one point in the past, this was considered a short-term aberration
but now has become an accepted (outside the US) common practice. This is simply
insanity and will not end well.
The recent surge in volatility
can have a devastating effect on equities, which one portfolio manager summed
up as follows:
“An extended period of low
volatility like we have seen in recent years significantly increases leverage
and risk-seeking behavior,” he said in an interview.
“When volatility turns like
it has, people often need to sell assets to meet margin calls. That’s what
makes this so combustible.”
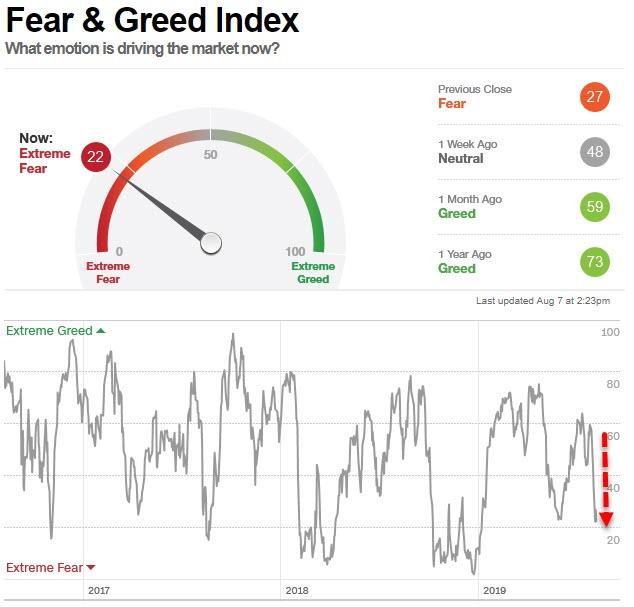
With the actions of the last
week, investor sentiment has collapsed from “euphoric greed” just a month
ago to “extreme fear,” as this chart
shows (thanks to ZH).
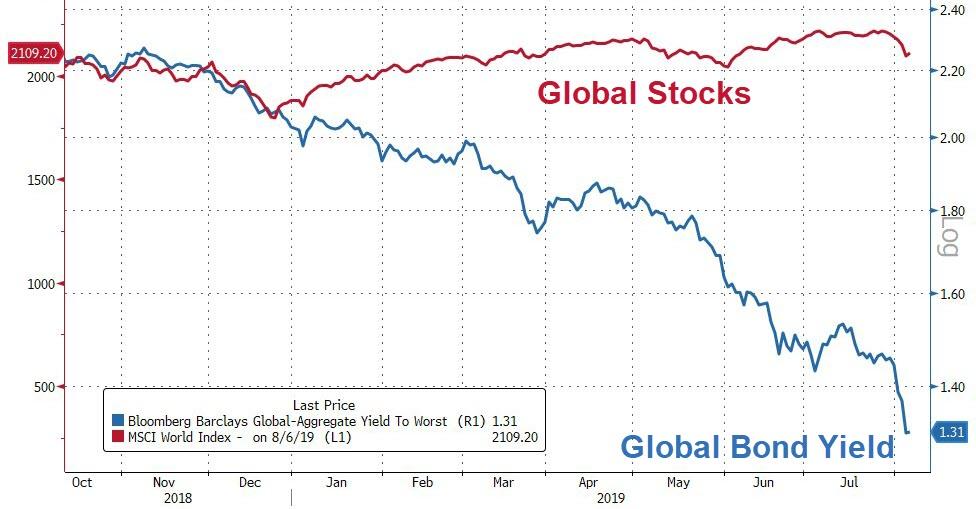
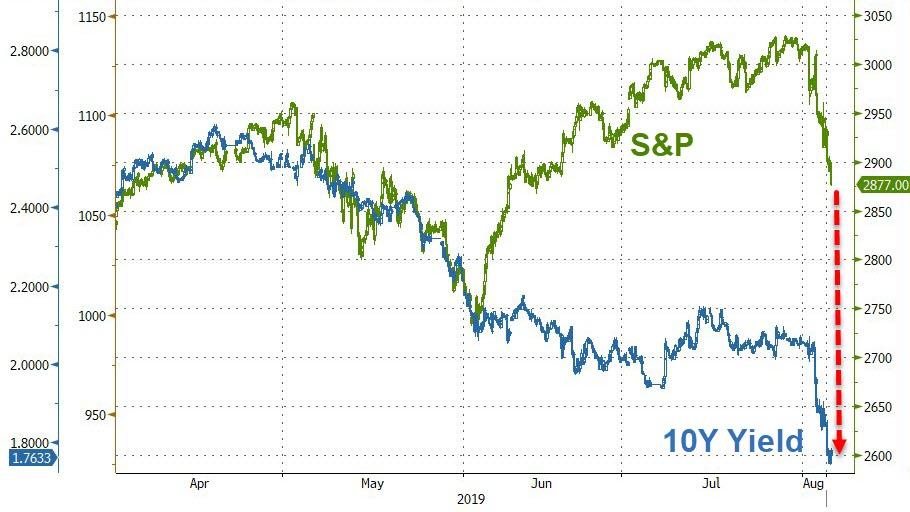
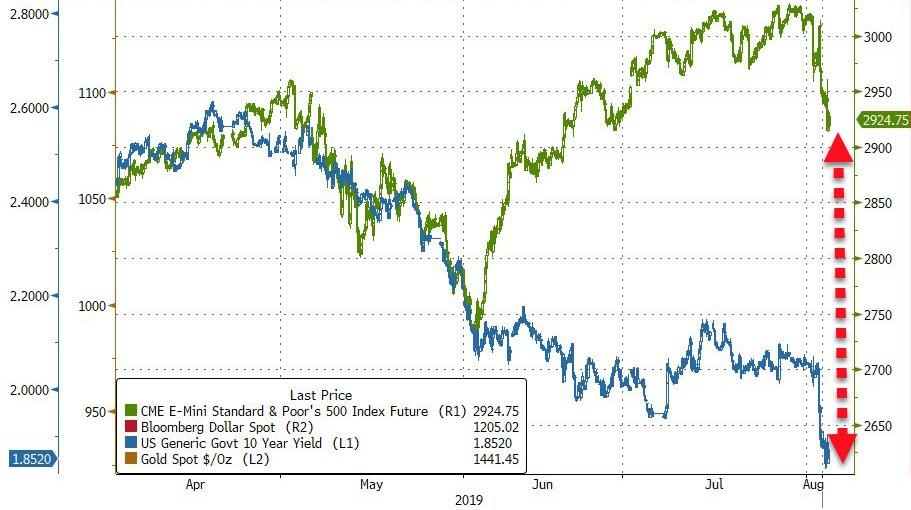
Even on a global basis,
stocks and bonds remain decoupled
by a huge margin. Knowing that bonds represent the “smart money” and stocks the
“dumb money,” we can guess well how this will turn out.
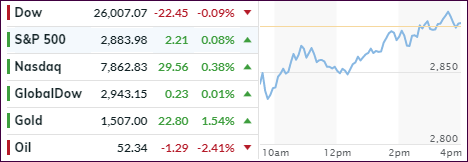
While the initial morning
rebound faded mid-day, buyers stepped in subsequently and pushed the major indexes
out of the doldrums and into a solid green close.
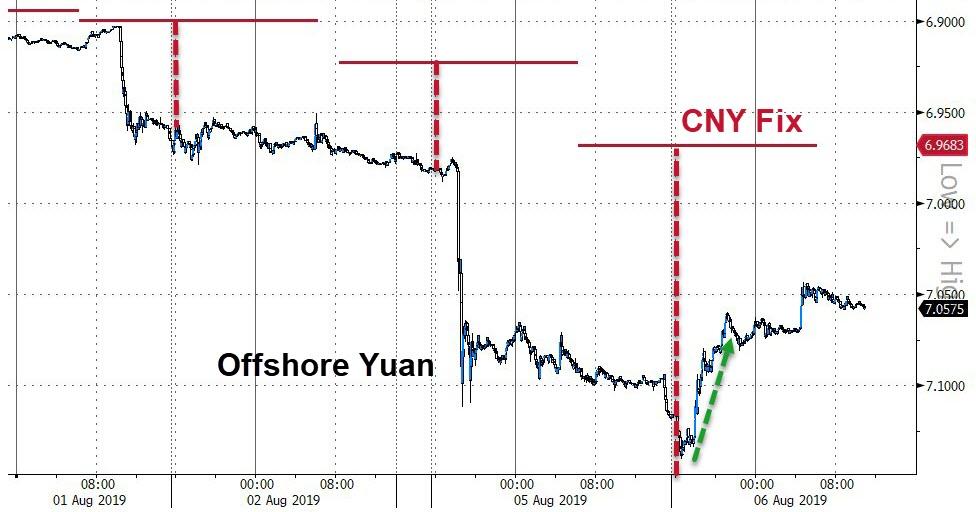
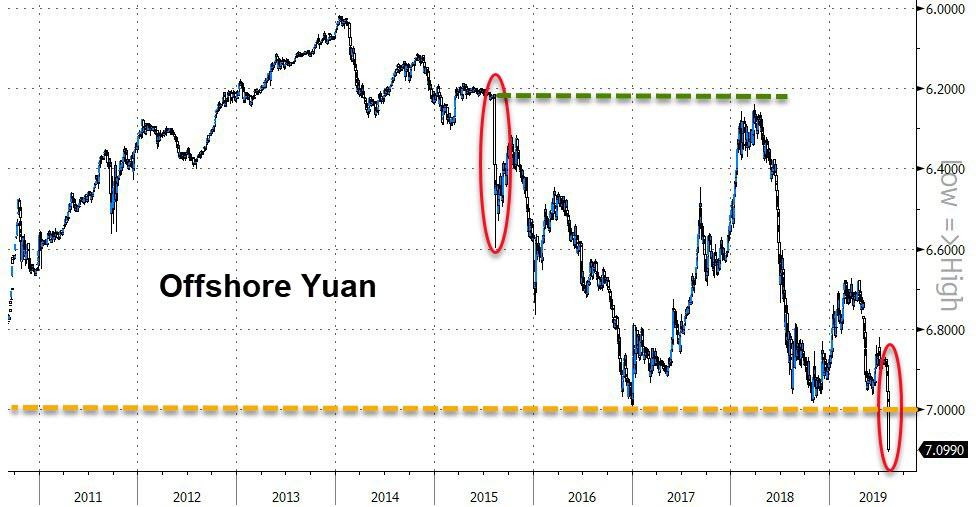
Helping matters was China stabilizing
the problem child that caused yesterday’s panic selling, namely the Juan. The
PBOC (China’s main bank) fixed
the Juan at 6.9683 per dollar, which was marginally stronger than the 7.00 “red
line in the sand.”
That reduced downside market
pressures with traders finally being able to steady their nerves after the Dow’s
767-point plunge. The mood, however, remains fragile, as Wall Street participants
are keenly aware that a stray headline or misunderstood presidential tweet
could kick market turmoil back into high gear.
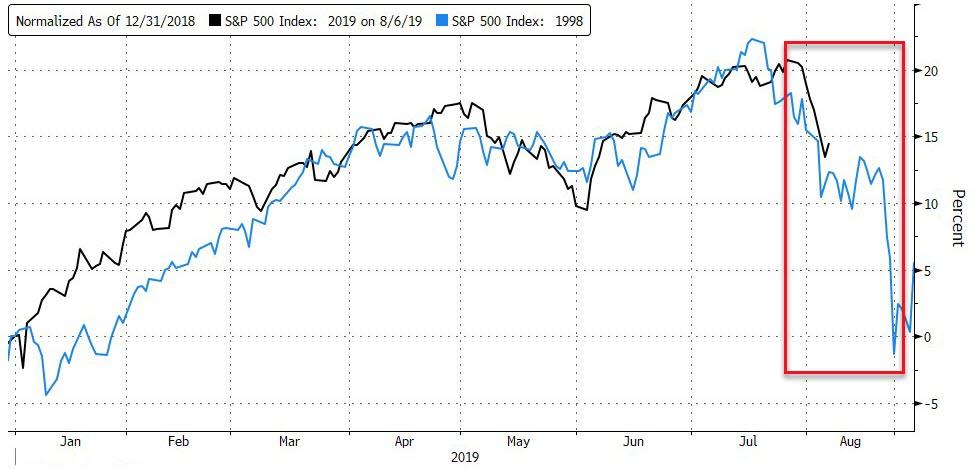
When looking at this
updated chart demonstrating the similarities between the 2019 and 1998
S&P 500 performance, you have to admit that it is eerily similar. This is
not to say that history will repeat itself but, so far, it seems to be a
possibility.
The basic law of physics
tells us that any ‘action’ is followed by an equal or greater ‘reaction.’ This
became very clear today when, after Trump’s threat of additional tariffs last
week, the Chinese retaliated by letting their currency, the Juan, float
freely by removing the US dollar peg.
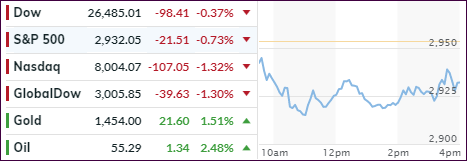
The Juan dropped to 10-year
low causing equities around the word to freefall with the Dow being down at one
point over 850 points. No one saw this coming, as analysts were of the opinion
last week that trade tensions with China existed but that neither side was
ready to escalate.
That was an incorrect assumption,
as it now appears that the final nail was put in the trade coffin, unless one
of the warring parties comes back to the negotiating table with major concessions.
I don’t see that happen, at least not in the foreseeable future.
Trump took the opportunity to
call out China and continued to push the Fed for lower rates with tweets like
this:
China dropped the price of
their currency to an almost a historic low. It’s called “currency
manipulation.” Are you listening Federal Reserve? This is a major violation
which will greatly weaken China over time!
What a difference a week can
make, during which we went from ‘all is fine, new all-time highs and a goldilocks
scenario’ to all hell breaking loose with the bears suddenly having outwitted
the bulls.
The were no winners with the
carnage affecting just about all areas of the globe. European equities were hammered
by seeing their biggest 2-day drop in 3 years with the German DAX touching its
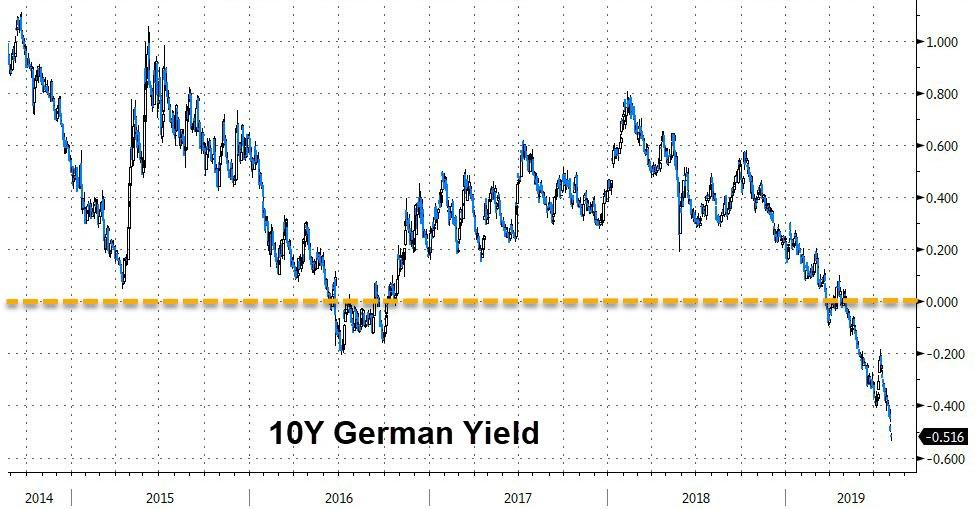
technically important 200-day M/A. It’s 10-year bond crashed
to new lows and now yields a sickening -0.53%.
Domestically, things did not
look any better as SmallCaps and Transporations lost their 200-day M/As, while
the S&P 500, Dow and Nasdaq dropped below their 100-day M/As.
The “jaws of death,” which I
have repeatedly posted about, finally shows some closing, but the S&P 500 still
has a substantial way to go in order to catch up with the 10-year yield, as this
chart demonstrates.
Today’s action weakened our
Trend Tracking Indexes (TTIs-section 3 below) considerably, with the International
one sinking below its long-term trend line. Usually, a one-day event does not
indicate a long-term trend change, so I will give it another couple of days
before pulling the trigger and calling that “Buy” cycle to be over.
The Domestic one, remains on
the bullish side of its respective trend line but, if there is more downside follow
through from today’s bashing, we might end up heading for the safety of the sidelines
soon.
Below, please find the latest High-Volume ETF Cutline
report, which shows how far above or below their respective long-term trend
lines (39-week SMA) my currently tracked ETFs are positioned.
This report covers the HV ETF Master List from Thursday’s
StatSheet and includes 322 High Volume ETFs, defined as those with an average
daily volume of more than $5 million, of which currently 234 (last week 272)
are hovering in bullish territory. The yellow line separates those ETFs that
are positioned above their trend line (%M/A) from those that have dropped below
it.
In case you are not familiar
with some of the terminology used in the reports, please read the Glossary of Terms.
If you missed the original
post about the Cutline approach, you can read it here.
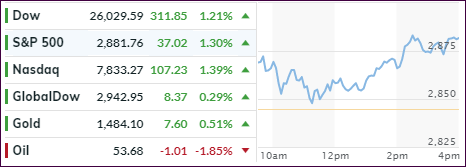
Equities spent most of their day surrounded
by a sea of red, thanks in part to further fallout from the Fed cutting rates by
“only” 0.25%. The bigger impact, however, came from the follow through of tough
language after Trump had announced further tariffs on Chinese goods.
That pushed the markets into bearish mode and
today’s counter punch from the Chinese via words like “temperamental US will
suffer more pain,” did nothing to soothe the raw nerves. This aggravated Wall
Street traders/algos and down we went again recording the worst week of 2019.
As the chart above shows, the outcome could have
been a lot worse, but thanks to buyers stepping in at mid-day, the losses were
sharply reduced, but we still closed in the red. This was the S&P 500’s 5th
successive drop in a row.
Today’s payroll report did not contain any surprises
with 164k jobs added, which was just about the expected number. This decent
headline was weakened by the fact that substantial historical downward revisions
pulled employment gains for May and June down by 41,000 from what was previously
reported.
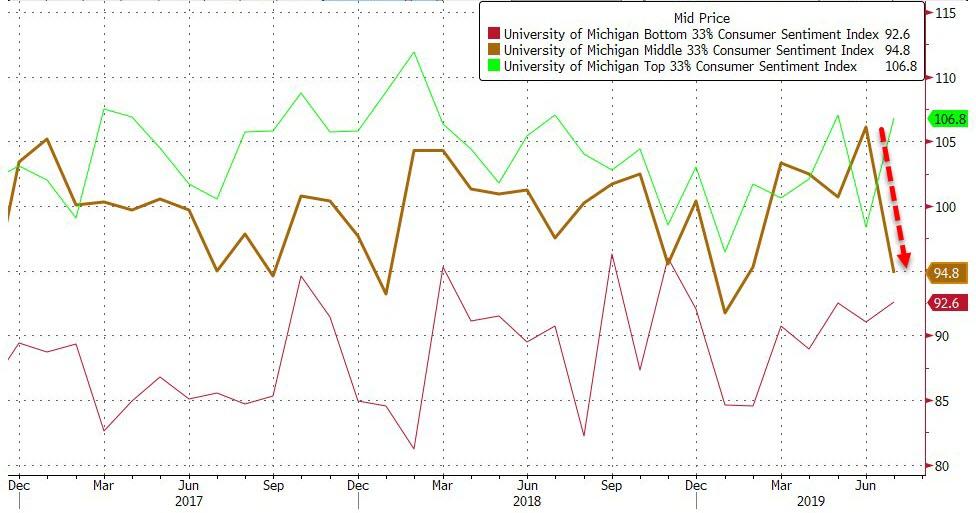
On the economic front, the dire news continues
with Consumer Confidence dropping to 5-month lows, but only in the arena considered
to be the middle-income
Americans, while the bottom and top numbers improved.
Factory orders contracted for the 2nd
month in a row due to a reduction in war-spending, which is a good thing…
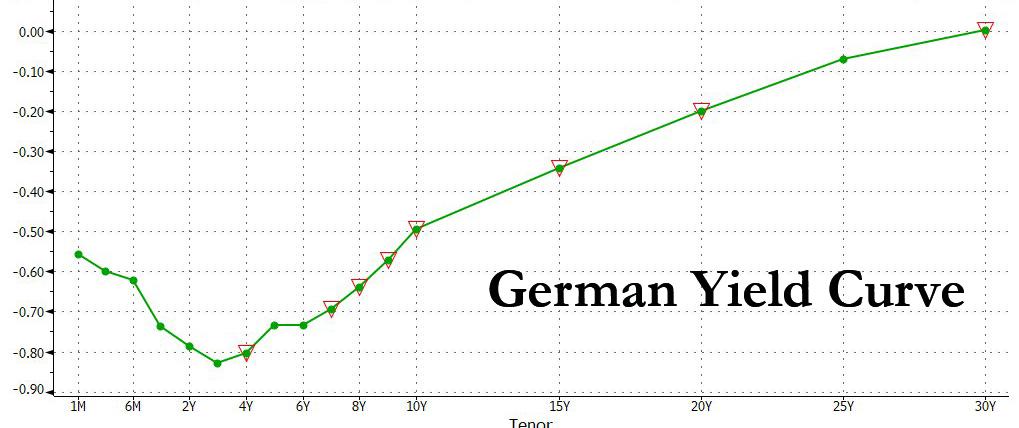
Looking towards Europe, we learned that the entire
yield
curve of economic powerhouse Germany dropped below zero for the first time ever.
What that means is that the idiocy continues in bond land, where every bond you
want to buy has now a negative return. Yes, even the 30-year dropped into minus
territory by a tad.
It’s a race to the bottom, with now some $14
trillion in global bonds now yielding less than zero. I am afraid, it’s just a
matter of time that the US will follow suit.
As ZH pointed out, despite this week’s carnage,
bonds and stocks remain dramatically decoupled,
as the 10-year yield experienced its biggest
drop in a week, since the end of 2014.
If the last few days are an indication of what we can expect in the markets, it promises to be an August to be remembered.

