Below, please find the latest High-Volume ETF Cutline
report, which shows how far above or below their respective long-term trend
lines (39-week SMA) my currently tracked ETFs are positioned.
This report covers the HV ETF Master List from Thursday’s
StatSheet and includes 322 High Volume ETFs, defined as those with an average
daily volume of more than $5 million, of which currently 240 (last week 211)
are hovering in bullish territory. The yellow line separates those ETFs that
are positioned above their trend line (%M/A) from those that have dropped below
it.
In case you are not familiar
with some of the terminology used in the reports, please read the Glossary of Terms.
If you missed the original
post about the Cutline approach, you can read it here.
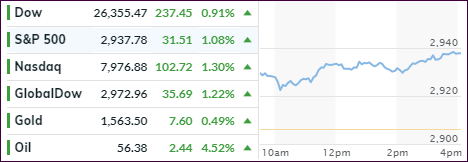
Today’s jobs report came in weaker than
expected, as only 130k jobs were created in August vs. a hoped for 170k. Stocks
shrugged off the poor number with traders and algos alike seeing the positive in
increased odds that the Fed will indeed cut rates (maybe even the whisper number
of 0.5%?) when it meets in 2 weeks.
As a consequence, bond yields dropped,
after spiking yesterday, while the dollar dumped
and reached a level that was a starting point for Thursday’s rally. In other words,
nothing was gained.
The mid-day rebound lost steam in the end
with the S&P 500 barely hanging on to a green close, while the Nasdaq slipped
slightly into the red. Still, for the week, the S&P eked out a gain of some
+1.8%.
Trying to keep things calm were words from
Fed head Powell, who said that “he is not forecasting or expecting a
recession,” though he sees “significant” downside risks that the Central
Bank will monitor.
Interestingly, as ZH posted, since the last
Fed rate-cut, the US dollar and stocks are unchanged, while bonds and gold are
up some 6%, as this
chart shows.
Hmm, does that mean rate cuts are no longer providing
the fire power to support stocks? We’ll find out after the next Fed meeting if
this proposition holds true.
ETF Data
updated through Thursday, September 5, 2019
Methodology/Use of this StatSheet:
1. From the universe of over 1,800 ETFs, I have selected only those with a
trading volume of over $5 million per day (HV ETFs), so that liquidity and a
small bid/ask spread are assured.
2. Trend Tracking Indexes (TTIs)
Buy or Sell decisions for Domestic and International ETFs (section 1 and
2), are made based on the respective TTI and its position either above or below
its long-term M/A (Moving Average). A crossing of the trend line from below
accompanied by some staying power above constitutes a “Buy” signal. Conversely,
a clear break below the line constitutes a “Sell” signal. Additionally, I use a
7.5% trailing stop loss on all positions in these categories to control
downside risk.
3. All other investment arenas do not have a TTI and should be traded
based on the position of the individual
ETF relative to its own respective trend line (%M/A). That’s why those signals
are referred to as a “Selective Buy.” In other words, if an ETF crosses its own
trendline to the upside, a “Buy” signal is generated. Since these areas tend to
be more volatile, I recommend a wider trailing sell stop of 7.5% -10% depending
on your risk tolerance.
If you are unfamiliar with some of the terminology, please see Glossary of Termsand new subscriber information in section 9.
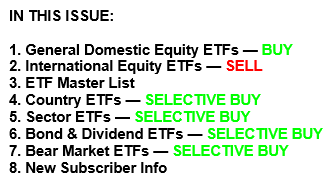
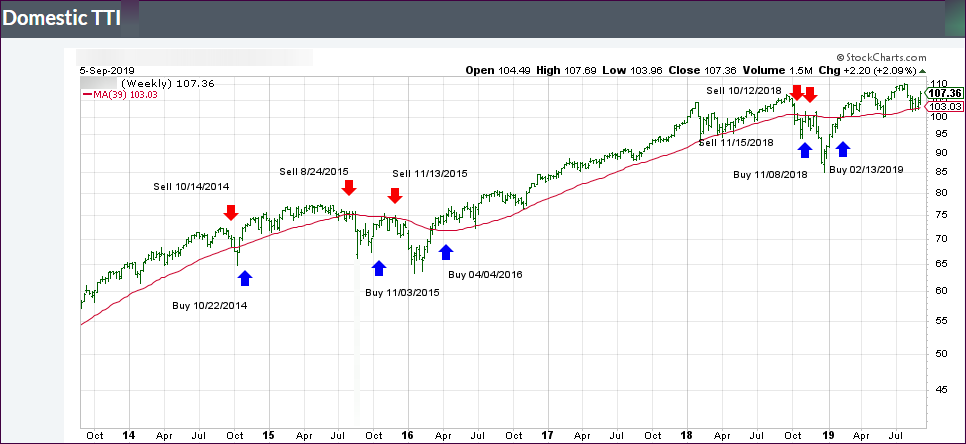
1. DOMESTIC EQUITY ETFs: BUY
— since 02/13/2019
Click on chart to enlarge
Our main directional indicator, the Domestic Trend Tracking Index (TTI-green line in the above chart) is now positioned above its long-term trend line (red) by +4.50% after having generated a new Domestic “Buy” signal effective 2/13/19 as posted.
Just when you thought the
trade deal was dead, news that US and Chinese officials declared a tentative resumption
of tariff talks made the headlines, and off to the races we went with the computer
algos pushing the indexes sharply higher.
Mind you that nothing worthwhile
was accomplished. The warring parties simply agreed to talk again around “early
October,” which these days is considered enough of a progress in the yearlong
trade conflict for equities to surge.
To be fair, bullish
sentiment was boosted by a couple of economic reports. First, ADP estimated that
the private sector added some 195k jobs in August, which raised expectations for
a good number tomorrow when the BLS releases its jobs report.
Second, despite recent surveys
pointing to weakness in the manufacturing sector, the ISM rebounded, even though
60% of its components weakened. Nevertheless, for the day, the markets treated ‘good
news’ as ‘good news’ with equities spiking.
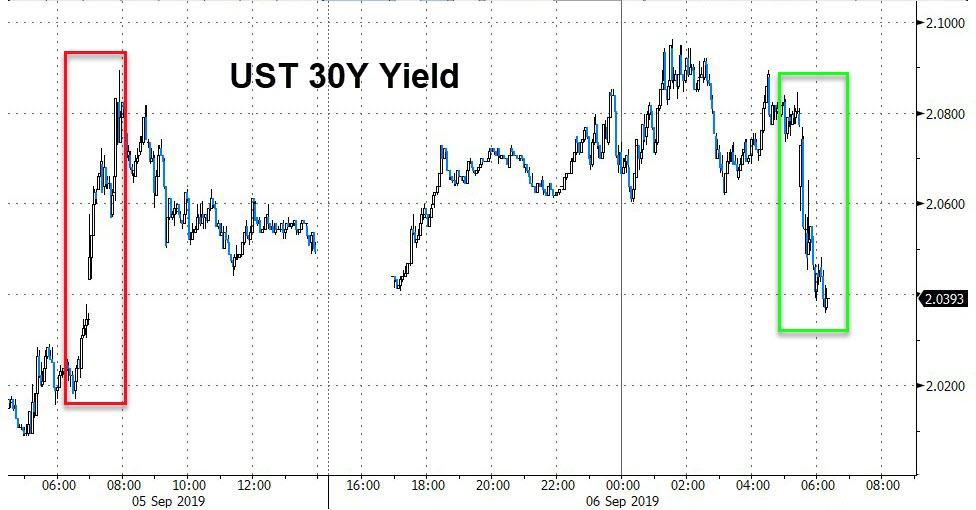
That spike came in the face
of sharply surging bond yields with the 30-year heading back above 2%, while
the benchmark 10-year dashed 10 basis points to 1.58% before pulling back into
the close.
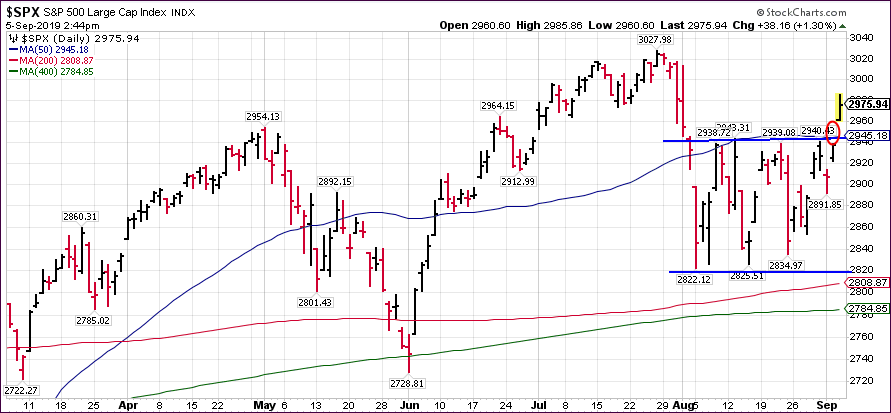
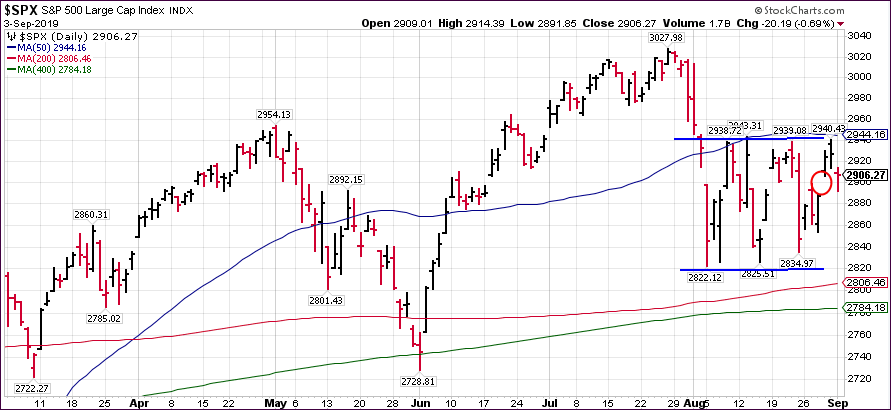
The S&P 500 broke out
of its 5-week trading range (upper blue line) leaving a break-away gap behind
(red circle). This gap will need to be closed at some point, so it’s questionable
at this moment in time whether this breakout has enough legs to take out July’s
highs.
This strong up move in the face
of dramatically rising bond yields is unusual and, while this push benefited
the S&P 500, it’s low volatility cousin SPLV, which I have preferred during
this ‘Buy’ cycle, lagged and did not participate.
This means for this current cycle,
which started on 2/13/19, the S&P 500 (SPY) has made up some ground and is
now showing an +8.28% gain, which is still substantially behind the SPLV’s +12.89%.
Tomorrow’s jobs numbers are bound
to affect market direction. The question is “which way?”
The major indexes staged a turnaround,
after yesterday’s pullback, encouraged by an apparent ease in Hongkong tensions.
Chief executive Carrie Lam announced that she would withdraw the controversial extradition
bill that has sparked months of violent protests, which were feared to eventually
hurt the business climate and global financial markets.
While this bill meets only
one of five demands from the protesters, at least it’s a step in the right
direction, which put the computer algos into a buying frenzy and spreading a
sea of green in equities.
Also helping the bullish mood
were reports that the People’s Bank of China will soon implement cuts in reserve
requirements for Chinese banks, a move that is expected to boost growth and
shows willingness by the government to battle the effects of higher US tariffs
on Chinese imports.
This readiness by the Chinese
to engage in some sort of stimulus eased fears, at least for the moment, that
the US economy might slide into a recession in part due to the endless US-China
tariff conflict, which has been a contributing factor to not just a worldwide disruption
of supply chains but too a slowdown of global economies.
Likewise giving an assist to
the bullish cause was more dovish encouragement from a variety of Fed speakers
that rate cuts are on the menu. ZH summed them up as follows:
Williams (Dovish):
“Ready to act as appropriate”, July cut was right move, economy mixed
(admitted consumer spending not a leading indicator), international news
matters, low inflation biggest problem.
Kaplan (Dovish):
“Monetary policy a potent force”, worried about yield curve
inversion, economy mixed (factories weak due to trade, consumer strong),
watching for “psychological effects” on consumers, “if you wait
for consumer weakness, it might be too late.”
Kashkari (Dovish):
Tariffs, “trade war are really concerning business”,
job market not overheating, slower global growth will impact US, most concerned
about inverted yield curve. Fed’s policy is “moderately
contractionary.”
Bullard/Bowman (Looked Dovish): Took
part in “Fed Listens” conference but made no comment on policy but
then again when has Jim Bullard ever not been dovish.
Beige Book (Mixed):
Moderate expansion but trade fears are mounting, but optimism remains, despite
what Kashkari says: “although concerns regarding
tariffs and trade policy uncertainty continued, the majority of businesses
remained optimistic about the near-term outlook”
Evans (Dovish): Trade
policy increases uncertainty and immigration restrictions lower trend growth to
1.5%, Auto industry especially challenged
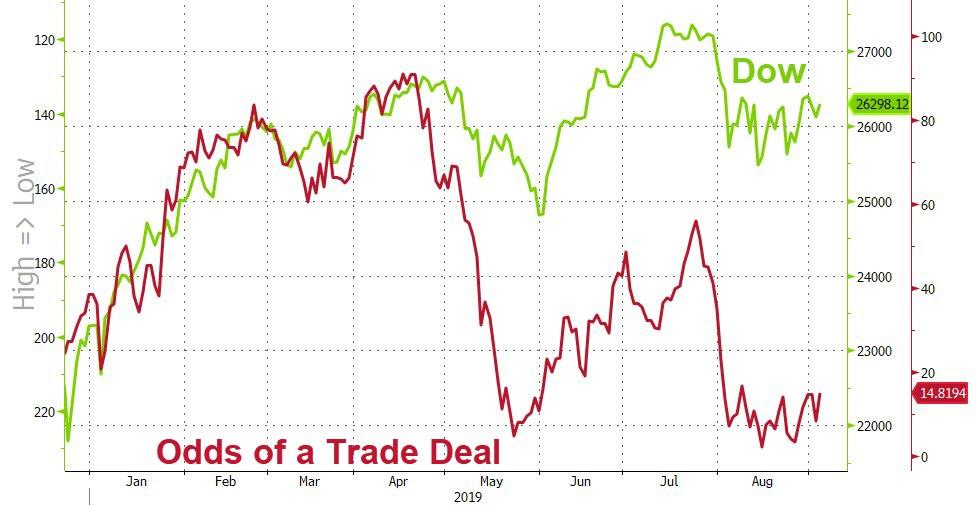
As a result, the markets
have now ‘priced in’ an astonishing 124 bps (1.24%) of rate cuts through the
end of 2020. Tip of the hat goes to ZH for this
chart. On the other hand, a trade deal is now almost entirely ‘priced
out,’ which means that the only ‘big dog’ left to support equities is none
other than the Fed and its policies.
Last week’s rally was based
on nothing more than rekindled optimism that the ever-accelerating trade war with
China may be “again” on another verge of the warring parties agreeing to a
ceasefire.
On the other hand, how many
times can you cry “wolf” before it’s being ignored.
Apparently, we have not
reached that moment in time yet, as on Sunday morning, against all wishful thinking,
the US slapped tariffs on $112 billion in Chinese imports. It only took 1
minute for China to retaliate via higher tariffs on some $75 billion of US
goods.
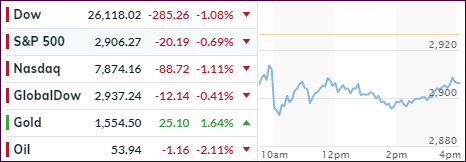
That killed the “trade deal
is imminent” proposition, and it became clear that Tuesday’s market reaction
would be a negative one, and that’s exactly what happened.
Assisting the sour mood of traders
and algos alike was a report showing that US manufacturing is the weakest in 10
years, and the headline manufacturing number plunged
into contraction.
At its lowest point, the Dow
was down over 300 points, and the S&P 500 almost closed the breakaway
gap I mentioned last Thursday, while the index seems to be heading towards the
lower band of the 5-week trading range.
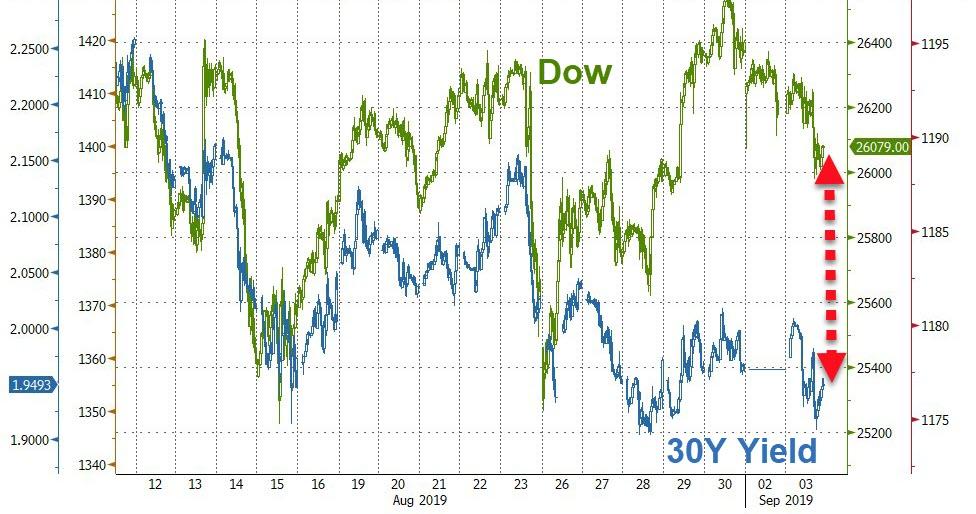
With the slippage of the
markets, it appears that there may be some recoupling of stocks and bond yields
in the near future, as the jaw
of death has closed slightly—and not in favor of stocks.
We will find out soon enough
if that tendency continues.
