ETF Tracker Newsletter For September 13, 2019

Ulli ETF Tracker Contact

ETF Tracker StatSheet          

You can view the latest version here.

HOMING IN ON ALL-TIME HIGHS

[Chart courtesy of MarketWatch.com]
  1. Moving the markets

The markets got an early lift from retail sales, despite the August report showing a mixed picture. While purchases of new autos and building supplies contributed to the rise of 0.4% last month, most other stores reported weak or declining receipts, which appears to be a sign that consumers have trimmed their spending.

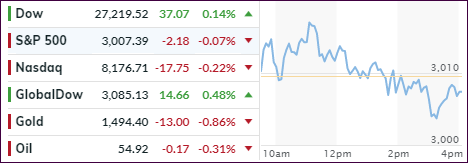
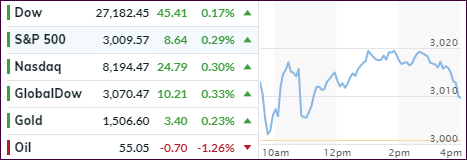
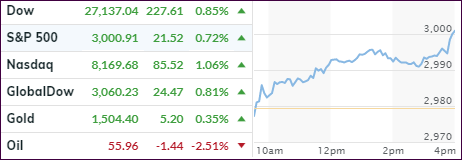
Equities slipped throughout the session with only the Dow closing in the green and scoring its 8th straight gain. The Dow and S&P 500 are now within striking distance of fresh all-time highs, which may very well happen next week in anticipation of the Fed not disappointing and lowering interest rates next Wednesday.

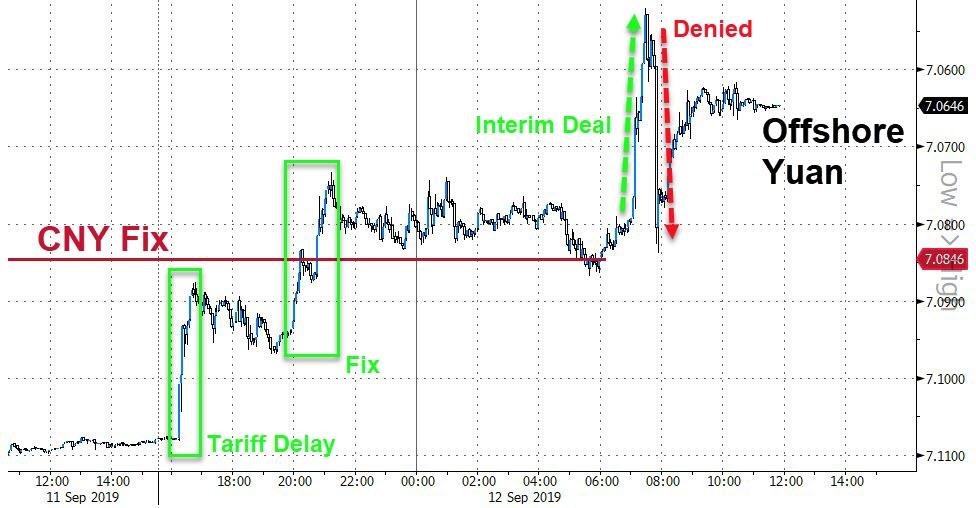
Trade tensions with China appeared to have softened a tad, at least for the time being, in that China exempted US agricultural products from tariffs. That overture came after reports that an interim trade deal has been struck.

Still, something odd is happening in the relationship between bond yields and equity prices. The 10-year yield surged again by almost 13 basis points, a huge move, which many traders consider a bond bloodbath. That should have been headline news but was barely mentioned in the press.

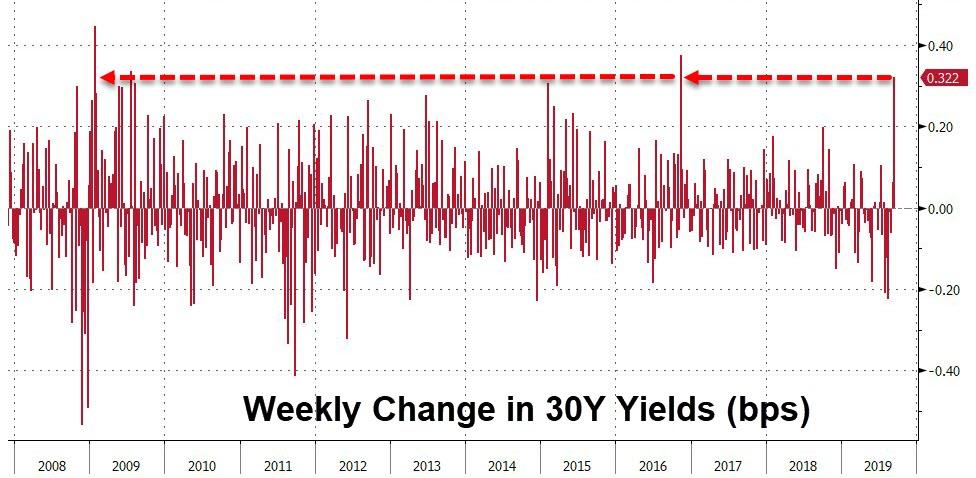
Despite all the rhetoric about lower rates, mortgage rates have shot up, and the 10-year bond yield, which a few weeks ago was at 1.47%, has spiked to 1.90% without as much as a hiccup in equities. Even the 30-year yield climbed an amazing 33 basis points this week, a surge that is the second biggest since 2009.

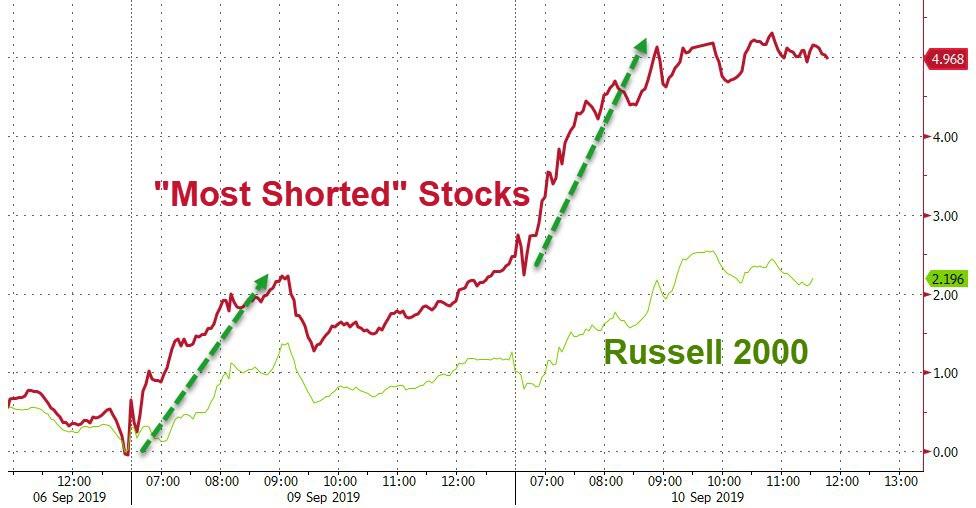
The rotation out of well-performing momentum stocks into the cyclical and value arena continued, as higher yields impacted low volatility ETFs, such as SPLV and USMV. While they lagged in performance, they are still holding on to their YTD lead over SPY.

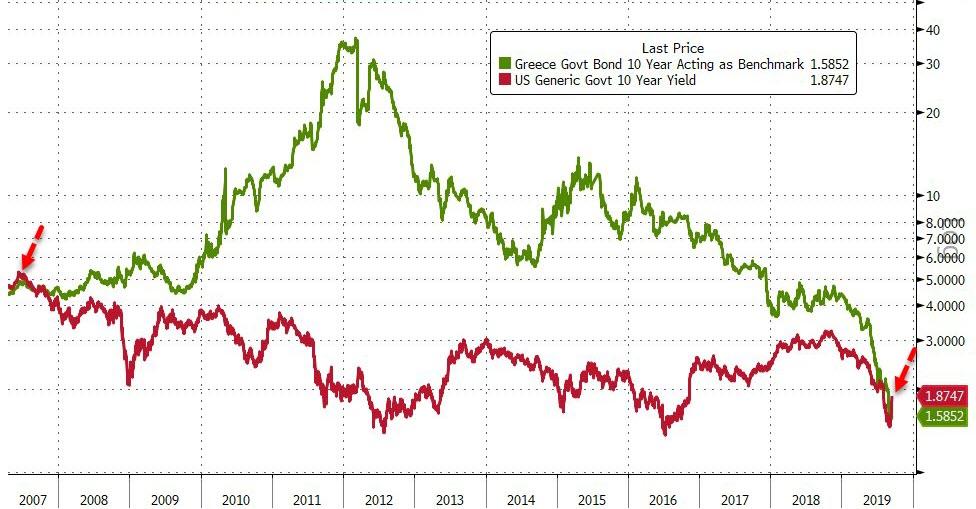
We’re living in a such a distorted system where, as of today, Greek 10-year bond yields are now below US 10-year yields for the first time since 2007. For the uninitiated, that means, at least in theory, Greece is less of a default risk than the US.  

Go figure…

Read More

Weekly StatSheet For The ETF Tracker Newsletter – Updated Through 09/12/2019

Ulli ETF StatSheet Contact

ETF Data updated through Thursday, September 12, 2019

Methodology/Use of this StatSheet:

1. From the universe of over 1,800 ETFs, I have selected only those with a trading volume of over $5 million per day (HV ETFs), so that liquidity and a small bid/ask spread are assured.

2. Trend Tracking Indexes (TTIs)

Buy or Sell decisions for Domestic and International ETFs (section 1 and 2), are made based on the respective TTI and its position either above or below its long-term M/A (Moving Average). A crossing of the trend line from below accompanied by some staying power above constitutes a “Buy” signal. Conversely, a clear break below the line constitutes a “Sell” signal. Additionally, I use a 7.5% trailing stop loss on all positions in these categories to control downside risk.

3. All other investment arenas do not have a TTI and should be traded based on  the position of the individual ETF relative to its own respective trend line (%M/A). That’s why those signals are referred to as a “Selective Buy.” In other words, if an ETF crosses its own trendline to the upside, a “Buy” signal is generated. Since these areas tend to be more volatile, I recommend a wider trailing sell stop of 7.5% -10% depending on your risk tolerance.

If you are unfamiliar with some of the terminology, please see Glossary of Terms and new subscriber information in section 9.     

1. DOMESTIC EQUITY ETFs: BUY — since 02/13/2019

Click on chart to enlarge

Our main directional indicator, the Domestic Trend Tracking Index (TTI-green line in the above chart) is now positioned above its long-term trend line (red) by +6.43% after having generated a new Domestic “Buy” signal effective 2/13/19 as posted.

Read More

Rally Expands—Then Runs Out Of Steam

Ulli Market Commentary Contact

[Chart courtesy of MarketWatch.com]
  1. Moving the markets

An early rally ended up running out of steam and might have even produced a red close, but fortunately, we ran out of trading time.

The initial boost came from Europe, as the European Central Bank (ECB) followed through on hopes that they’d dig into their toolbox and cut the deposit rate further into negative territory. At the same time, they launched a new round of monthly bond purchases (for as long as needed), here in the US known as Quantitative Easing (QE), along with other steps to stimulate the sagging eurozone economies.

Outgoing ECB head Draghi justified this action by saying that “risks to the eurozone outlook had increased” due to the ongoing global trade disagreements along with concerns about the impending UK exit from the EU.  

Another round of trade jawboning with the Chinese played havoc with the indexes, as early news of an “interim deal” pushed equities higher, which then lost stream in the end, as the White House announced that such a deal was “absolutely not” on the table.

This session had the feel of no clear direction, as the latest headlines about assurances, leakages and skirmishes produced nothing but a roller coaster day. However, we did manage to close in the green. ZH produced this spot-on chart clearly depicting the chaos that went on behind the scenes.

Things may heat up even more, as we inch closer to next week’s Fed meeting and its verdict on interest rates.

Read More

S&P 500 Reclaims Its 3,000-Milestone Marker

Ulli Market Commentary Contact

[Chart courtesy of MarketWatch.com]
  1. Moving the markets

After a slow start, upward momentum picked up, and after a brief dip late in the session, the major indexes surged into the close led by the Nasdaq. The S&P 500 managed to barely reclaim its 3k marker, which it had surrendered at the beginning of August, while the Dow notched its 6th straight gain in a row.

The rotation from defensive and momentum driven stocks into cyclical and value-oriented ones continued. As I posted yesterday, during the recent spike in bond yields, traders had sold low volatility funds/ETFs to cash in on some outsized returns.  

As a result, they lost a little bit of their luster, but in the case of SPLV, it still leads its more aggressive cousin SPY. It remains to be seen if the recent rally in SmallCaps can maintain current momentum, as its index, the Russell 2000, which has lagged the broader market for most of this year, is hovering more than 10% below its all-time high.

Meanwhile, bond yields headed higher again but a moderate pace with the 10-year adding 1.2 basis points to close at 1.746%.

Still, something seems out of whack in that equities should have reacted negatively to the sharp spike in bond yields over the past week. Rising yields indicate a strong economy, which on one hand is praised by the administration, while at the same time Trump is exerting tremendous pressure on the Fed (boneheads) to cut rates “to ZERO or less.” This makes me continue to ponder the question “why do we need rates at zero if the economy is so great?”

The assist for today’s push higher came again from the continued short-squeeze—up an incredible 12.75% in the last 6 days, according to ZH. This is the biggest short squeeze we’ve seen since August 2011, which explains why SmallCaps may have found a new life—at least for the moment, but how long can that last?

Read More

Spiking Into The Close

Ulli Market Commentary Contact

[Chart courtesy of MarketWatch.com]
  1. Moving the markets

Throughout the session, the major indexes hovered below their respective unchanged lines, as US-China trade news offered a mixed picture, while a look ahead to the upcoming central bank policy meetings kept traders on edge.

Except for a last-minute spike in equities, interest rates kept a lid on advances with the 10-year bond yield rising over 8 basis points to end the day at 1.73%, which is quite a rebound considering that just recently we breached the 1.5% level to the downside.

These are huge moves, as the bond bloodbath continues, so it comes as no surprise that the victims over the past few days have been bond prices, as well as the low volatility ETFs (SPLV and USMV), which have been surrendering some of their superior gains. For context, 10-year yields are up 5 days in a row, gaining an amazing 24 basis points, which is the biggest jump since Trump’s election in 2016.

There seems to be a global re-shuffling of assets going on, as the unwind has pushed cyclicals higher and defensives lower with Transportations and SmallCaps suddenly surging, while the Nasdaq tumbled most of the day, but it was pushed to almost even at the close.

ZH reports that the most shorted stocks went on a rampage by soaring this week and actually registering the biggest 5-day short squeeze since the beginning of this year.

It was a rollercoaster kind of day, and I would not be surprised to see the Volatility Index (VIX) make a move again, as Fed policy uncertainty has hit record highs.

Read More

No Market Commentary

Ulli Uncategorized Contact

Due to a variety of business commitments, I will not be able to write today’s market commentary. Regular posting will resume. tomorrow.

Ulli…