Bitcoin Soars, Gold Glows, Equities Slide: A Volatile Day Across Asset Classes

Ulli Market Commentary Contact

[Chart courtesy of MarketWatch.com]

  1. Moving the market

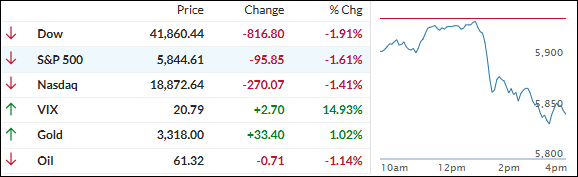
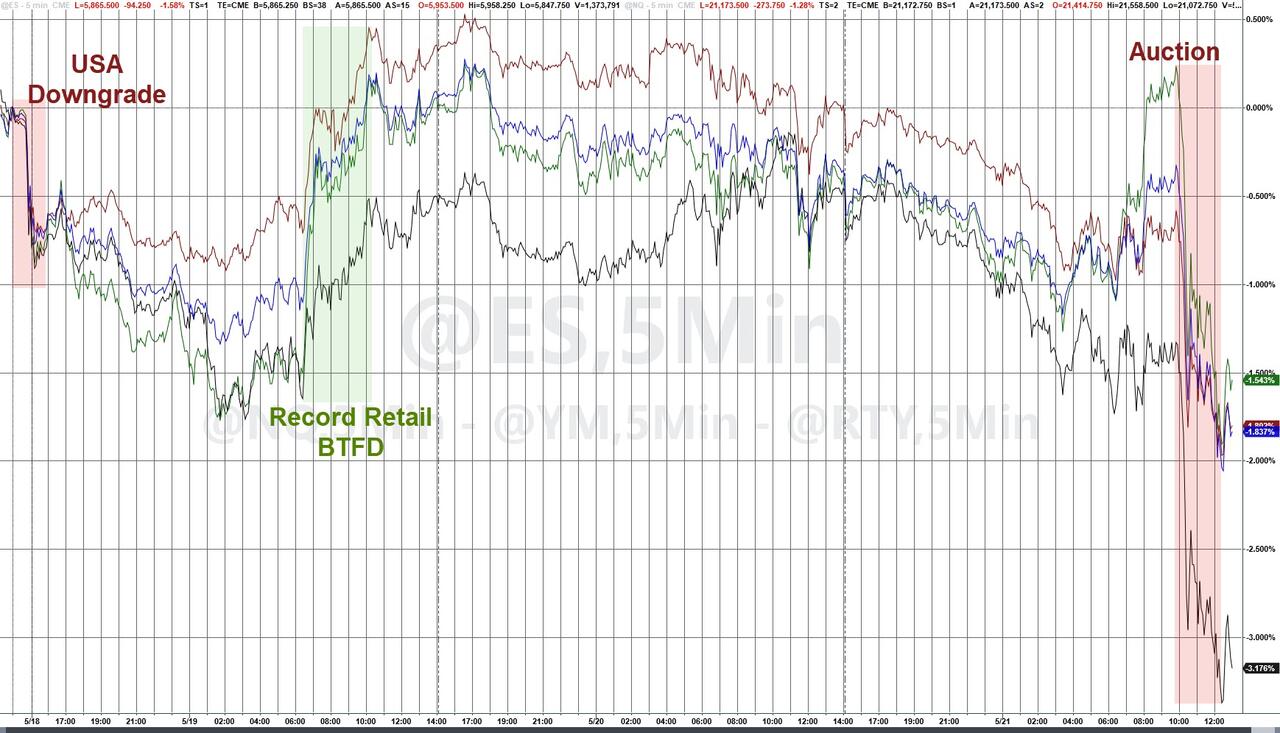
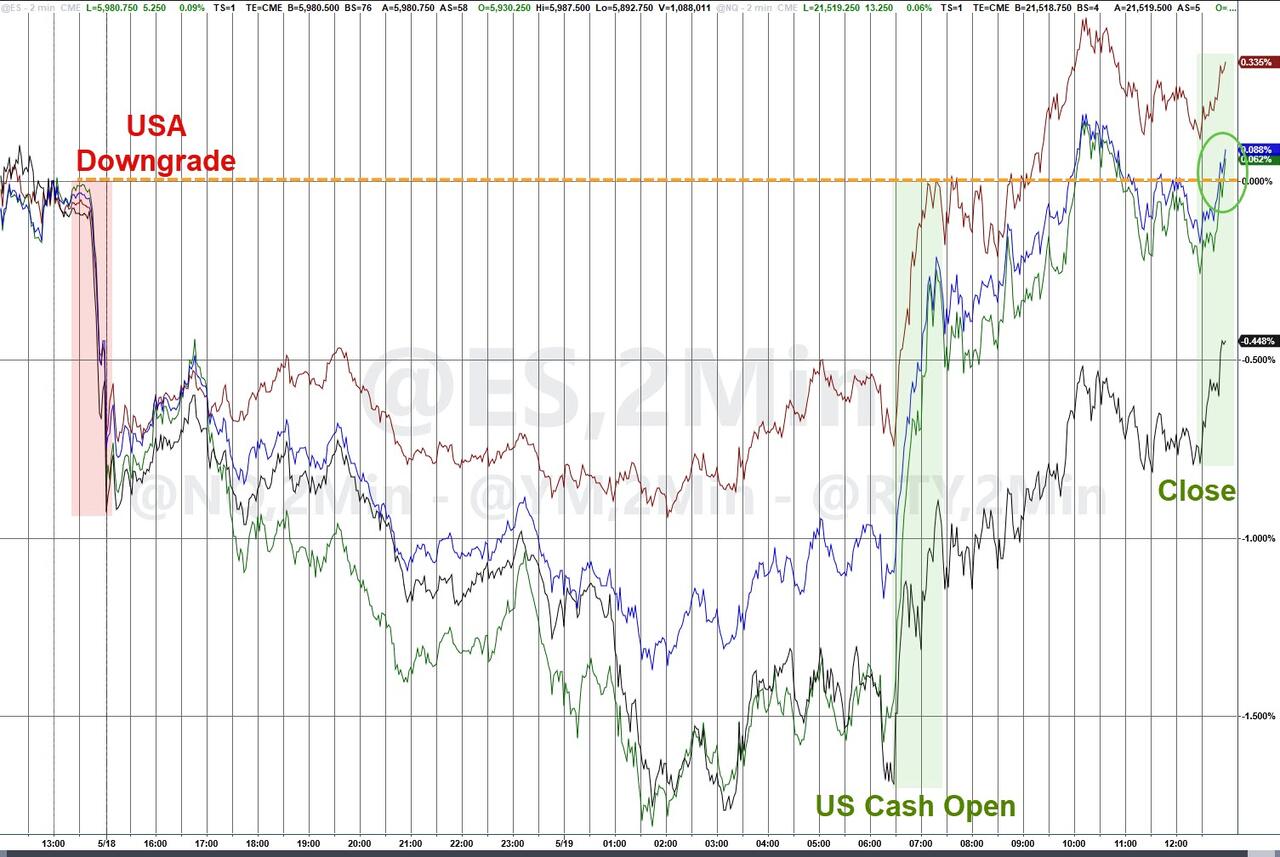
The markets opened on a weak note as rising bond yields and uncertainty surrounding the U.S. budget bill weighed on sentiment.

Traders remained focused on developments in Washington, where Republican leaders are working to finalize a bill aimed at lowering taxes while expanding deductions for state and local taxes. While potentially beneficial for taxpayers, the proposal could worsen fiscal deficits and reverse recent efforts at budgetary restraint.

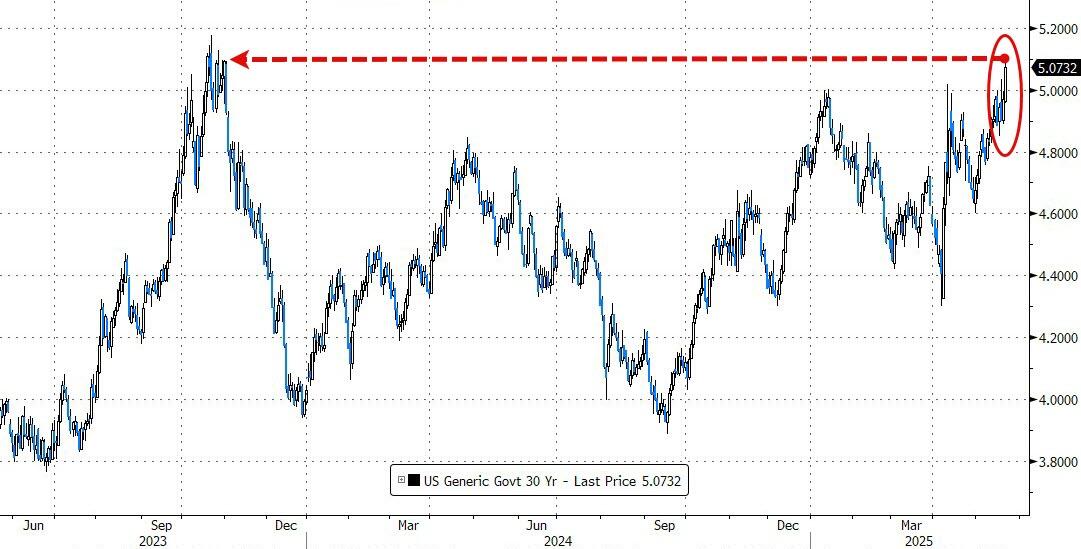
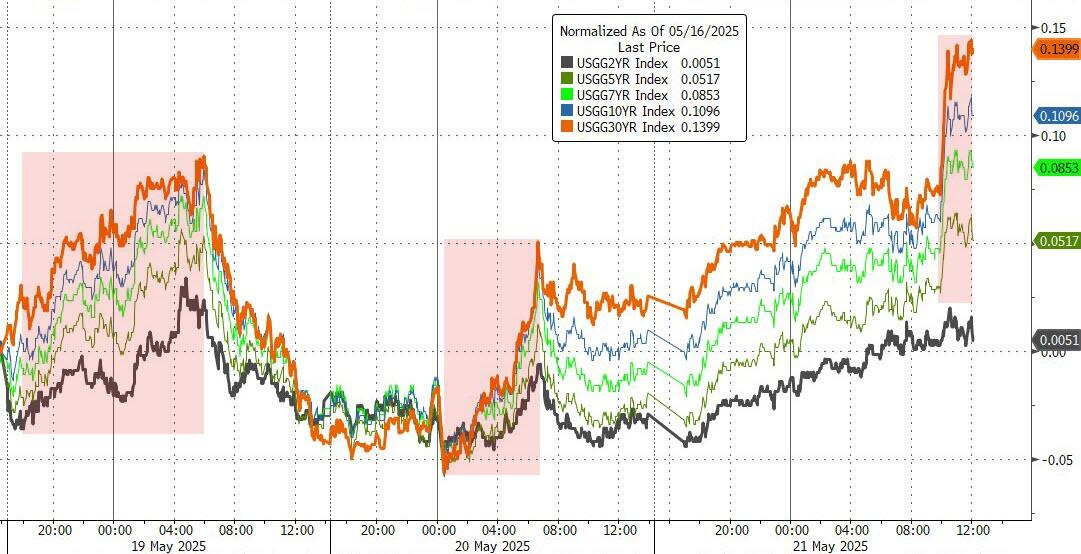
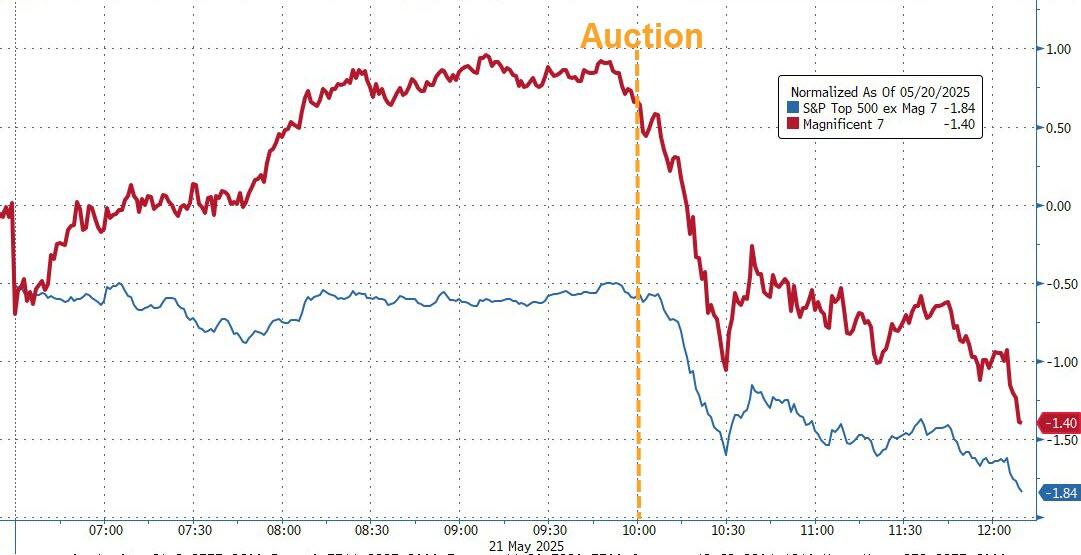
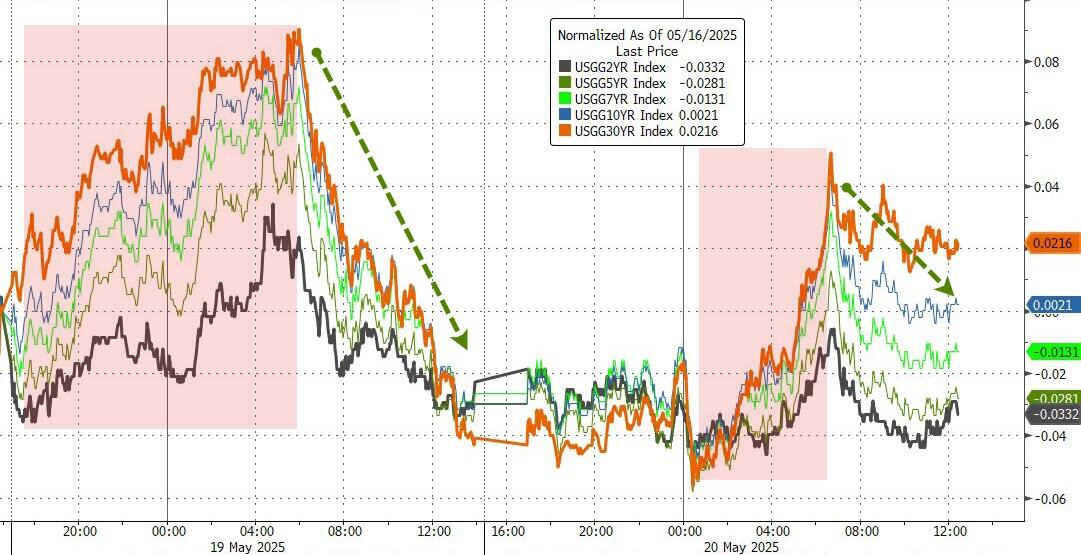
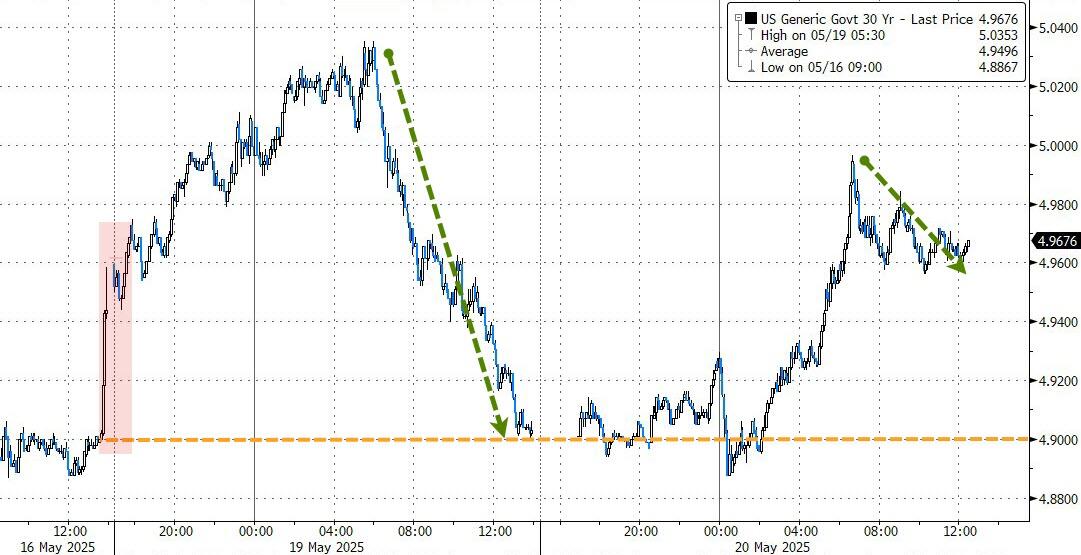
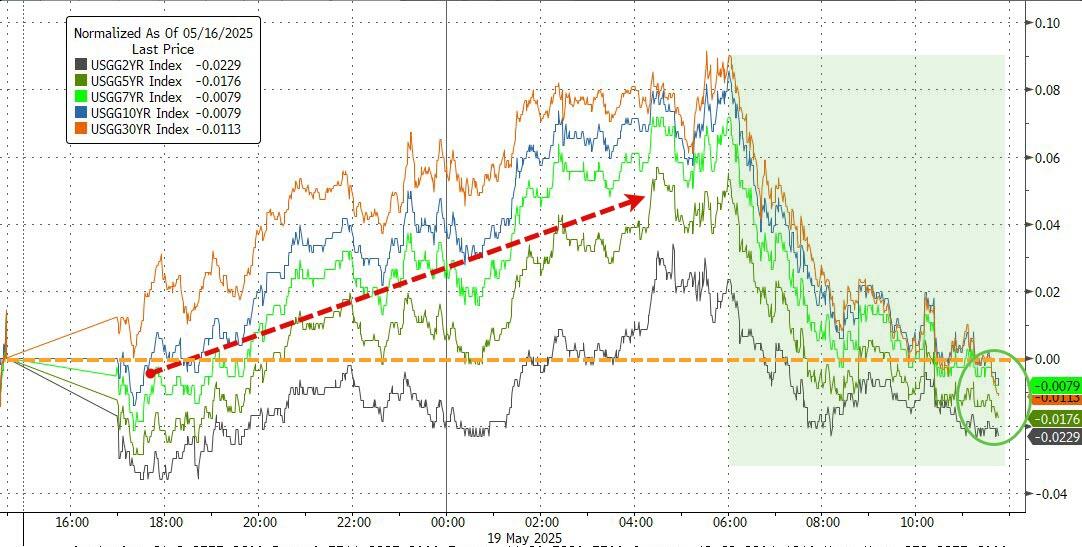
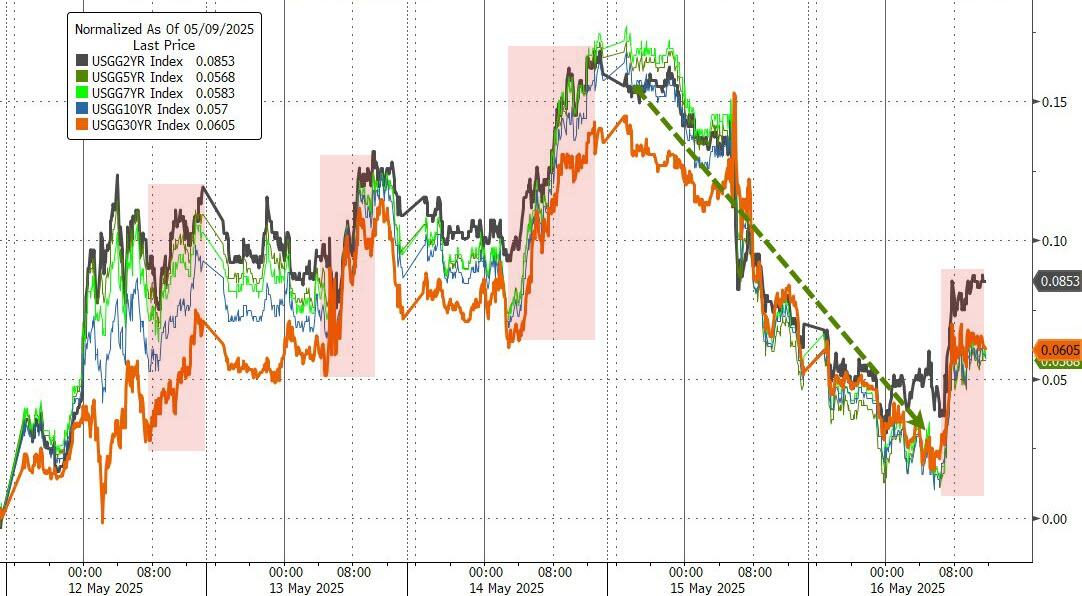
Analysts expressed concern that the bill may do little to curb inflation or reduce national debt. These worries were reflected in the bond market, where yields climbed, pushing the 30-year back above the 5% mark. Confidence was further shaken by a poorly received 20-year bond auction, which reignited fears about bond market stability and drove yields even higher.

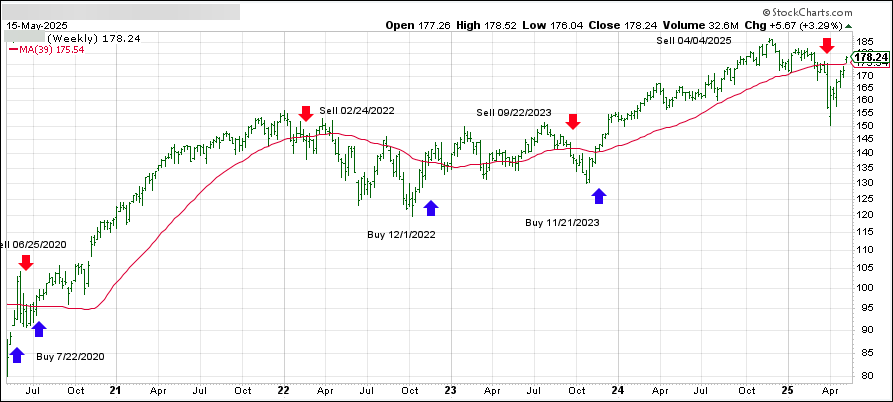
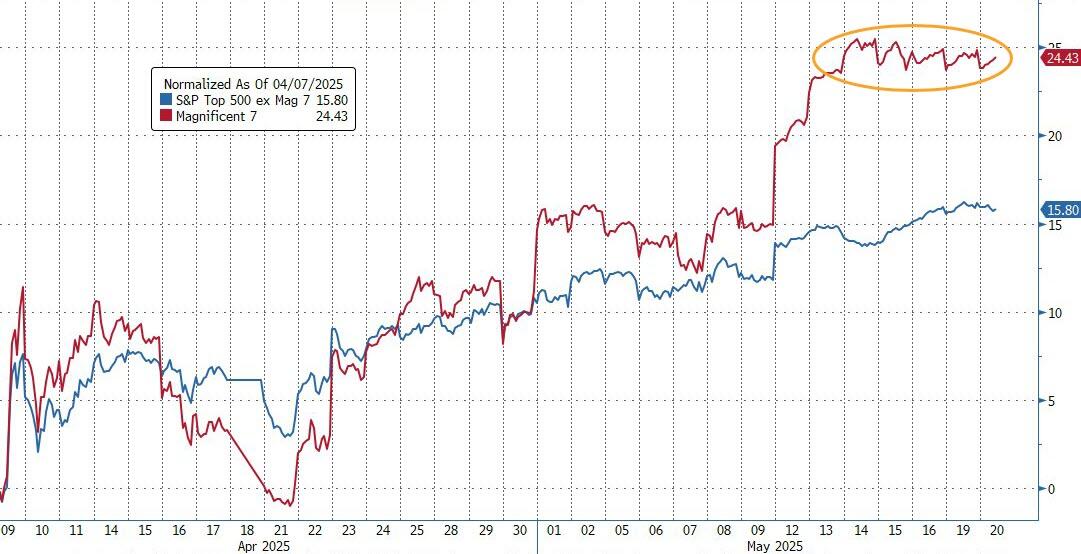
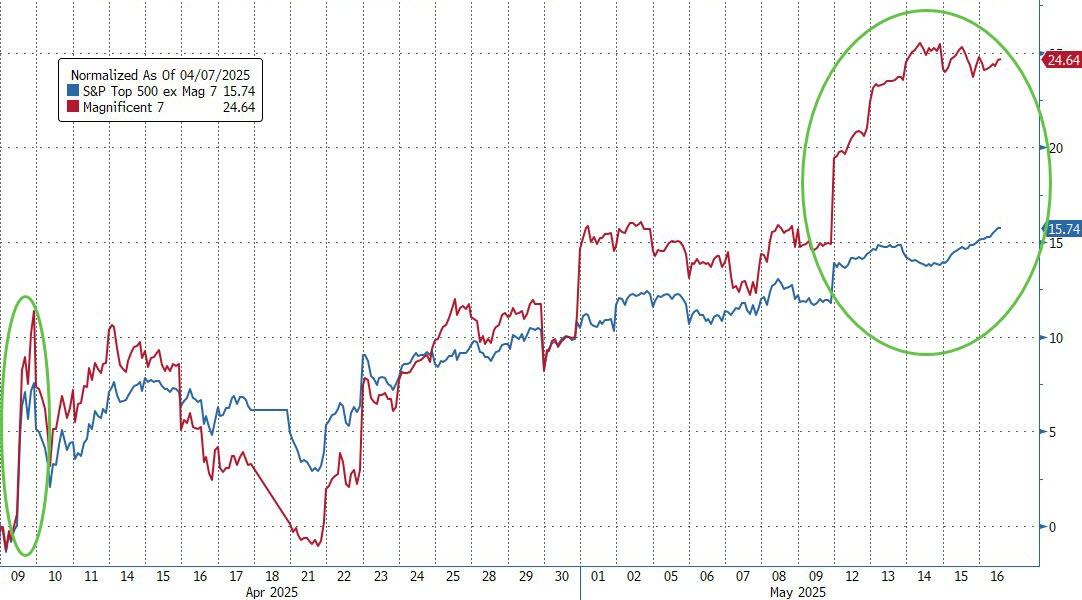
The spike in yields derailed a budding rally in equities. The major indexes reversed sharply into the close, with even the previously resilient “Magnificent Seven” stocks turning red. For the second consecutive day, retail dip buyers were notably absent—a trend highlighted by ZeroHedge.

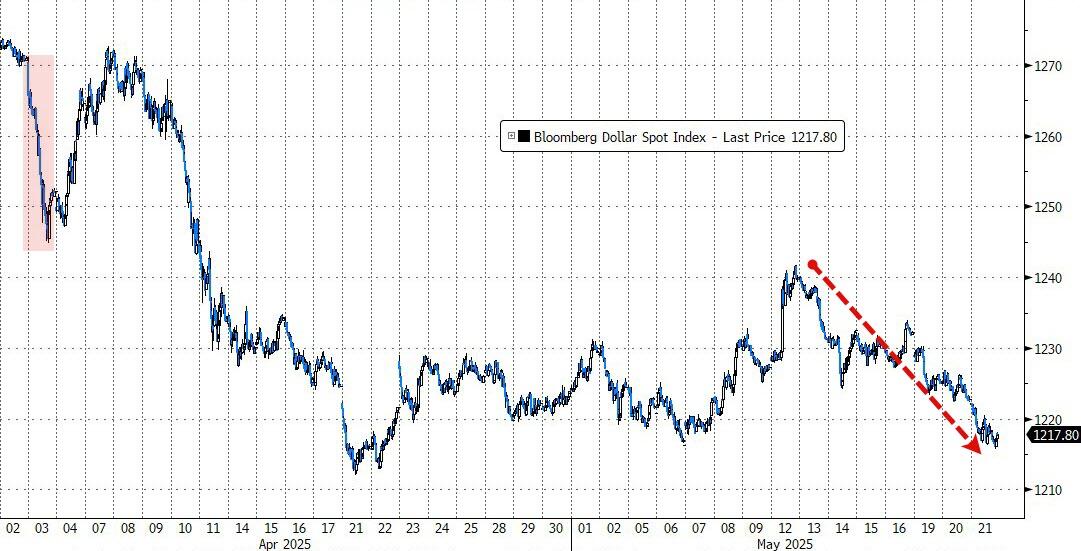
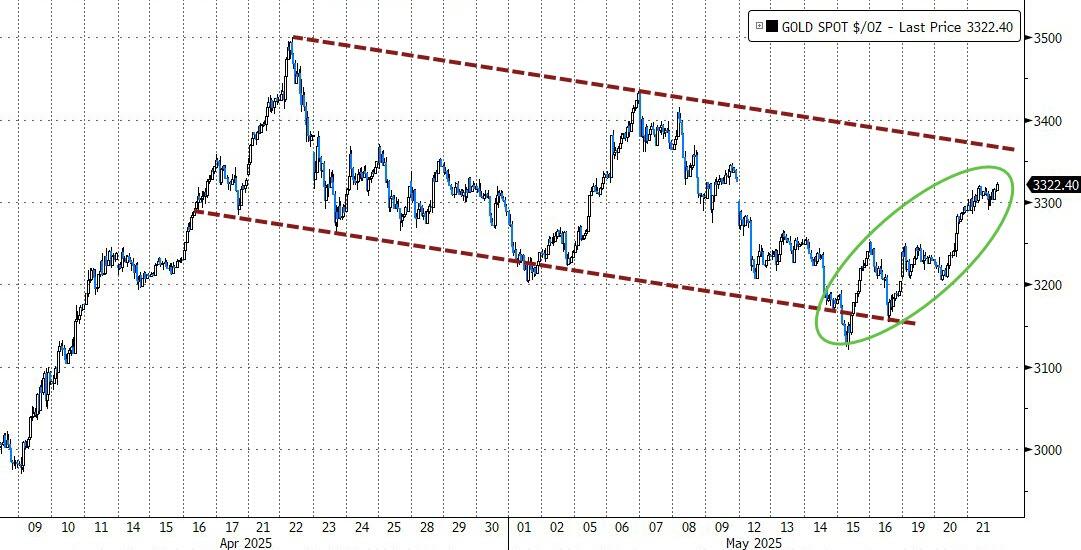
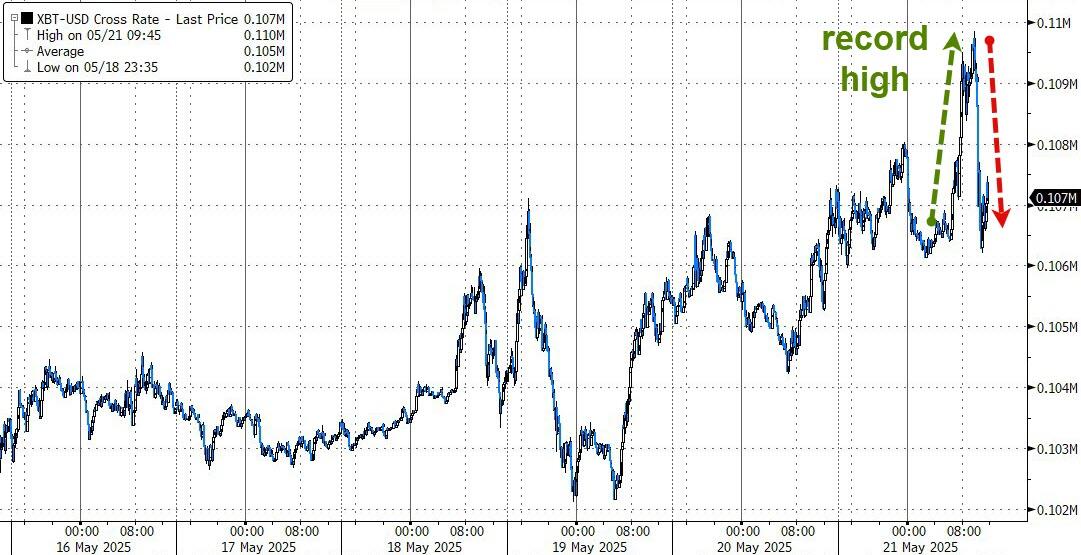
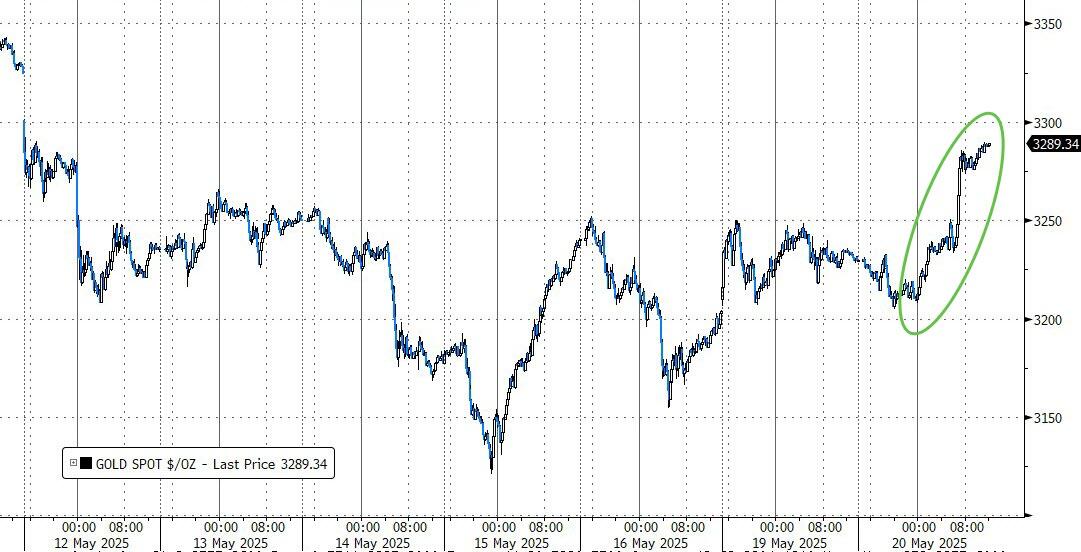
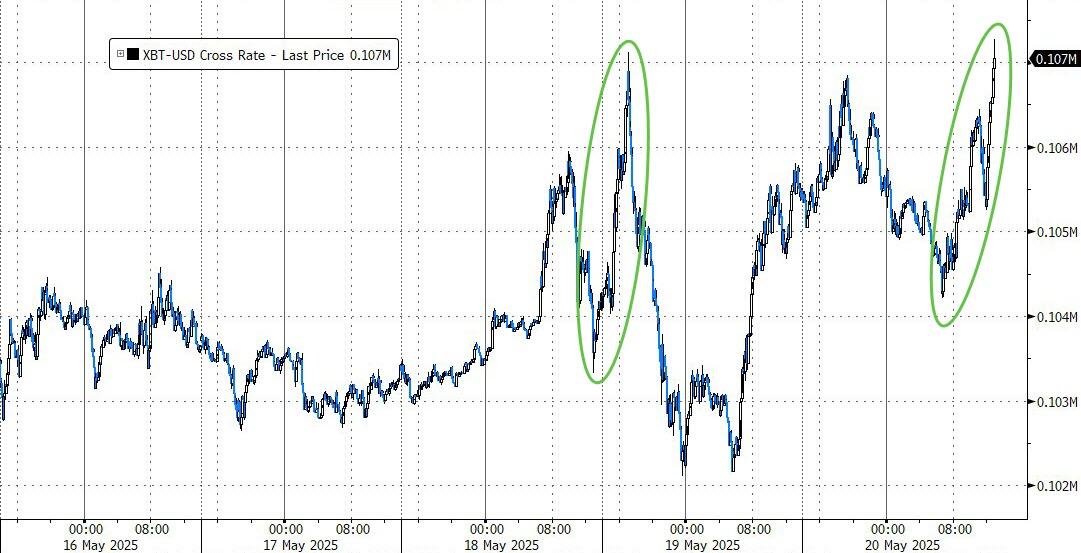
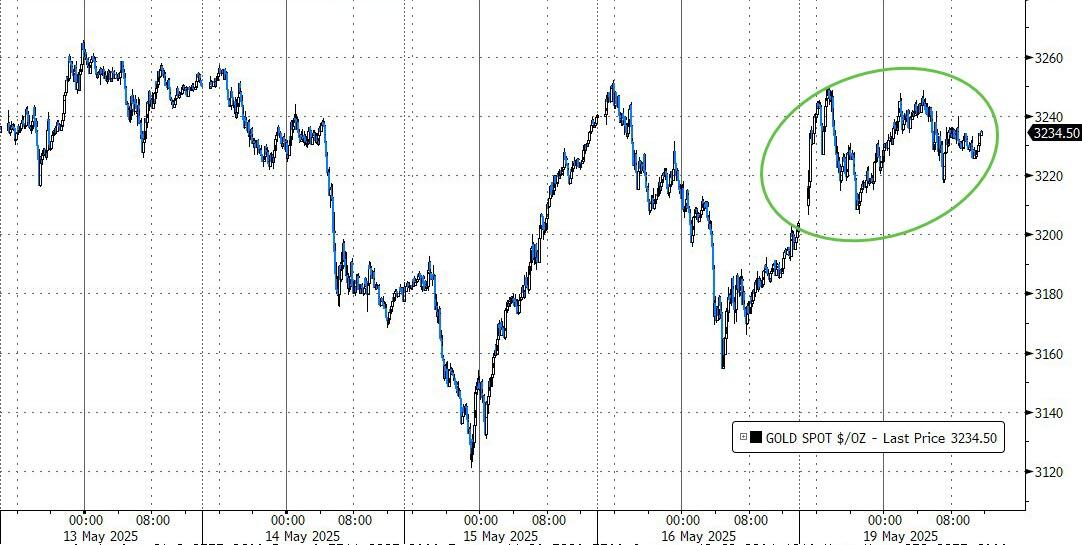
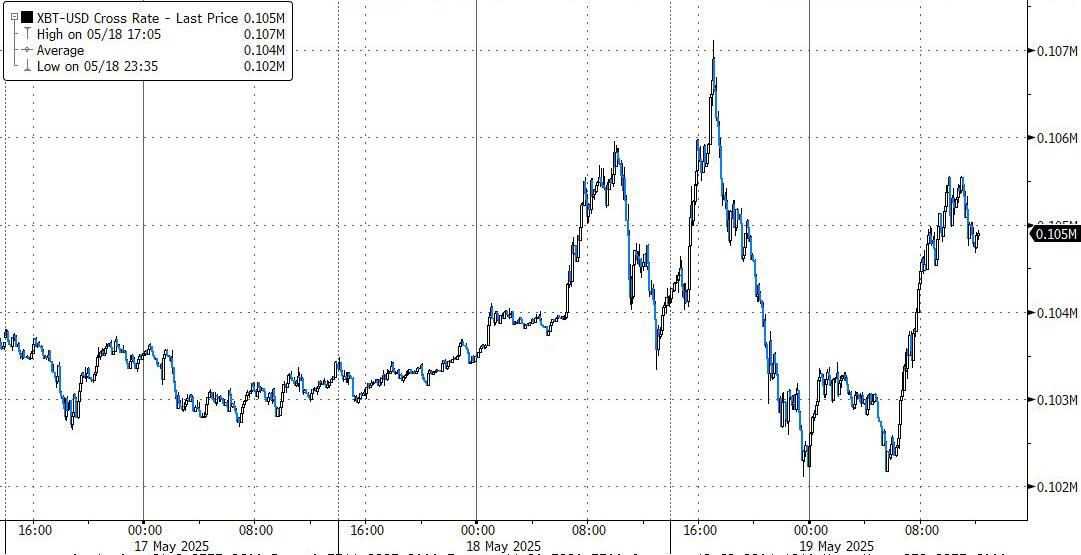
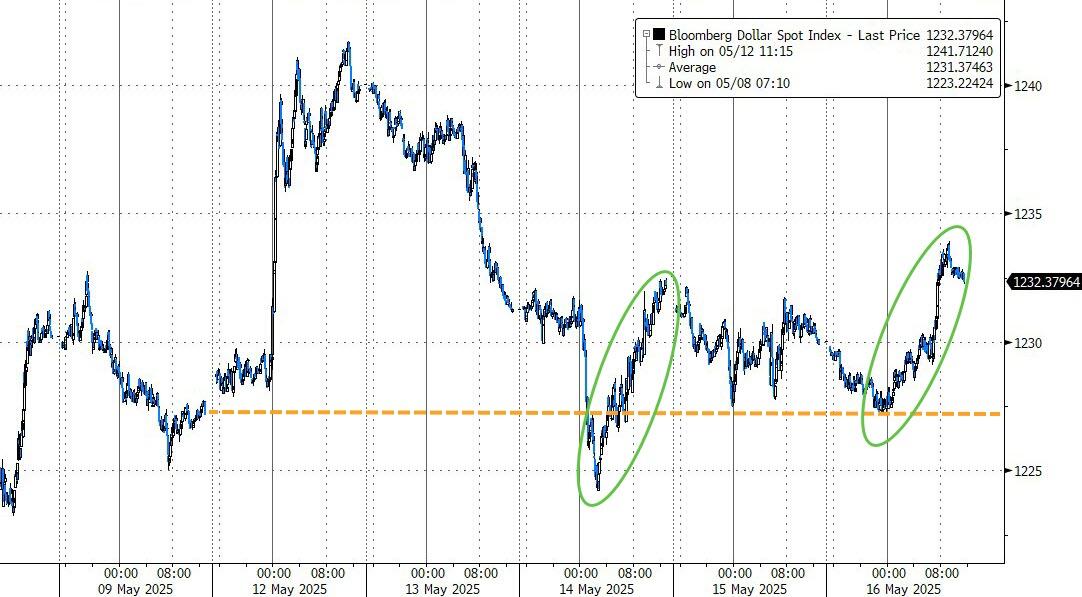
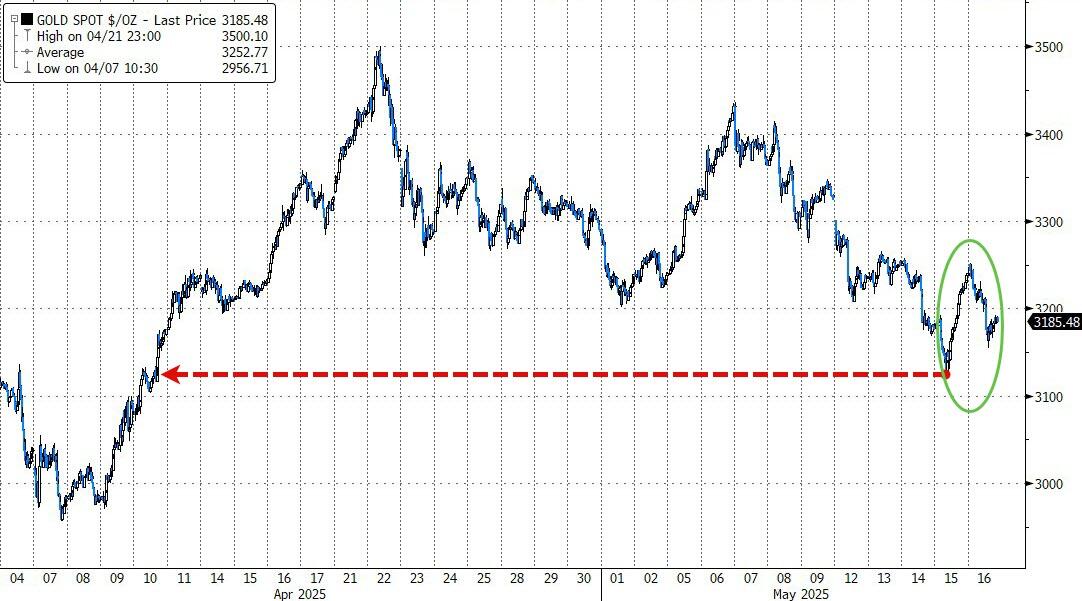
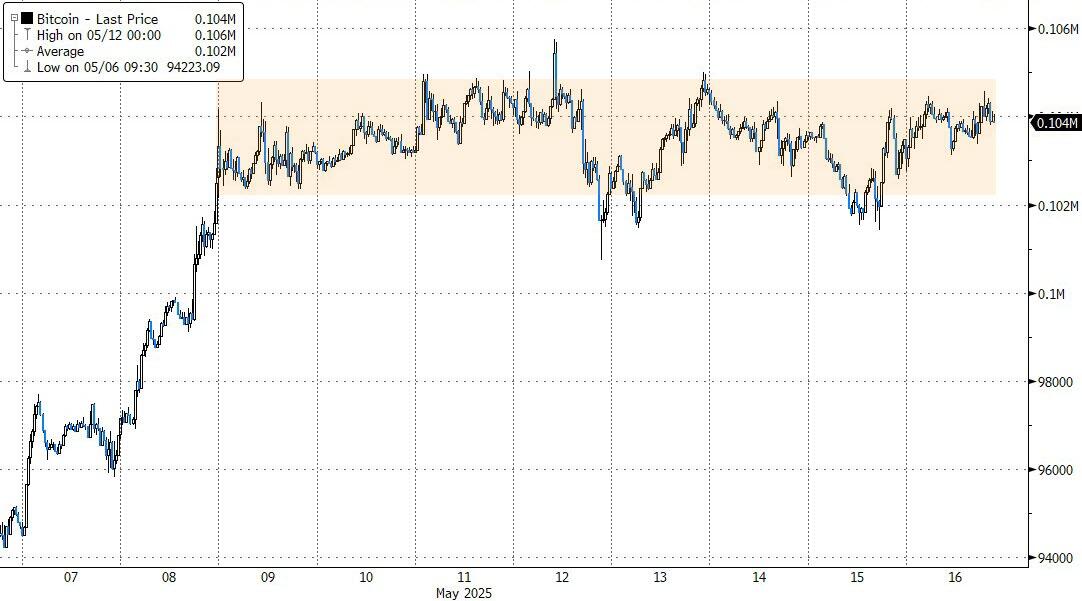
As interest rates rose, the U.S. dollar weakened, gold reclaimed the $3,300 level, and Bitcoin surged to a new high of $109,500 before pulling back.

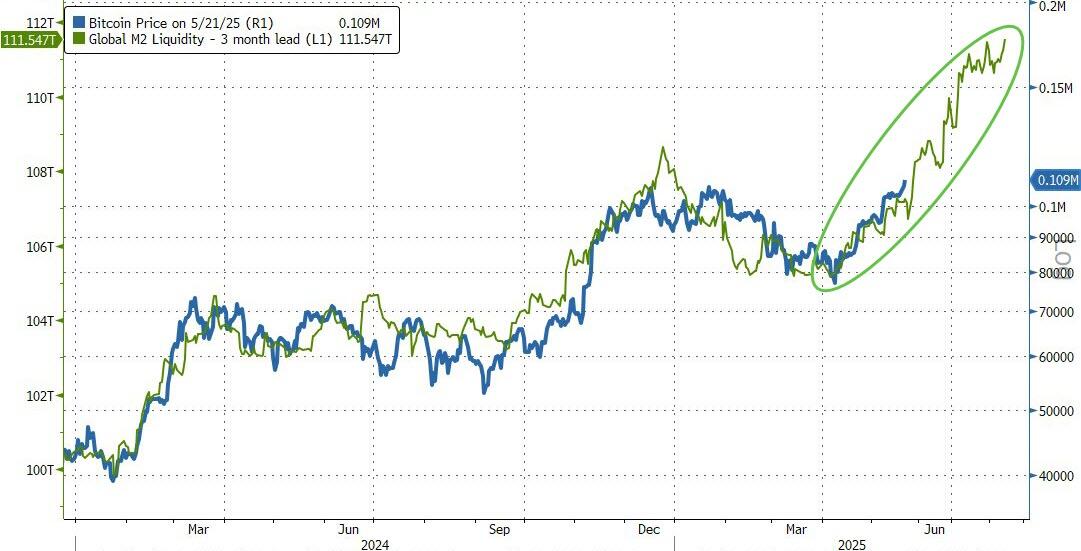
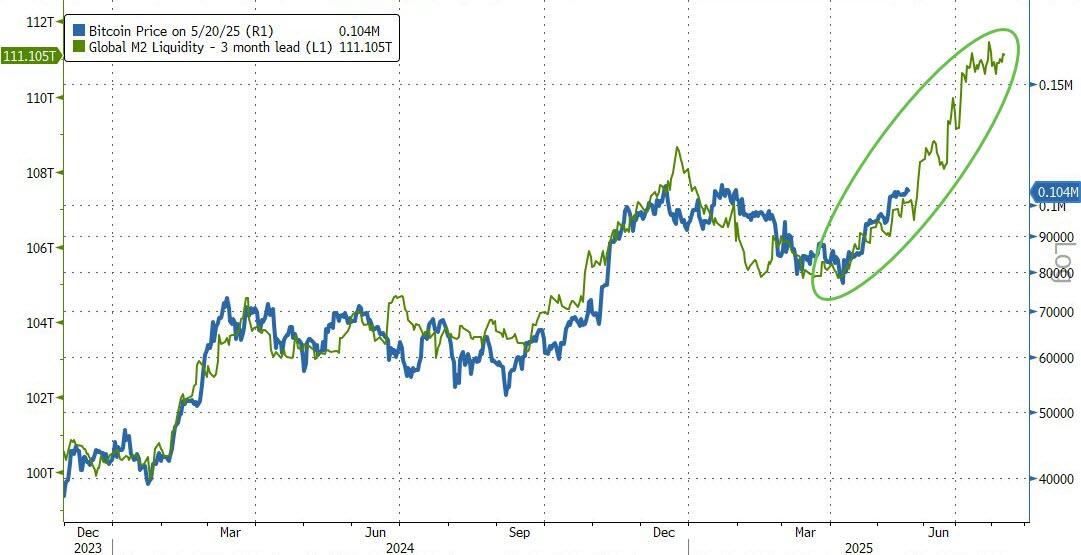
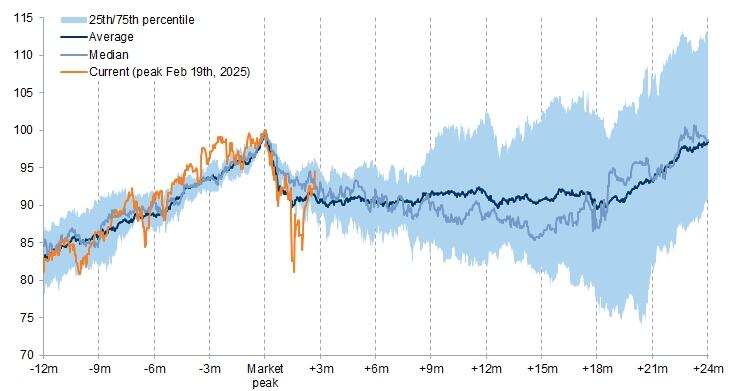
One analyst suggested that if Bitcoin continues to track global liquidity trends, it could reach $170,000 by August.

That’s a bold call—could he be right, or is this a case of irrational exuberance?

Read More

Gold Shines, Bitcoin Soars, But Equities Struggle For Direction

Ulli Market Commentary Contact

[Chart courtesy of MarketWatch.com]

  1. Moving the market

A lack of positive sentiment weighed on early trading, sending the major indexes into the red, with the tech sector leading the decline. Despite a late-session recovery attempt, the indexes remained below their opening levels, as overall market momentum appeared subdued.

The S&P 500 has staged an impressive rebound from its April lows and now sits within 3% of its all-time high set in February. Much of this rally has been fueled by optimism surrounding tariff-related developments.

However, with the 90-day tariff pause with China set to expire in August, uncertainty looms. Whether the current tone of de-escalation continues will be key to determining if the market can break into new record territory.

Meanwhile, the “Magnificent 7” stocks continued their sideways drift, mirroring the broader market’s indecision.

Bond yields edged higher, with the 30-year briefly testing the 5% mark before easing back. The dollar softened, giving gold a boost—up nearly 2%—though it stopped short of breaching the $3,300 level.

Bitcoin surged past $107,000, continuing its rally in line with expanding global liquidity.

Read More

U.S. Credit Downgrade Sparks Volatility: Gold Rallies, Dollar Slips

Ulli Market Commentary Contact

[Chart courtesy of MarketWatch.com]

  1. Moving the market

The major indexes opened in negative territory as markets reacted to Moody’s decision to downgrade the U.S. credit rating from AAA to Aa1. The move was driven by mounting concerns over the ballooning federal deficit and the challenges of refinancing government debt at higher interest rates.

This downgrade immediately pressured bond prices, sending yields sharply higher as investors demanded greater compensation for increased risk. Early session uncertainty was further compounded by lingering questions about the full impact of recent tariff policies on the broader economy.

Despite these headwinds, sentiment gradually improved throughout the day. As the session progressed, bond yields reversed course and dipped, while equities clawed back their losses and managed to close slightly in the green.

In the commodities space, gold rallied strongly, approaching the $3,250 level as investors sought safe-haven assets amid fiscal uncertainty and rising debt.

The dollar, meanwhile, weakened, falling back to last week’s lows, while Bitcoin experienced notable volatility, swinging from $107,000 to $102,000 before rebounding to $105,000.

Today’s market action confirmed our new domestic “Buy” signal, effective tomorrow, May 20. In anticipation, I took advantage of the early dip to establish new positions for client portfolios.

With the U.S. credit rating now downgraded and fiscal challenges mounting, will this rebound in equities prove sustainable, or are markets underestimating the long-term risks posed by rising debt and elevated borrowing costs?

Read More

ETFs On The Cutline – Updated Through 05/16/2025

Ulli ETFs on the Cutline Contact

Do you want to know which ETFs are hot and which ones are not? Then you need my High-Volume ETF Cutline report. It tells you how close or far each of the 311 ETFs I follow is from its long-term trend line (39-week SMA). These are the ETFs that trade more than $5 million a day, so they are not some obscure funds that nobody cares about.

The report is split into two parts: The winners that are above their trend line (%M/A), and the losers that are below it. The yellow line is the line of shame that separates them. You can see how many ETFs are in each group and how they have changed since the last report (131 vs. 200 current).

Take a peek:

The HV ETF Master Cutline Report

If you are confused by some of the terms we use, don’t panic. I have a helpful Glossary of Terms for you.

If you want to learn more about the Cutline method and how it can make you rich (or at least less poor), read my original post here.

ETF Tracker Newsletter For May 16, 2025

Ulli ETF Tracker Contact

ETF Tracker StatSheet          

You can view the latest version here.

TARIFF TRUCE AND SOFT INFLATION DATA SPARK MARKET REBOUND DESPITE CAUTION

[Chart courtesy of MarketWatch.com]

  1. Moving the market

The markets began the day on a cautious note, with a disappointing consumer sentiment report halting the S&P 500’s four-day rally-a run that had been fueled by a temporary U.S./China tariff agreement and encouraging inflation data.

Despite the initial pause, the major indexes regained strength as the session progressed, buoyed by renewed optimism over global trade policy and softer-than-expected inflation figures.

The S&P 500 has rebounded sharply since the announcement of the 90-day tariff truce, now breaking above its widely watched 200-day moving average-a technical milestone often interpreted as a bullish signal.

Our domestic TTI has mirrored this upward momentum, and unless there is a sudden reversal, I anticipate re-entering domestic equities by next week.

However, consumer sentiment weighed on traders’ enthusiasm early in the session. The latest reading fell to 50.8 in May from 52.2 in April, while inflation expectations for the coming year surged to 7.3% from 6.5%, reflecting growing concerns about the impact of Trump’s tariff policies.

As the day unfolded, uncertainty over global trade policy eased and “soft” economic data improved, helping the major indexes stabilize and allowing bullish sentiment to return. Notably, inflation-related macroeconomic data continued to surprise to the downside, as highlighted by ZeroHedge.

This week also saw the largest short squeeze since last Thanksgiving, driving the Mag7 basket to continue its impressive rebound. Bond yields climbed for the third consecutive week, yet this rise did not negatively impact equities—a divergence from typical market behavior.

Meanwhile, the dollar strengthened for a second week, pressuring gold prices lower as some market uncertainties subsided. Bitcoin, after five weeks of gains, ended the week unchanged.

It’s worth noting that equities have just experienced one of the sharpest drawdowns in the past 75 years but have managed a swift recovery. Still, historical patterns suggest that the path for further gains may be challenging from here.

Regardless, we will continue to follow our TTIs, with a new “Buy” signal likely to be confirmed on Monday.

Still, the question remains: With markets at a crossroads, will the recent rebound prove sustainable, or will historical trends reassert themselves and cap further gains?

Read More

Weekly StatSheet For The ETF Tracker Newsletter – Updated Through 05/15/2025

Ulli ETF StatSheet Contact

ETF Data updated through Thursday, May 15, 2025

How to use this StatSheet:

  1. Out of the 1,800+ ETFs out there, I only pick the ones that trade over $5 million per day (HV ETFs), so you don’t get stuck with a lemon that nobody wants to buy or sell.
  1. Trend Tracking Indexes (TTIs)

These are the main indicators that tell you when to buy or sell Domestic and International ETFs (section 1 and 2). They do that by comparing their position to their long-term M/A (Moving Average). If they cross above, and stay there, it’s a green light to buy. If they fall below, and keep going, it’s a red light to sell. And to make sure you don’t lose your shirt if things go south, I also use a 12% trailing stop loss on all positions in these categories.

  1. All other investment areas don’t have a TTI and should be traded based on the position of each ETF relative to its own trend line (%M/A). That’s why I call them “Selective Buy.” In other words, if an ETF goes above its own trend line, you can buy it. But don’t forget to use a trailing sell stop of 12%, or less if you’re feeling nervous.

If some of these words sound like Greek to you, please check out the Glossary of Terms and new subscriber information in section 9.

  1. DOMESTIC EQUITY ETFs: SELL— effective 4/4/2025

Click on chart to enlarge

This is our main compass, the Domestic Trend Tracking Index (TTI-green line in the above chart). It has now broken above its long-term trend line (red) by +1.68% but remains in “Sell” mode until we get more upside follow through.

Read More