Recovering From An Early Sell-Off

Ulli Market Commentary Contact

[Chart courtesy of MarketWatch.com]
  1. Moving the markets

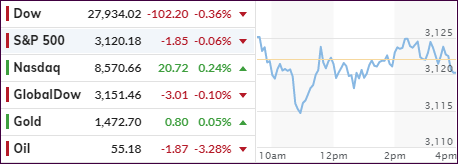
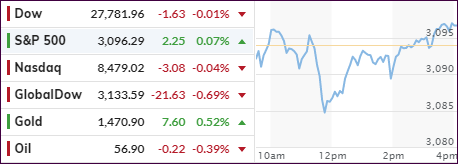
Today we experienced a market condition, which we have not seen in a while, namely not just an intra-day sell off, but also a red close of more than the occasional shocking -0.01%, at least for the Dow. Of course, I am being facetious here, but the usual end of the day ramp saved the S&P 500 and Nasdaq.

However, given the relentless march higher, today’s partial retreat was more than overdue. A slightly positive opening gave way to a gentle slide into the red zone, but the bullish theme remained strong enough to assist in the recovery.

Not helping matters were disappointing earnings results and the good old standby excuse that a US-China deal has become questionable.

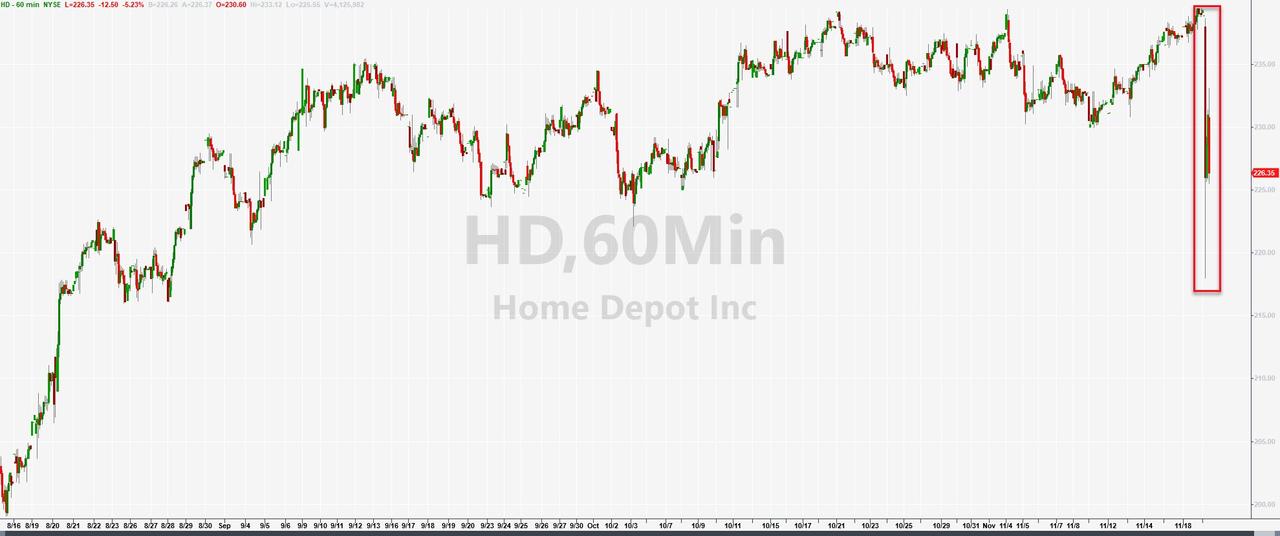
Home Depot’s shares took a hit with the company not just posting a miss in Q3 sales, but more importantly, they slashed their full-year sales guidance as well. Ouch! However, offsetting that poor report was a rise in US home building and permits for future construction.

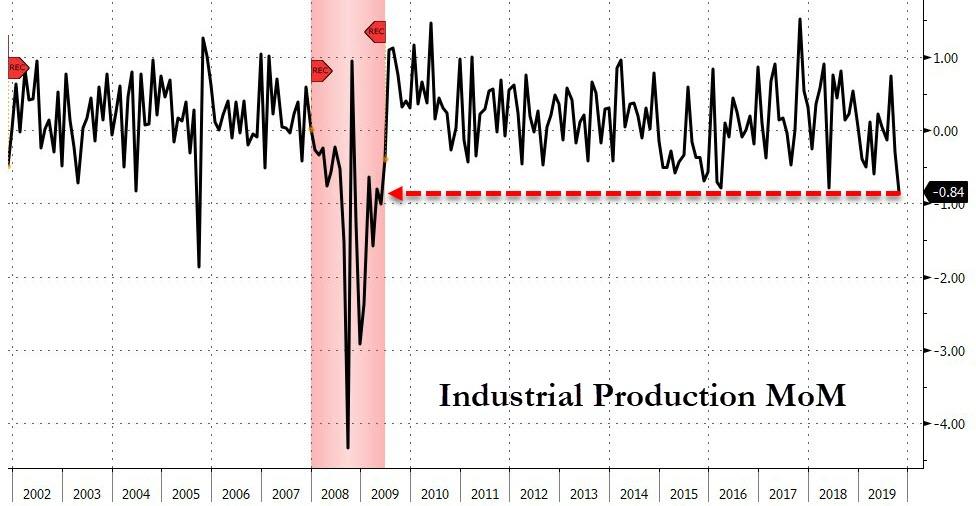
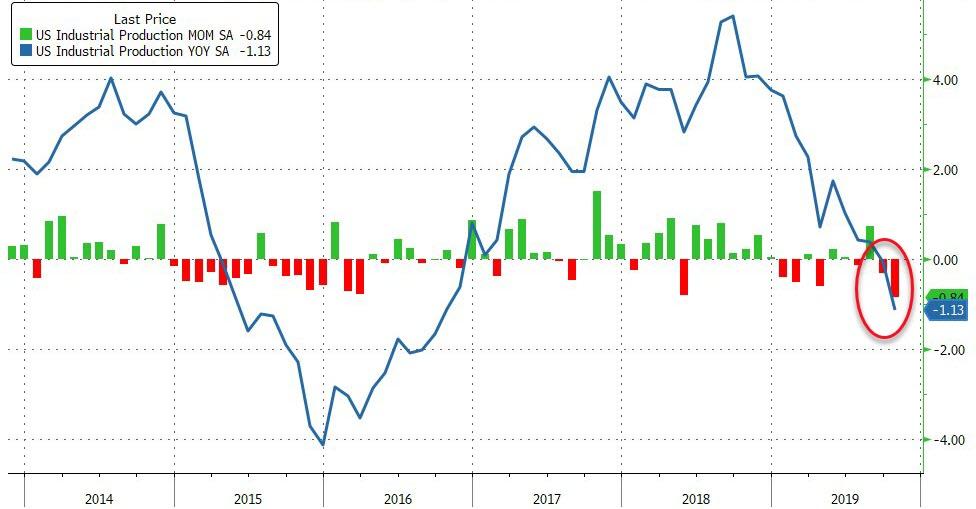
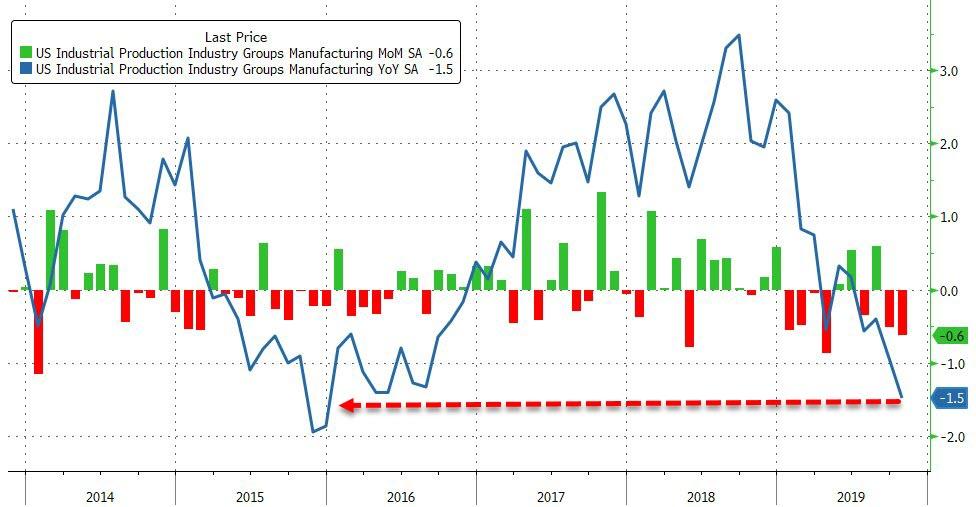
Clearly, the economy, despite being hyped up, is mixed bag at best. Even the Fed’s John Williams seems to agree as he posted things like “the economy is clearly facing several challenges, primarily from overseas, but the three rate cuts since July should help sustain growth,” on which he elaborated further with the US “facing headwinds from slower global growth.”

In the end, nothing much was gained or lost, except the Nasdaq remained on the plus side all day and added +0.24%. At least the tech arena showed signs of life in the face of a sinking retail sector, where the stocks of Home Depot and Kohls were sent reeling.

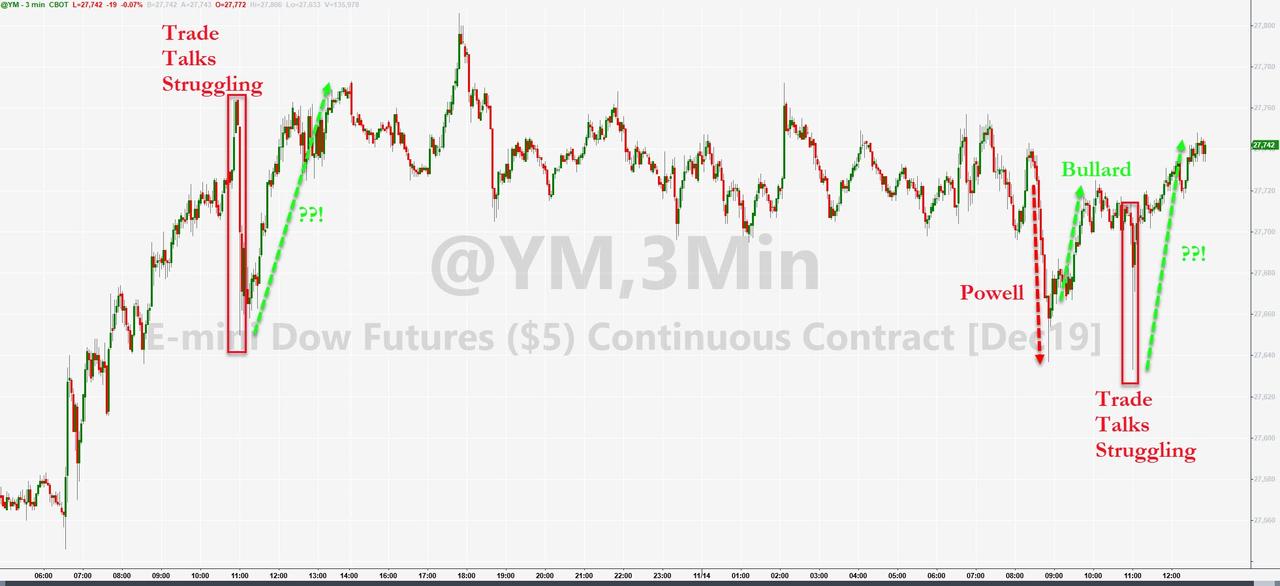
With no obvious driver to help the markets today, I imagine that we will see a new rollout of “the trade deal is close” headlines latest by tomorrow, in order to pump stocks further into record territory.  

Read More

Trump-Powell Pow Wow Keep Markets Elevated

Ulli Market Commentary Contact

[Chart courtesy of MarketWatch.com]
  1. Moving the markets

When the Fed announced a few weeks ago that it would be buying up Treasury debt to the tune of $60 billion a month, it sure sounded to everyone on Wall Street that another round of QE (Quantitative Easing) had started. However, Fed chief Powell insisted that this is “in no sense is QE.” Yeah right.

Author Charles Hugh Smith wasn’t in agreement either and quoted in a recent post a riddle that Abraham Lincoln was known to have told: “If I should call a sheep’s tail a leg, how many legs would it have? — Five! — “No, only four; for my calling the tail a leg would not make it so.”

That is a great analogy to the Fed’s QE implantation which, despite all denials, is a bailout of some sort, most likely of the repo market, about which I have commented on from time to time. And, as this chart depicts, it may have been a panic reaction, and I am certain that this will not be the last we’ve heard about repo issues.

While the major indexes see-sawed throughout the day, the bullish bias remained intact with the Dow and Nasdaq eking out tiny gains, but the S&P slipped a fraction. These small moves were actual significant in that the usual driver, namely US-China trade news, was neutralized.

There were announcements about “progress” and “setbacks,” cancelling each other out, which is what market direction reflected. Over the weekend, we learned that top negotiators held “constructive” discussions, but other reports suggested that without rolling back existing tariffs, the outlook for a resolution looked questionable.

With trade news playing an immaterial role in the market today, traders focused on a meeting between Trump and Powell, with speculation running wild as to what these two discussed. Trump released this statement:

Just finished a very good & cordial meeting at the White House with Jay Powell of the Federal Reserve. Everything was discussed including interest rates, negative interest, low inflation, easing, Dollar strength & its effect on manufacturing, trade with China, E.U. & others, etc.

I am sure that by tomorrow morning, the computer algos may have found some more bullish meat on that bone, probably just enough to keep the ramp going. If that doesn’t work, there is always another short squeeze to be done, just like we saw today, which gave a big assist in pulling the indexes off their lows. (Source: Bloomberg)

Read More

ETFs On The Cutline – Updated Through 11/15/2019

Ulli ETFs on the Cutline Contact

Below, please find the latest High-Volume ETF Cutline report, which shows how far above or below their respective long-term trend lines (39-week SMA) my currently tracked ETFs are positioned.

This report covers the HV ETF Master List from Thursday’s StatSheet and includes 322 High Volume ETFs, defined as those with an average daily volume of more than $5 million, of which currently 281 (last week 282) are hovering in bullish territory. The yellow line separates those ETFs that are positioned above their trend line (%M/A) from those that have dropped below it.

Take a look:                                                                   

The HV ETF Master Cutline Report

In case you are not familiar with some of the terminology used in the reports, please read the Glossary of Terms. If you missed the original post about the Cutline approach, you can read it here.      

ETF Tracker Newsletter For November 15, 2019

Ulli ETF Tracker Contact

ETF Tracker StatSheet          

You can view the latest version here.

DRIVING THE MARKETS: TRADE HOPE AND RETAIL HEADLINE

[Chart courtesy of MarketWatch.com]
  1. Moving the markets

While today’s headline retail number showed a rise of +0.3% MoM, which was better than the expected +0.2%, the under the hood core number looked mixed at best by only rising +0.1% MoM vs. an expected +0.3%. But headline news are what computer algos read, so up we went.

The initial boost came from alleged positive US-China trade war developments, with the White House econ advisor Kudlow saying Thursday night that “negotiators are getting close to an agreement,” however, Trump added that “he likes what he sees, he’s not ready to make a commitment, we have no agreement just yet.”

In other words, there is no deal, only promises and possibilities, but that’s all it takes these days to keep traders and algos happy, a condition which pushed the major indexes into new all-time territory.

Even poor economic news good not stem the march higher. US MoM Industrial Production plunged the most since March 2009, as October’s -0.8% collapse  led to a YoY decline of -1.13%. In addition, Manufacturing output fell -0.6%, its weakest reading since December 2015 (Source: ZeroHedge).  

I am merely pointing this out to clarify that the stock market and the underlying economy are in no way connected, and that a high level of stock prices does not indicate a solid economic environment.

This is further confirmed by the fact that the GDP for Q4 2019 has crashed with the US economy growing at its slowest pace in 4 years, as the Fed’s tracking estimates having tumbled by over 0.4% just the past week. The US GDP in Q4 2019 is now set to print at around 0.35%, which is anemic and in no way justifies the current level of stock indexes.

But that is not what matters. What is critically important for the continuation of the bullish ramp, as I pointed out before, is the liquidity in the market, which has been created by an increase in the Fed’s balance sheet. It grew by some $280 billion in the past two months alone and is directly responsible for driving equities relentlessly higher.

Read More

Weekly StatSheet For The ETF Tracker Newsletter – Updated Through 11/14/2019

Ulli ETF StatSheet Contact

ETF Data updated through Thursday, November 14, 2019

Methodology/Use of this StatSheet:

1. From the universe of over 1,800 ETFs, I have selected only those with a trading volume of over $5 million per day (HV ETFs), so that liquidity and a small bid/ask spread are assured.

2. Trend Tracking Indexes (TTIs)

Buy or Sell decisions for Domestic and International ETFs (section 1 and 2), are made based on the respective TTI and its position either above or below its long-term M/A (Moving Average). A crossing of the trend line from below accompanied by some staying power above constitutes a “Buy” signal. Conversely, a clear break below the line constitutes a “Sell” signal. Additionally, I use a 7.5% trailing stop loss on all positions in these categories to control downside risk.

3. All other investment arenas do not have a TTI and should be traded based on  the position of the individual ETF relative to its own respective trend line (%M/A). That’s why those signals are referred to as a “Selective Buy.” In other words, if an ETF crosses its own trendline to the upside, a “Buy” signal is generated. Since these areas tend to be more volatile, I recommend a wider trailing sell stop of 7.5% -10% depending on your risk tolerance.

If you are unfamiliar with some of the terminology, please see Glossary of Terms and new subscriber information in section 9.     

1. DOMESTIC EQUITY ETFs: BUY — since 02/13/2019

Click on chart to enlarge

Our main directional indicator, the Domestic Trend Tracking Index (TTI-green line in the above chart) is now positioned above its long-term trend line (red) by +5.58% after having generated a new Domestic “Buy” signal effective 2/13/19 as posted.

Read More

Trade Pessimism Keeps Markets In Check

Ulli Market Commentary Contact

[Chart courtesy of MarketWatch.com]
  1. Moving the markets

The bouncing below the unchanged lines went on throughout the session with the major indexes having a hard time seeing green, with only the S&P 500 and Dow briefly peeking into positive territory.

The cause for this lack of upward momentum turned out to be usual culprit, namely the latest trade reports casting a big shadow on some of the alleged process. For one, the White House “conceded that the original target date may slip,” but they denied reports of a setback.

Other bon mots included things like “China was absolutely delaying the truce with its approach,” and “there is a lot of jockeying going on—it’s a standoff, in part,” all of which did nothing to calm the markets. However, the positive in all that was that the indexes remained stable and closed within a fraction of their respective unchanged lines.

Even the mid-day tumble was stopped by an influx of dip buyers making this pullback an event now long forgotten and only visible in the rear-view mirror. So, the trade movie continues with all of its idiosyncrasies, as the market-implied odds of a trade deal are worsening from day to day.

On a side note, I had to crack up today when I heard the latest interpretation of using politically correct language, an area that seems to have taken on a life of its own. You’ll be delighted to hear that a new word is spreading in the investment community.

We all, especially the buy-and-hold crowd, certainly remember the crash of 2008, which decimated many portfolios, and I believe the next one will even be more destructive, whenever it arrives. To lessen the pain, some joker suggested we call such an event no longer a “crash” but rather “a sudden value reassessment.”

Well, I don’t know about you, but I would feel far more comfortable losing 50% of my portfolio due to “a sudden value reassessment” than due to a “crash,” wouldn’t you agree?

Read More