Rosy Trade Outlook Powers Markets

Ulli Market Commentary Contact

[Chart courtesy of MarketWatch.com]
  1. Moving the markets

The markets took another jump higher powered by some mega mergers and the good old stand-by, namely the trade talks. All last week’s concerns vanished over the weekend on China’s decision to issue guidelines and raise penalties for intellectual property theft.

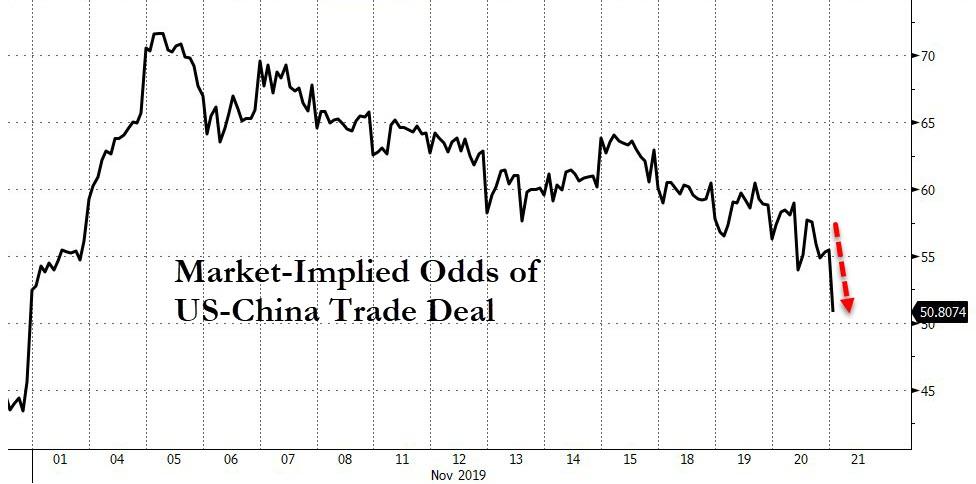
This was immediately interpreted as a step in the right direction boosting the chances of a trade deal between the U.S. and China. Never mind that Reuters reported that a “phase 2” of the deal may not happen any time soon, if ever.

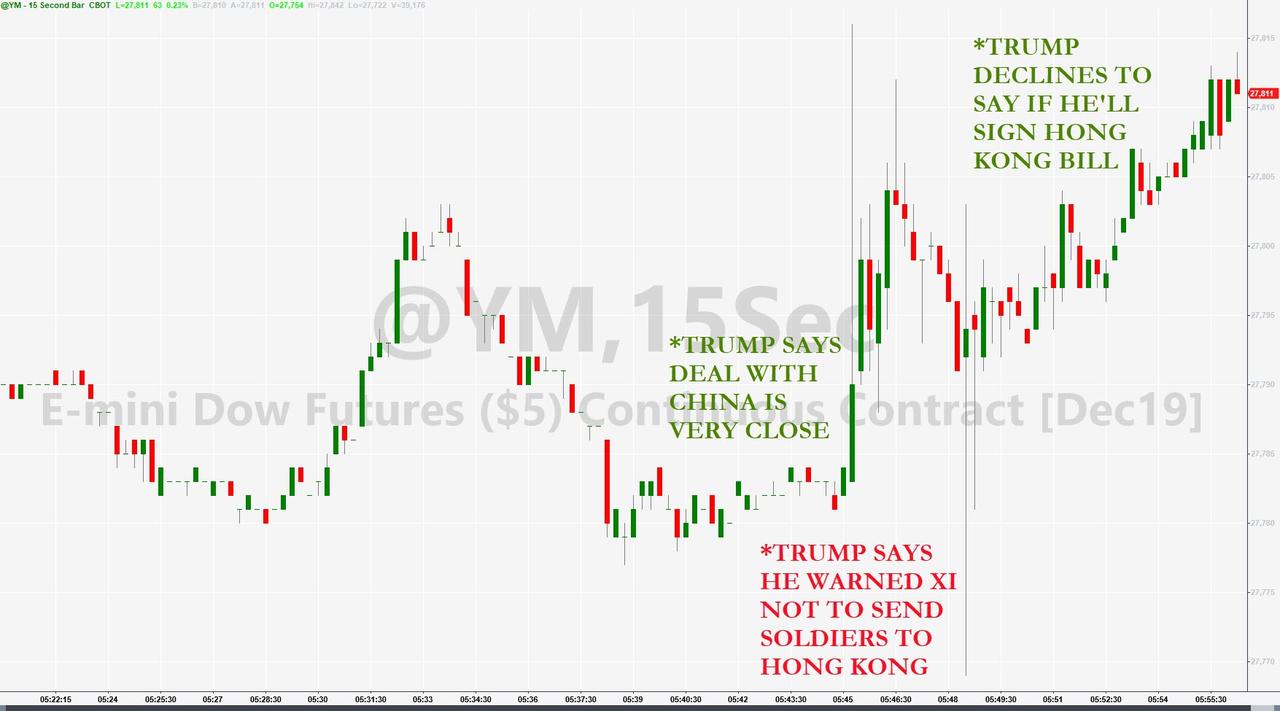
This was offset by a tweet by the Chinese mouthpiece, the Global Times, which said that the warring parties might be “very close” to reaching a “phase 1 deal,” according to the infamous and unknown experts close to the Chinese government.

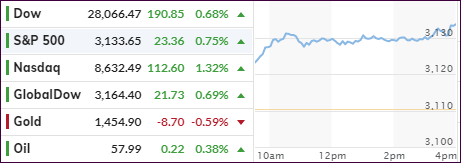
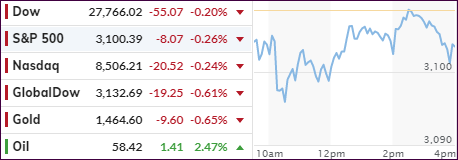
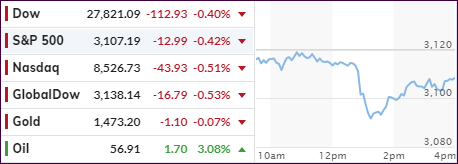
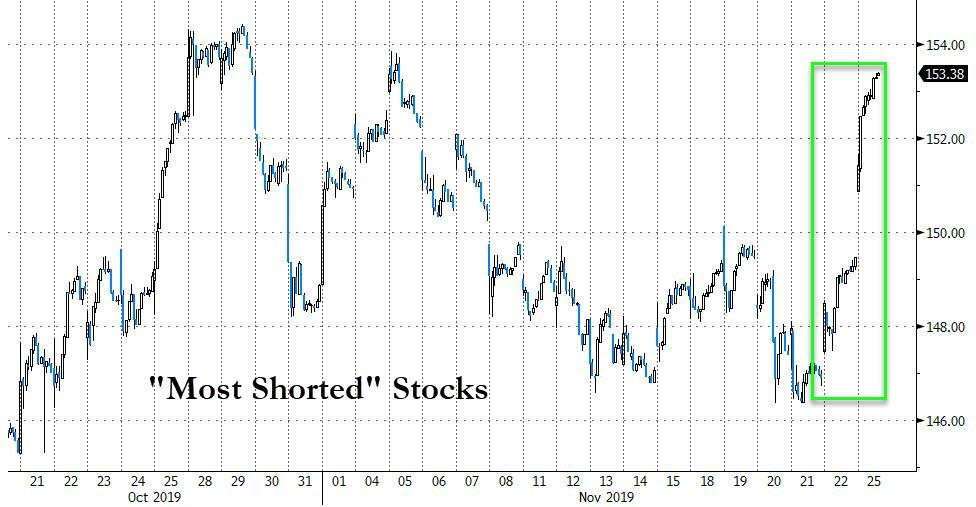
This got the rally started, and the major indexes never looked back with all three of them setting new intraday highs and/or surpassing previous records. As we’ve seen many time before, giving a huge assist was the biggest short squeeze we’ve seen since October which sent SmallCaps sharply higher.

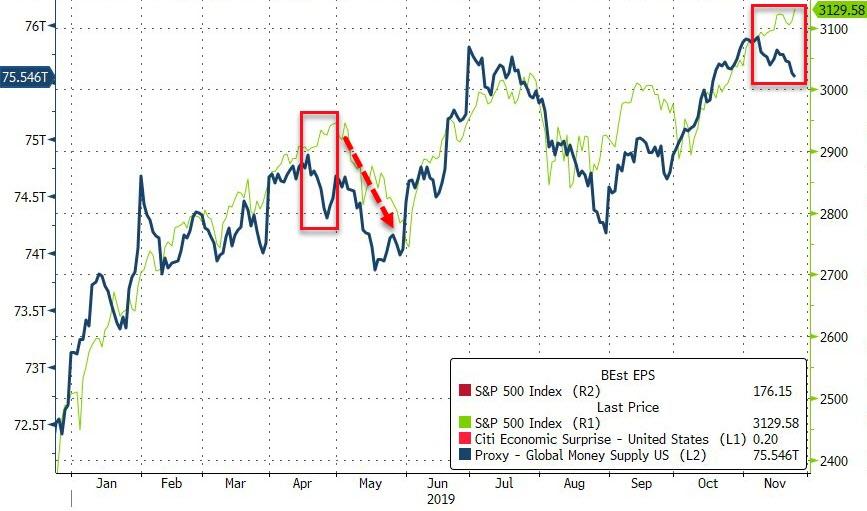
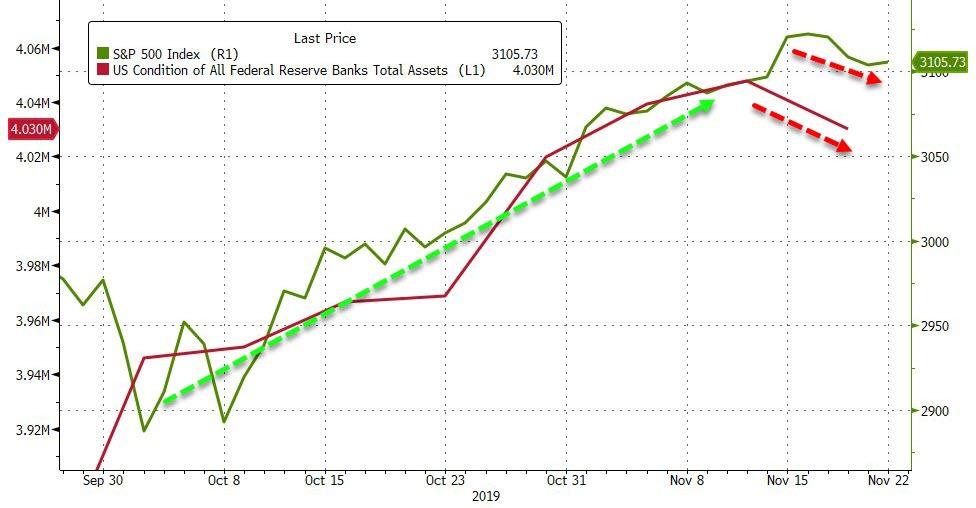
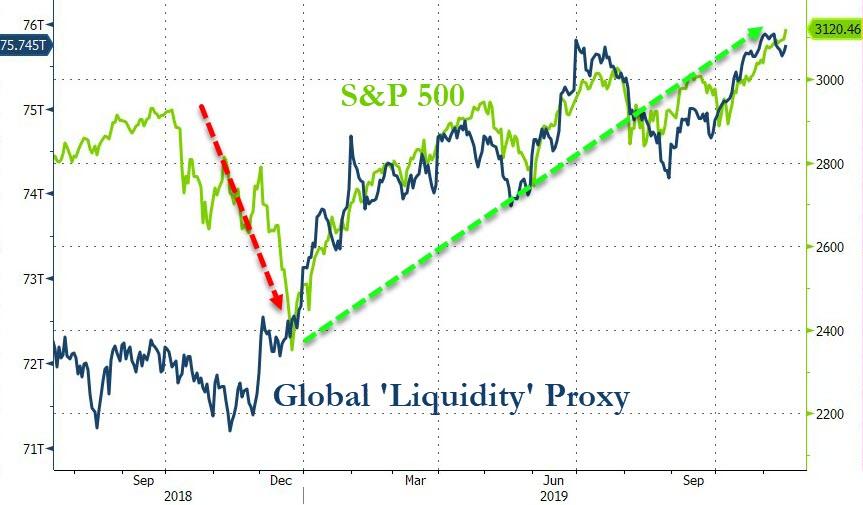
Surprisingly, and may be due to continued issues in the overnight lending market (repos), global liquidity started to reverse, just like it did in April. That brings up the question as to whether equities will follow. After all, as I have posted numerous times, the big driver of stocks is liquidity. If that continues in the direction this chart from Bloomberg indicates, we could see equity weakness ahead.

Read More

ETFs On The Cutline – Updated Through 11/22/2019

Ulli ETFs on the Cutline Contact

Below, please find the latest High-Volume ETF Cutline report, which shows how far above or below their respective long-term trend lines (39-week SMA) my currently tracked ETFs are positioned.

This report covers the HV ETF Master List from Thursday’s StatSheet and includes 322 High Volume ETFs, defined as those with an average daily volume of more than $5 million, of which currently 276 (last week 281) are hovering in bullish territory. The yellow line separates those ETFs that are positioned above their trend line (%M/A) from those that have dropped below it.

Take a look:                                                                   

The HV ETF Master Cutline Report

In case you are not familiar with some of the terminology used in the reports, please read the Glossary of Terms. If you missed the original post about the Cutline approach, you can read it here.      

ETF Tracker Newsletter For November 22, 2019

Ulli ETF Tracker Contact

ETF Tracker StatSheet          

You can view the latest version here.

CLOSING A MEDIOCRE WEEK ON AN UPSWING

[Chart courtesy of MarketWatch.com]
  1. Moving the markets

At least for the S&P 500 and Nasdaq, today’s session was another one of the see-saw variety, while the Dow managed to hover on the plus side the entire day.

An early pop followed by a drop set the early tone with Trump issuing what some traders considered a “buy” signal by merely repeating the good old standby phrase, namely that “a deal with China is close.”

This was followed a threat when he “warned XI not to send soldiers to Hong Kong.” But he made good on any fallout from his remark by pronouncing the he “declines to say if he’ll sign Hon Kong bill.”

ZH charted these market moving effects, which simply demonstrates that the computer algos reacted exactly as expected.

Of course, the ongoing trade soap opera would not be complete without China’s Xi joining the fray and chiming in with things like “Beijing wants to work for a trade deal with the U.S. but is not afraid to ‘fight back,’” and that he holds a “positive attitude” towards the talks, but that a deal requires “mutual respect and equality.”

So, the jawboning goes on without any concrete progress being made. Surprisingly, the markets reacted positive with the indexes scoring a green close for the first time in four trading days. However, the setback for the week was minor -0.32% for the S&P 500—hardly a correction worth mentioning.

However, ZH pointed to this chart showing that the real reason or this week’s “pullback” was simply the unexpected contraction of the Fed’s balance sheet (Source: Bloomberg). Hard to argue with the conclusion.

The markets have been very turbulent over the past 2 years and many readers have emailed me to clarify a variety of questions about the ever-changing investment environment. A good way to enhance your understanding is this U-tube video, during which host Greg Hunter goes one on one with author and analysist John Rubino. It’s 30 minutes well spent.

Read More

Weekly StatSheet For The ETF Tracker Newsletter – Updated Through 11/21/2019

Ulli ETF StatSheet Contact

ETF Data updated through Thursday, November 21, 2019

Methodology/Use of this StatSheet:

1. From the universe of over 1,800 ETFs, I have selected only those with a trading volume of over $5 million per day (HV ETFs), so that liquidity and a small bid/ask spread are assured.

2. Trend Tracking Indexes (TTIs)

Buy or Sell decisions for Domestic and International ETFs (section 1 and 2), are made based on the respective TTI and its position either above or below its long-term M/A (Moving Average). A crossing of the trend line from below accompanied by some staying power above constitutes a “Buy” signal. Conversely, a clear break below the line constitutes a “Sell” signal. Additionally, I use a 7.5% trailing stop loss on all positions in these categories to control downside risk.

3. All other investment arenas do not have a TTI and should be traded based on  the position of the individual ETF relative to its own respective trend line (%M/A). That’s why those signals are referred to as a “Selective Buy.” In other words, if an ETF crosses its own trendline to the upside, a “Buy” signal is generated. Since these areas tend to be more volatile, I recommend a wider trailing sell stop of 7.5% -10% depending on your risk tolerance.

If you are unfamiliar with some of the terminology, please see Glossary of Terms and new subscriber information in section 9.     

1. DOMESTIC EQUITY ETFs: BUY — since 02/13/2019

Click on chart to enlarge

Our main directional indicator, the Domestic Trend Tracking Index (TTI-green line in the above chart) is now positioned above its long-term trend line (red) by +5.26% after having generated a new Domestic “Buy” signal effective 2/13/19 as posted.

Read More

Trade Headline Volleys Soften Markets

Ulli Market Commentary Contact

[Chart courtesy of MarketWatch.com]
  1. Moving the markets

Softness in the markets prevailed for the third day, as a bunch trade news volleys made their way back and forth and kept the major indexes in limbo. An early drop shifted into rebound mode, an occurrence we’ve seen regularly in the recent past, but it fell short of conquering the unchanged lines.

Even though we closed slightly in the red, the continued resilience of the market, to shake off bad news and remain at ridiculously elevated levels, is remarkable. The see-saw moves over the past few days continued with utter abundance, with the market moving headlines being clearly recognizable in this chart.

With a record “trade deal on/trade off” reversals being the new norm, it now included “unnamed sources” saying that “the US would be willing to delay the December 15 tariffs, even if there is no trade deal,” but that the pro-Hong Kong human rights bill passed by Congress could be a major obstacle to any agreements.

Despite equity weakness, bond yields rose, which hurt bond prices and low volatility ETFs the most. The odds of a US-China trade deal plunged, which means, if those don’t reverse, a new driver will be needed to keep stocks on their northerly path.

Read More

Phase One Trade Talks: All Hat And No Cattle

Ulli Market Commentary Contact

[Chart courtesy of MarketWatch.com]
  1. Moving the markets

The markets started the session by meandering slightly below their respective unchanged lines when a sudden dive took the starch out of any existing support. As I posted yesterday, a new headline about how close the latest trade deal might be was sure to be on deck.

Well, we got trade headlines, but they revealed exactly the opposite of what was expected, namely that phase one of this much jawboned about event may not be completed this year. To stoke the fire of discontent even more, China condemned a US Senate resolution supporting human rights in Hong Kong.

Then it was the US’s turn to emphasize that “rolling back tariffs for a deal that fails to address core intellectual property and technology transfer issues will not be seen as good deal for the US.” That was the final nail in the coffin to seal the downward trend of equities.

But the mocking continued, as the editor of China’s Global Times, after his earlier threat that “China wants a deal but is prepared for the worst-case scenario, a prolonged trade war,”  proceeded to taunt the US farmers with “wait for a trade deal before getting bigger tractors.” You just can’t make this up, and it makes me wonder how long this soap opera will go on.

Despite all this negativity, a late day rebound lifted the indexes off their lows but fell short of moving them into the green. Nevertheless, the markets are showing tremendous resilience, especially when you consider that the Dow has been down 2 days in a row for its biggest drop in 6 weeks, and this very drop amounted to less than 1%.

The S&P 500 has not had 1% correction in 28 days and, as ZH points out, it went 36 days in June/July without one. Of course, as I have pointed out on many occasion, the main driver that controls market direction is global liquidity, which this chart (Source: Bloomberg) clearly demonstrates.

Read More