
- Moving the markets
I could not help but laugh out loud last Friday afternoon when one of the greatest gold haters, namely Warren Buffett, disclosed in his Berkshire Hathaway’s latest 13F filing that he liquidated huge amounts of US Bank stocks, and replaced them as follows:
Berkshire took a new stake (20.9 million shares) in Barrick Gold, a holding that was valued at about $564 million at the end of that period.
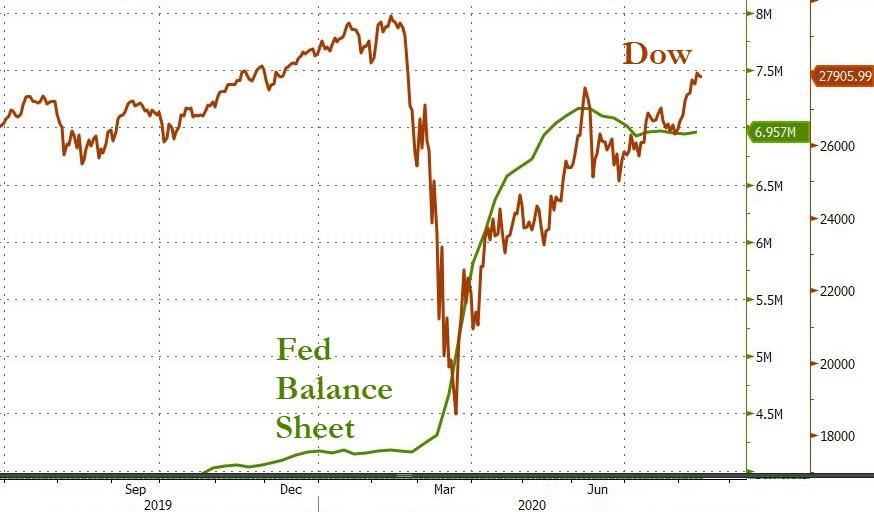
Say what? After mocking those who believe in the soundness of gold for decades, he appeared to have flipped, which to me means that he is clearly seeing what reckless money printing will eventually do to the purchasing power of a currency.
“(Gold) gets dug out of the ground in Africa, or someplace. Then we melt it down, dig another hole, bury it again and pay people to stand around guarding it. It has no utility. Anyone watching from Mars would be scratching their head.”
Warren Buffett in 1998.
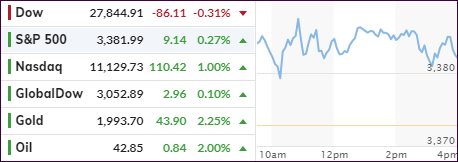
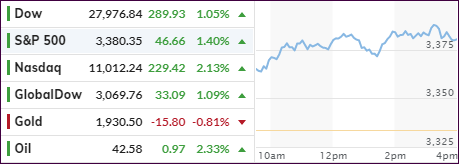
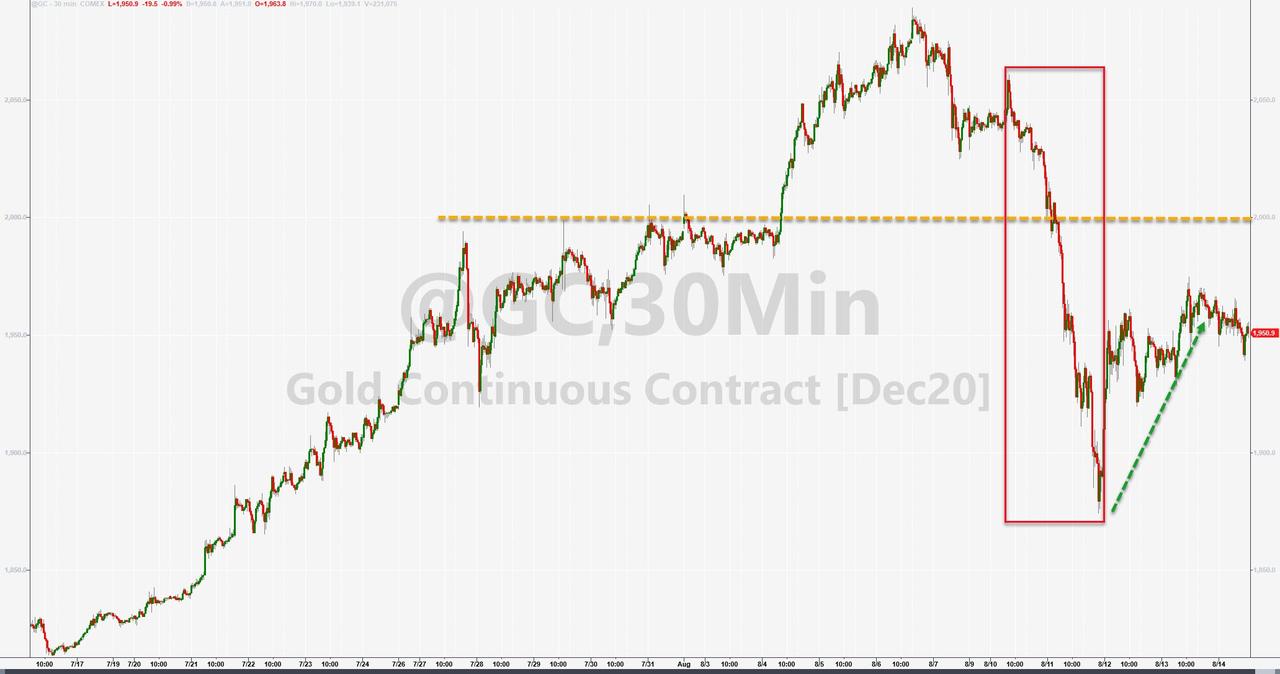
I find it amusing that he is finally seeing the light, and his purchase lit the fire under gold during this session, as the precious metal managed to almost reclaim its recently lost $2,000 level. Still, a gain of +2.19% make this a satisfying day.
The Nasdaq set a new intraday record, came off its high but still closed the session with a solid 1% gain, thereby outperforming the S&P (+0.27%) and the Dow (-0.31%), but lagging when compared to Gold’s superior feat. Gold’s move was helped by a drop in the US dollar, which touched its late July lows.
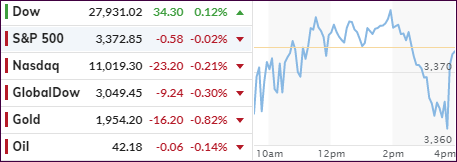
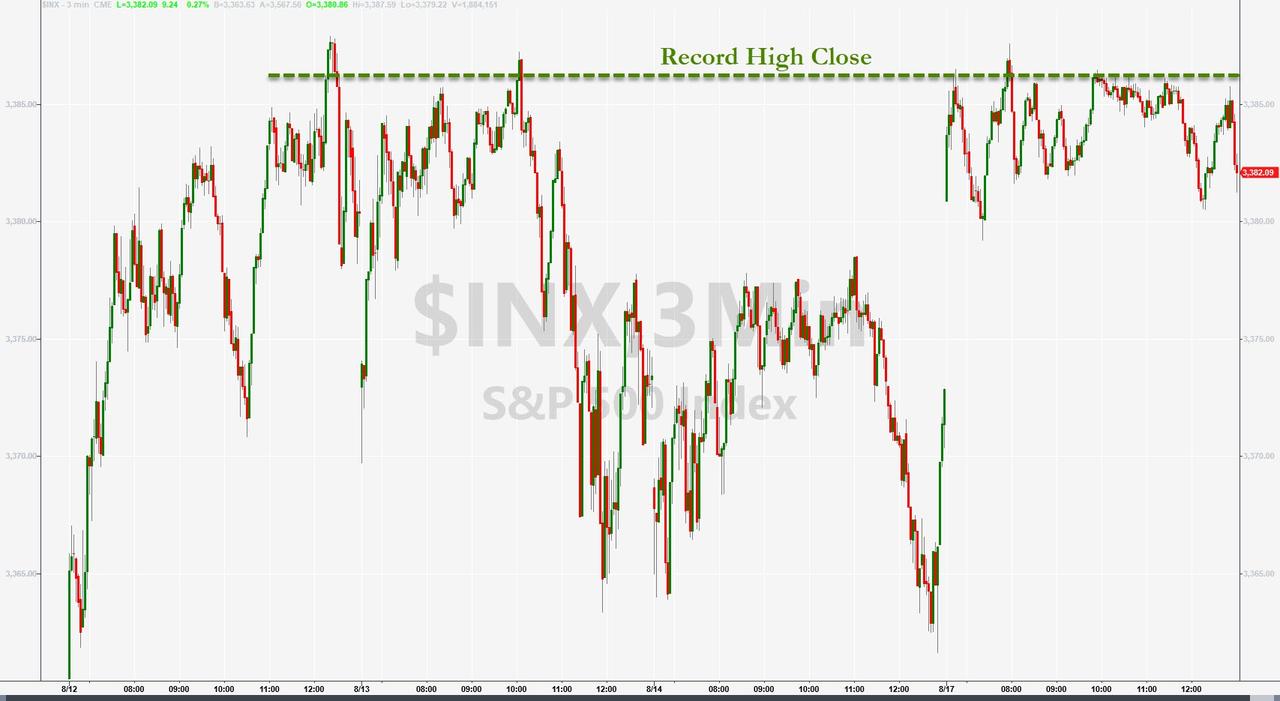
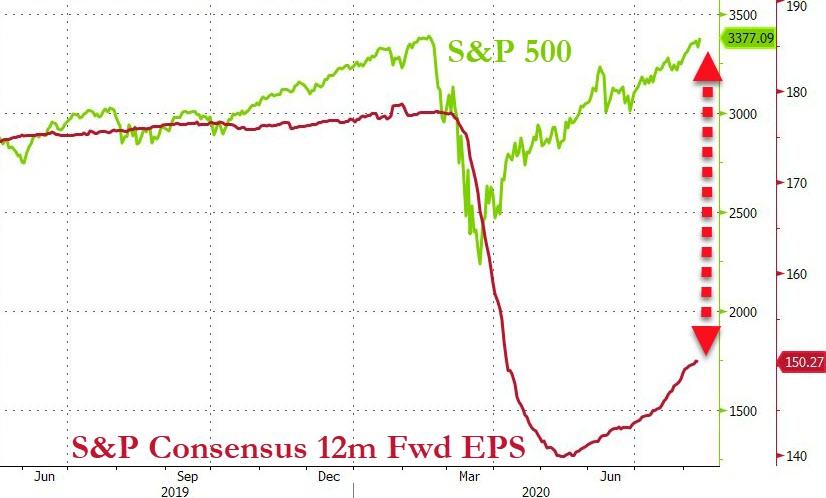
The S&P 500 remains stuck within 1% of its all-time high from February and clearly needs a new driver to propel it past that level, which it has now touched several times.
Quipped ZeroHedge tongue in cheek:
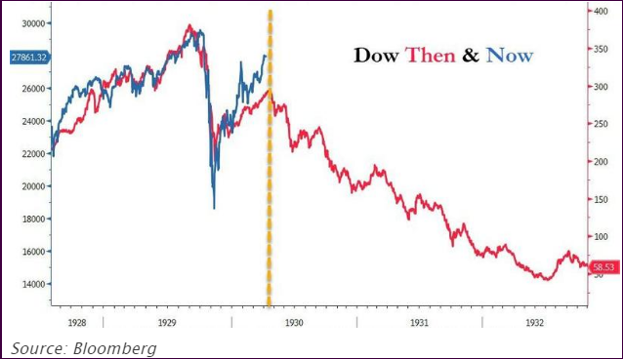
Tick-tock, time’s up for the dead-cat bounce…

