
ETF Tracker StatSheet
You can view the latest version here.
RUNNING OUT OF STEAM
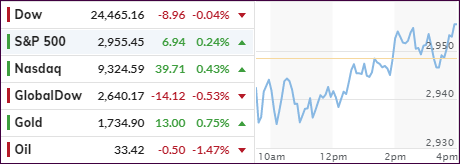
[Chart courtesy of MarketWatch.com]
- Moving the markets
Despite a heroic attempt to pump the market into another green close, the computer algos pushed the major indexes back toward their respective unchanged lines, but not much was gained, as the bullish theme ran out of steam ahead of the upcoming Memorial Day weekend.
However, for the week, the S&P 500 managed to not only gain some 3% but also slip into the positive for the month, after the bears had threatened to reverse the bullish trend on 5/13.
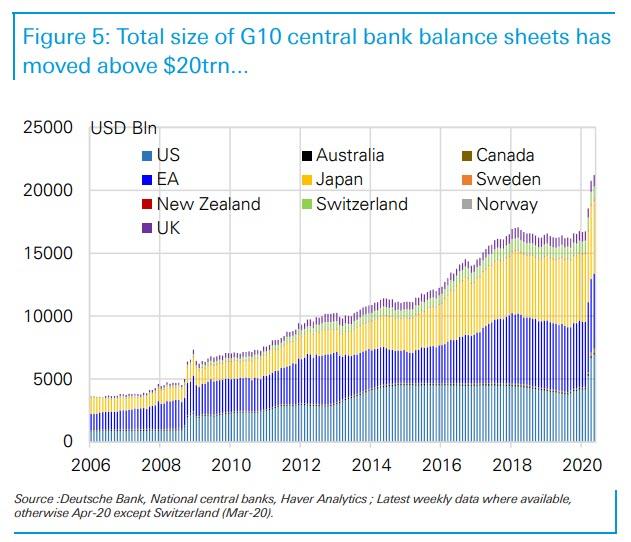
Of course, as I posted on many occasions, the Central Banks (CBs) are behind this enormous rebound off the March lows, and BofAs Michael Harnett in his latest Flow Show report pointed to this fact:
In the past 8 weeks, central banks have been buying $2.4 billion per hour of financial assets.
As Deutsche Bank calculates, the combined G-10 central bank balance sheet is now above $20 trillion, catching up to its trendline since the financial crisis after stagnating around $16 trillion for the past two years…
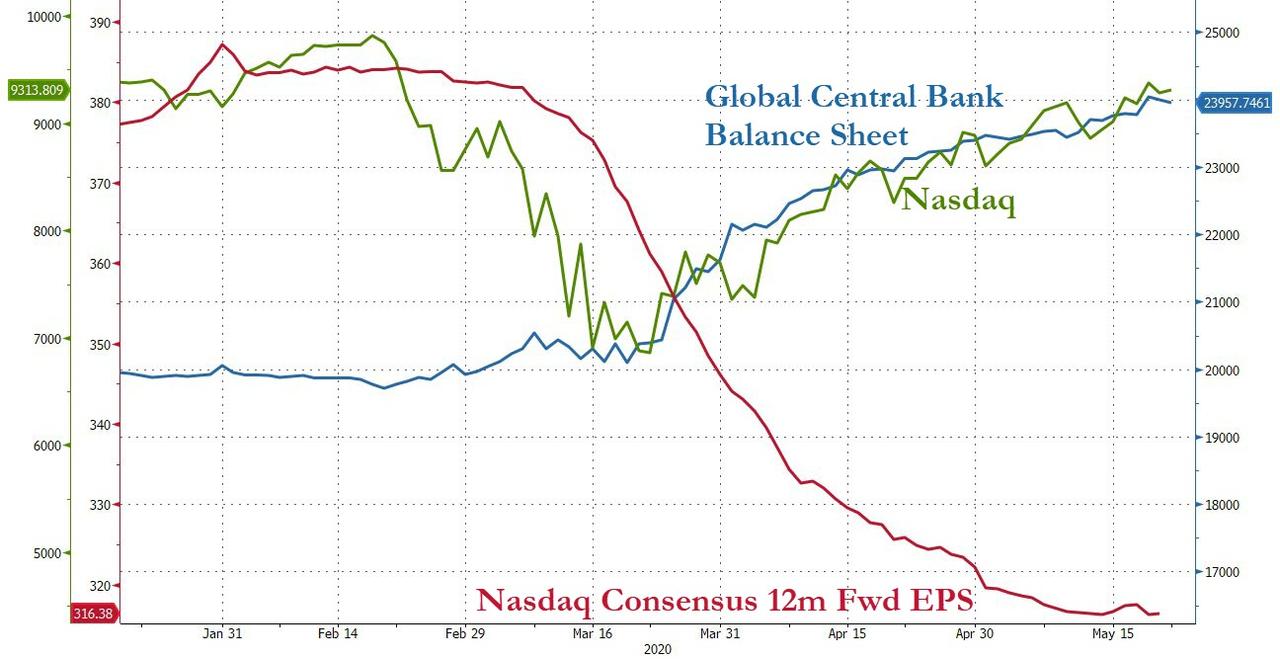
If you had thought that the Fed acted as a lone ranger, accept that this enormous pumping effort of financial assets is a global phenomenon and not just limited to the US.
That means the Fed and the global banks have engaged in never-ending “emergency measures” to support financial assets, ever since the Great Recession came to an end some 10 years ago. Of course, those originally planned to be temporary measures became permanent ones, since none of the initial problems, namely too much debt, were ever addressed and fixed.
This week’s push higher was supported by optimism about the reopening of the economies, along with a slow but steady rebound in activity. Consensus has priced in a “U” or “W” shaped recovery, but should that not happen, watch out below.
Zero Hedge summed up the week like this:
Millions more job losses, thousands more deaths, hundreds more earnings outlooks cut or dismissed, dozens of rancorous threats and promises exchanged between US and China… and still a handful of key US stocks sent the major indices soaring on the week led by Trannies and Small Caps…
With the continued support of the Fed, I expect that we will receive a new Domestic Buy signal soon. However, it is important to realize that you must have an exit strategy established in case the powers to be run out of ammunition, or, the market simply hiccups and revisits the March lows.
2. ETFs in the Spotlight
In case you missed the announcement and description of this section, you can read it here again.
It features some of the 10 broadly diversified domestic and sector ETFs from my HighVolume list as posted every Saturday. Furthermore, they are screened for the lowest MaxDD% number meaning they have been showing better resistance to temporary sell offs than all others over the past year.
The below table simply demonstrates the magnitude with which these ETFs are fluctuating above or below their respective individual trend lines (%+/-M/A). A break below, represented by a negative number, shows weakness, while a break above, represented by a positive percentage, shows strength.
For hundreds of ETF choices, be sure to reference Thursday’s StatSheet.
For this past domestic “Buy” cycle, which ended on 2/27/2020, here’s how some our candidates have fared:
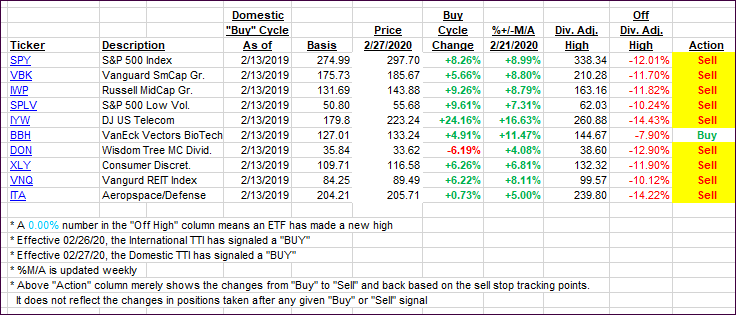
Click image to enlarge
Again, the %+/-M/A column above shows the position of the various ETFs in relation to their respective long-term trend lines, while the trailing sell stops are being tracked in the “Off High” column. The “Action” column will signal a “Sell” once the -8% point has been taken out in the “Off High” column. For more volatile sector ETFs, the trigger point is -10%.
3. Trend Tracking Indexes (TTIs)
Our TTIs slipped a tad, as the major indexes scrambled all day to get back to even.
This is how we closed 05/22/2020:
Domestic TTI: -7.68% below its M/A (prior close -7.44%)—Sell signal effective 02/27/2020
International TTI: -10.70% below its M/A (prior close -9.78%)—Sell signal effective 02/26/2020
Disclosure: I am obliged to inform you that I, as well as my advisory clients, own some of the ETFs listed in the above table. Furthermore, they do not represent a specific investment recommendation for you, they merely show which ETFs from the universe I track are falling within the specified guidelines.
———————————————————-
WOULD YOU LIKE TO HAVE YOUR INVESTMENTS PROFESSIONALLY MANAGED?
Do you have the time to follow our investment plans yourself? If you are a busy professional who would like to have his portfolio managed using our methodology, please contact me directly or get more details here.
———————————————————
Back issues of the ETF Tracker are available on the web.
Contact Ulli