Hope Of A Reopening Economy Powers Markets

Ulli Market Commentary Contact

[Chart courtesy of MarketWatch.com]
  1. Moving the markets

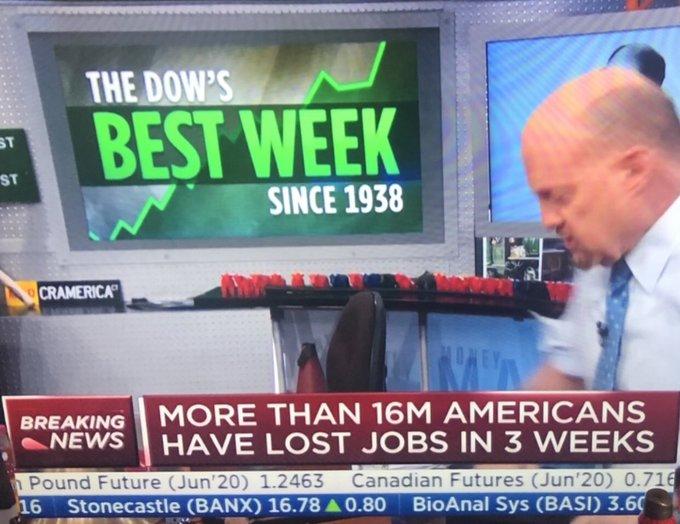
Hope of a reopening of the economy kept the bullish theme alive with the computer algos feasting on the latest news that the worst human toll of the coronavirus may have passed.

ZeroHedge summed it up like this:

In case stocks needed another reason to soar higher with 20% unemployment, 30% mortgage defaults, GDP about to print at -40%, cratering corporate profits, JPMorgan profit crashing 69% with Jamie Dimon warning of a “severe recession”, Boeing delivered moments ago when the company reported that customers cancelled a record number of orders for the 737 Max lead balloon last month, deepening the crisis the company faces between the coronavirus pandemic which has virtually frozen all commercial air flight and the continued grounding of its best-selling plane after two fatal crashes.

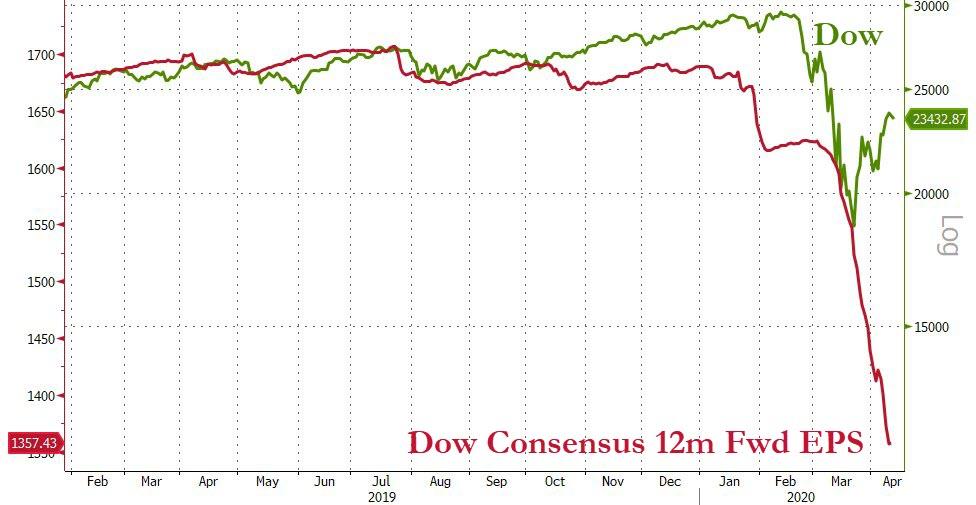
We’re staring the most likely worst ever earnings season in the face, and the markets rally, because fundamentals no longer matter, as I have repeatedly noted. Analyst Bill Blain sees it like this:

Massive monetary stimulus through QE Infinity, and unlimited fiscal support via the promise of sector and company bailouts and nationalizing payrolls, have fueled the market’s expectations rally. NOT BECAUSE OF A STRONGER ECONOMIC OUTLOOK OR RISING COMPANY RESULTS. Distortion and disconnect is not sustainable long-term (although it’s pretty much fueled markets since 2009).

The expectation is Central Banks can’t allow a market meltdown. Follow the Fed… you won’t lose.

Right now, the focus remains on the reopening of the economy with some erroneously expecting this to be like flipping a switch and voila… there is a V-shaped recovery, while the second half of the year already has some sort of normalcy priced in.

I think it will be a slow process, much slower than expected, of getting back to normal. I simply do not believe that people will rush out to restaurants or get involved in large gatherings the moment the shutdown is lifted.

Even Neel Kashkari, the head of the Federal Reserve Bank on Minneapolis, painted a gloomy, or let’s call it more realistic, picture via these comments:

“America should be ready for 18 months of shutdowns in ‘long, hard road’ ahead.”

“This could be a long, hard road that we have ahead of us until we get to either an effective therapy or a vaccine. It’s hard for me to see a V-shaped recovery under that scenario.”

Be that as it may, with the Fed being in full support mode of the markets, we could very well see the return to a bullish cycle, or, we could witness a total breakdown with the a visit of the March lows being a real possibility.

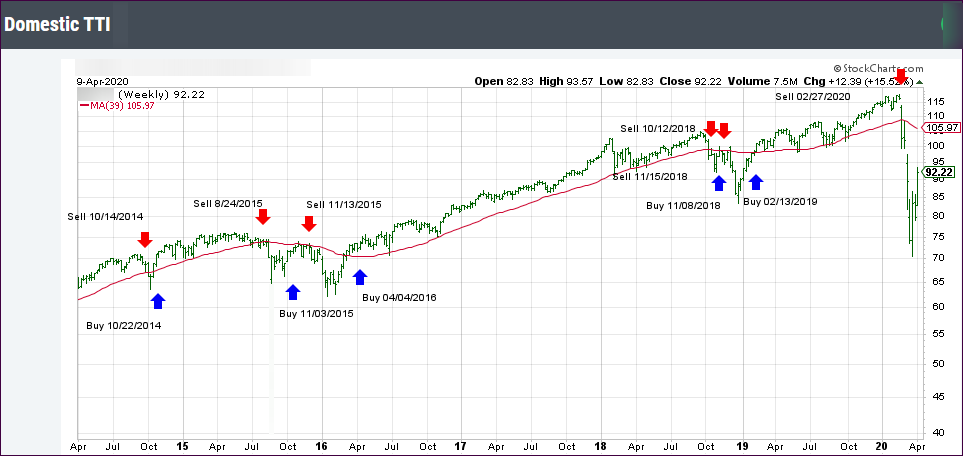
That’s why we must make sure that we don’t succumb to the desire of bottom fishing but be patient and wait, until the odds have improved and our Trend Tracking Indexes (section 3) are signaling the green light again.  

Read More

Slumping Into Earnings Season

Ulli Market Commentary Contact

[Chart courtesy of MarketWatch.com]
  1. Moving the markets

In case you missed it or got confused by last week’s efforts by the Fed to rescue the markets via an alphabet soup of emergency measures, analyst and author Graham Summers put together an easy to understand summary:

On Thursday the Fed announced a $2.3 trillion (with a “T”) monetary program.

In its simplest rendering, the Fed announced it would expand its current Quantitative Easing (QE) programs for municipal bonds, asset backed securities, and investment grade corporate debt. The Fed also announced it would begin buying junk bonds for the first time in history.

Thus, the Fed is now intervening directly in:

1)    The Treasury markets.

2)    The municipal bond markets.

3)    The corporate bond markets (both investment grade and junk).

4)    The commercial paper markets (short-term corporate debt market).

5)    The asset backed security market (everything from student loans to Certificates of Deposit and more).

At this point the only asset classes the Fed isn’t buying outright via a QE program are stocks and commodities. It is, however, worth noting that the Fed is buying bond Exchange Traded Funds or ETFs which trade on the stock market just like regular stocks.

Again, the Fed has effectively nationalized the U.S. debt markets. All in the span of just six weeks.

It is almost impossible to express the insanity of this. Perhaps the easiest way would be to say the Fed just printed the GDP of Brazil in last six weeks and is planning on printing the GDP of France in the next six weeks.

The multitrillion dollar question now is if this will stop the meltdown triggered by the economic shutdown in the U.S.

Of course, it is possible that these monetary efforts will stoke the market fire for a while, but the durations of it is questionable. As trend followers, we are less concerned with the “why’s” of a rally but more so that it penetrates our dividing line between bullish and bearish territory not only to the upside but also by a clear margin.

That would signal a new “Buy” for domestic equity ETFs, however, the duration of which is always an unknown. Right now, we have a way to go before such a signal will materialize, as you can see in section 3 below.

My point simply is that the newly created trillions of dollars could certainly drive equities against all fundamental valuations to a point of creating a new bullish theme for us. The recent stimulus has helped the markets bounce off their recent lows by an amazing 25%, despite some of the worst economic settings. This TV screenshot makes this abundantly clear.

Tumbling into another week best describes today’s action with the question in my mind being this one: Can the Fed and its continued stimulus efforts offset what is sure to be a miserable upcoming earnings season?

Read More

ETFs On The Cutline – Updated Through 04/09/2020

Ulli ETFs on the Cutline Contact

Below, please find the latest High-Volume ETF Cutline report, which shows how far above or below their respective long-term trend lines (39-week SMA) my currently tracked ETFs are positioned.

This report covers the HV ETF Master List from Thursday’s StatSheet and includes 322 High Volume ETFs, defined as those with an average daily volume of more than $5 million, of which currently 42 (last week 32) are hovering in bullish territory. The yellow line separates those ETFs that are positioned above their trend line (%M/A) from those that have dropped below it.

Take a look:                                                                   

The HV ETF Master Cutline Report

In case you are not familiar with some of the terminology used in the reports, please read the Glossary of Terms. If you missed the original post about the Cutline approach, you can read it here.      

ETF Tracker Newsletter For April 10, 2020

Ulli ETF Tracker Contact

ETF Tracker StatSheet          

You can view the latest version here.

Jobless Claims Surge To 17 Million—Markets Rally

[Chart courtesy of MarketWatch.com]
  1. Moving the markets

The shocking yet not surprising number of the day was the fact that now almost 17 million people have filed initial jobless claims—in the past 3 weeks, which implies an unemployment rate of around 13% or so, surpassing the 10% reached during the last recession.

As far as the markets are concerned, this bad news was more than offset by the allegedly good news when Fed head Powell told the world, “There’s Really No Limit On What the Fed Can Do.”

ZeroHedge summed it up like this:

The Federal Reserve announced its latest series of sweeping, unprecedented action to backstop the credit pillars supporting the entire economy and provide as much as $2.3 trillion in additional loans during the coronavirus pandemic, including starting programs to aid small and mid-sized businesses as well as state and local governments: “The funding will assist households and employers of all sizes and bolster the ability of state and local governments to deliver critical services during the coronavirus pandemic.”

Subsequently, it came as no surprise that, as some analysts had expected, the Fed would start buying junk bonds including junk ETFs like JNK which, as a result, exploded some 7% higher.

Now there is only one thing left for the Fed to buy, and that is stocks and everything else that needs propping up. Once that happens, free markets will have died, and we will follow the path of Japan, where the high from 30 years ago was never taken out, as this Nikkei chart shows.

Not to be outdone, the UK has taken this scheme one step further, as the BOE (Bank of England) became the first Central Bank to openly fund the deficit by announcing that “it will begin to finance the short-term needs of the Treasury.” In other words, it will directly monetize the UK deficit, something central banks had—for the past decade—denied they do or would do.

At this time, I still question that this current massive rebound represents the end of the bear market, since there have been 38 other historical occasions where markets rallied just as much or more. However, on average, the final bear market low came 137 days after registering such a loss. If that would repeat, August 7 would be the projected low. Hat tip goes to Mark Hulbert for this data.

Nevertheless, this week was a good one for those trying to recover losses with the S&P 500 being pumped up an amazing 10%—in four trading days. That is an event which happens only in bear markets.

Again, economic realities have severely diverged from market levels. On March 31st, I posted this chart by Bloomberg showing where the S&P 500’s level should be at, given the 12 month consensus on forward earnings (EPS), which was shown to be in the 1,600 area.

Now this chart has been updated, and the fair market value of the S&P has dropped to around 1,000, yet it is currently at 2,790. That’s one of those things that makes me go “Hmmm.”   

Read More

Weekly StatSheet For The ETF Tracker Newsletter – Updated Through 04/09/2020

Ulli ETF StatSheet Contact

ETF Data updated through Thursday, April 9, 2020

Methodology/Use of this StatSheet:

1. From the universe of over 1,800 ETFs, I have selected only those with a trading volume of over $5 million per day (HV ETFs), so that liquidity and a small bid/ask spread are assured.

2. Trend Tracking Indexes (TTIs)

Buy or Sell decisions for Domestic and International ETFs (section 1 and 2), are made based on the respective TTI and its position either above or below its long-term M/A (Moving Average). A crossing of the trend line from below accompanied by some staying power above constitutes a “Buy” signal. Conversely, a clear break below the line constitutes a “Sell” signal. Additionally, I use a 7.5% trailing stop loss on all positions in these categories to control downside risk.

3. All other investment arenas do not have a TTI and should be traded based on  the position of the individual ETF relative to its own respective trend line (%M/A). That’s why those signals are referred to as a “Selective Buy.” In other words, if an ETF crosses its own trendline to the upside, a “Buy” signal is generated. Since these areas tend to be more volatile, I recommend a wider trailing sell stop of 7.5% -10% depending on your risk tolerance.

If you are unfamiliar with some of the terminology, please see Glossary of Terms and new subscriber information in section 9.     

1. DOMESTIC EQUITY ETFs: SELL — since 02/27/2020

Click on chart to enlarge

Our main directional indicator, the Domestic Trend Tracking Index (TTI-green line in the above chart) is now positioned below its long-term trend line (red) by -13.30% after having generated a new Domestic “Sell” signal effective 2/27/20 as posted.

Read More

Markets Salivating On Hopes Of U.S. Removing Containment Measures

Ulli Market Commentary Contact

[Chart courtesy of MarketWatch.com]
  1. Moving the markets

Here’s an analysis of the market idiocy we saw over the past couple of trading days. A tip of the hat goes to ZeroHedge for this explanation:

In a mirror image of yesterday’s last 10 minutes action, when the S&P dumped by 40 points in seconds, when a $2.4BN “market on close” (MOC) sale imbalance was announced at 3:50 pm ET…moments ago, at exactly 3:50 pm again when the market on close imbalance was unveiled, and revealed that there was $2 billion left to buy, the Emini future (i.e., the S&P 500) spiked higher by 20 points, from 2,732 to 2,752, which was also the session high as algos scrambled to front run the residual buy orders in the last minutes of trading.

And then the conclusion:

As a reminder, this is at least the 4th time in the past two weeks – it started on March 26 – that the MOC imbalance announcement has led to a stunning move in the market, a striking phenomenon which is attributable to one simple thing: there is absolutely no liquidity in the market, and as a result the headline MOC announcement is sufficient to send the entire market surging or tumbling…

Despite yesterday having been the deadliest virus day in the world, optimistic comments by Dr. Fauci about a turning point with lower total deaths than expected, was enough to shift the headline scanning computer algos into overdrive. The day was saved with the Dow adding almost 800 points with the usual assist of another epic short-squeeze for the third day in a row.

Again, the rally of the past two days occurred despite neither economic nor earnings data having divulged the viciousness of the economic crisis that not only the U.S. but also the world has plunged into.

Analyst Bill Blain offered these succinct and true words:

“The greatest idiot is a man who thinks strong stock markets are an indication of economic health.”

As I mentioned before, this kind of volatility is typical in bear markets, and we may see more of that tomorrow, when the jobless claims numbers are sure to extract their pound of flesh from the markets.

Read More