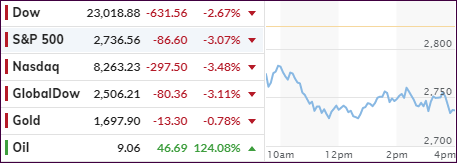
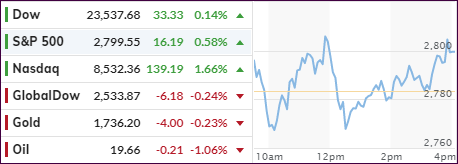
After yesterday’s historic crash in oil prices, which pulled down equities as well, the pain did not stop today, as the major indexes got clobbered again with the S&P 500 surrendering over 3%.
Apparently, even the headline scanning computer algos
were confused as oil prices recovered some, but remain crushed,
while earnings reports and additional congressional aid for businesses were not
offering any clear path to a recovery.
At the same time, worries about further fallout from the
energy sector via defaults and layoffs has created an environment undermining
risk sentiment, the true extent of which will be unknown for a while. As a result,
the more volatile tech sector fared the worst with the Nasdaq sinking almost
-3.5%.
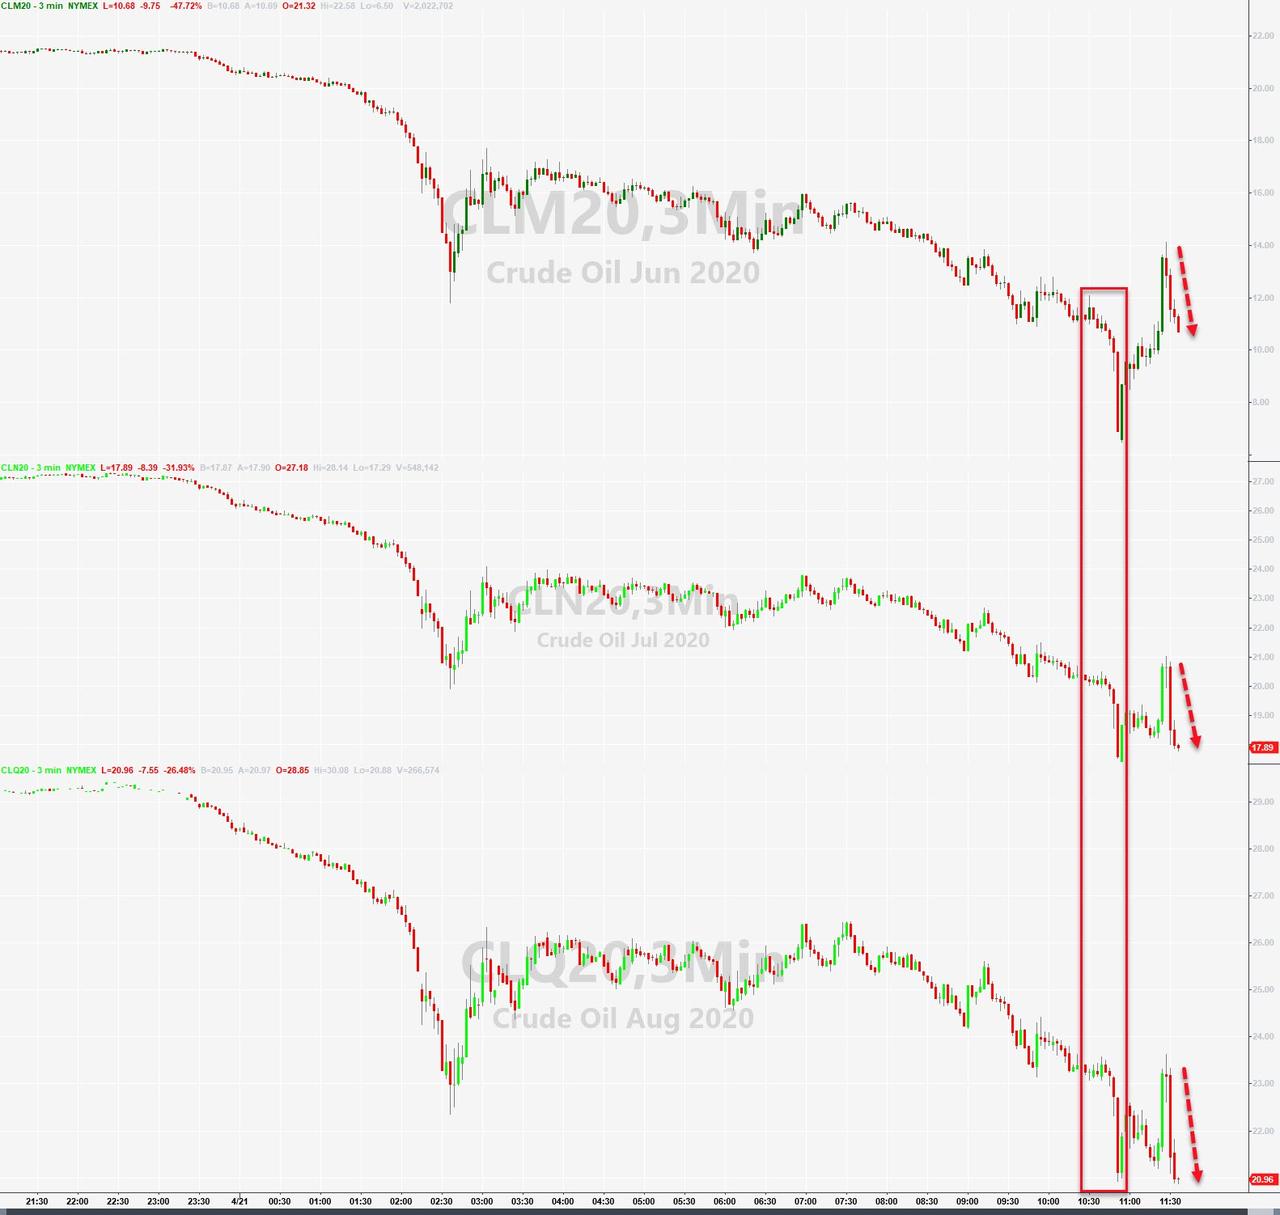
Back to the oil saga. With May’s contract expired, the focus
was on June, which also got hammered and marked its lowest finish in 21 years
by settling at $11.57/barrel. Again, the issue is one of demand destruction and
oversupply, which means in about 6 weeks all storage facilities will have been filled
up, unless the economy starts roaring back—and does so quickly.
While this is possible, it is not very likely due to the State
restrictions and various phase-in procedures to reopen the country, so I think
we will see many more tumultuous events from the energy sector. That may even accelerate,
once it becomes clear which entities have collapsed and are no longer viable
businesses.
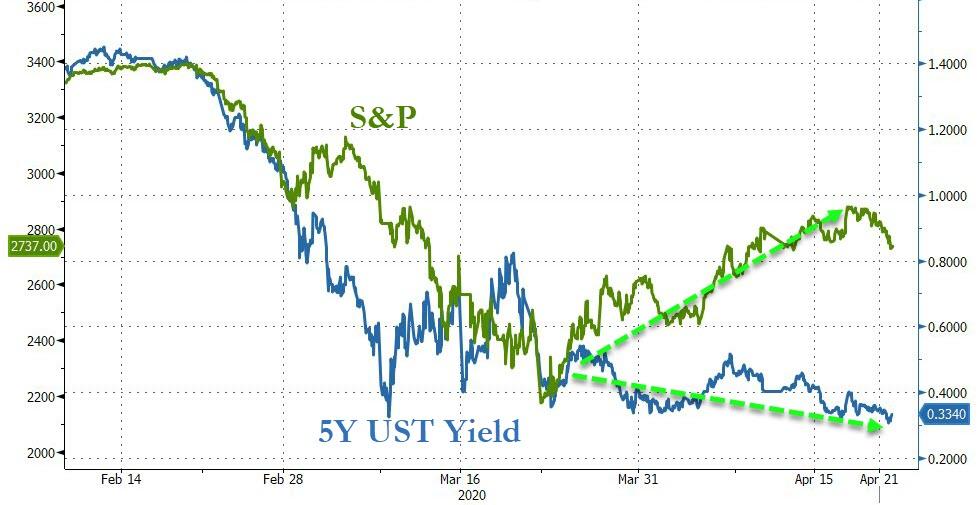
In bond land, the 5-year hit a new record low intraday,
according to ZeroHedge, which highlights the decoupling between the bond market
and the stock market’s rebound, as Bloomberg shows in this
chart. If, as is usually the case, bonds are correct that would mean that the
S&P 500 would have to retract to a level around the 2,100, which would represent
a drop of some -23%.
Should that materialize, we will have taken out the March
lows (2,191), and a clear resumption of the bear market would be a foregone conclusion.
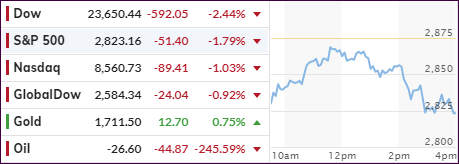
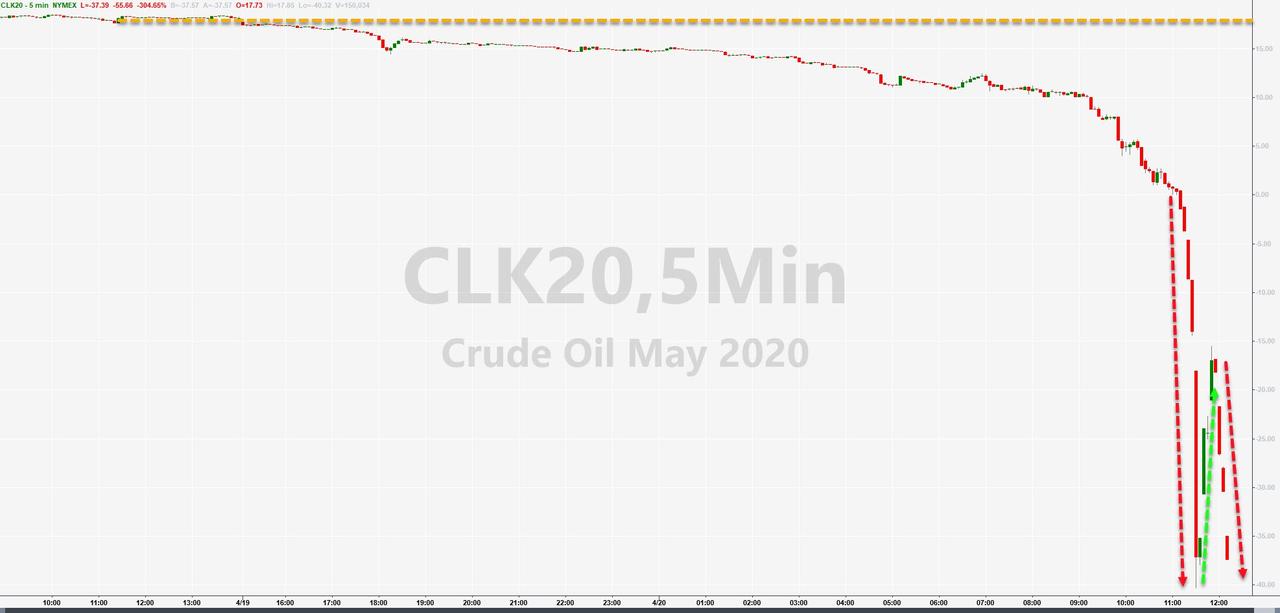
I had to look at the chart several times before realizing
that May crude oil had crashed
over 300%, as of this writing, into negative territory, and a barrel of WTI settled
at a price of MINUS $37. In other words, a seller was willing to pay a buyer
that very $37—just to take a barrel of oil off their hands!
That would be the equivalent of you buying $200 worth of
groceries and at checkout, they are paying you $37 to take the groceries with you.
Huh? These are some of the idiotic financial distortions we are seeing, and I
am sure there is much more to come.
Of course, the reason for the oil crash is the spreading demand
destruction due to the coronavirus, as the country has shut down, while land
and ocean storage facilities are filled up close to their capacities.
There will be deep financial repercussions way beyond the
energy sector, as banks involved in loans and derivatives are being threatened,
the magnitude of which is not known at this time. However, I see it as a warning
sign as to how substantial the economic fallout will be, while current stock prices
are in no way reflecting these uncertainties.
The major equity indexes had opened to the downside, but
were in the process of crawling back, when the oil debacle accelerated and put
an end to the mid-day rally by pushing them to new lows for the session.
Continued hope and optimism about the potential easing of
the global lockdowns took a backseat to the oil crisis, but traders were on
edge anyway with second wave virus infections having made a comeback.
Right now, the question in my mind is “will equities be
able to resist these unprecedented events and march higher, or will we see a reversal
with a re-visit of the March lows on deck?”
Below, please find the latest High-Volume ETF Cutline
report, which shows how far above or below their respective long-term trend
lines (39-week SMA) my currently tracked ETFs are positioned.
This report covers the HV ETF Master List from Thursday’s
StatSheet and includes 322 High Volume ETFs, defined as those with an average
daily volume of more than $5 million, of which currently 66 (last week 42) are
hovering in bullish territory. The yellow line separates those ETFs that are
positioned above their trend line (%M/A) from those that have dropped below it.
In case you are not familiar
with some of the terminology used in the reports, please read the Glossary of Terms.
If you missed the original
post about the Cutline approach, you can read it here.
The
creation of rumors is one of the oldest tricks in the financial playbook to
send markets in a desired direction.
Such
was the case last night in the futures markets, when original reports that the Gilead
Company’s trial of Remdisivir in Covid-19 patients was pointing to rapid recoveries
in fever and respiratory symptoms. That sent the markets soaring and then correcting
on overhyped news that the trial has not even yet concluded.
However,
the positive theme remained through this morning’s opening with the major indexes
closing solidly in the green more so over the potential of the U.S. reopening “soon.”
The White House announced the first guidelines, and it will now be up to the
states to determine, if, when and to which degree the recommendations will be
applied.
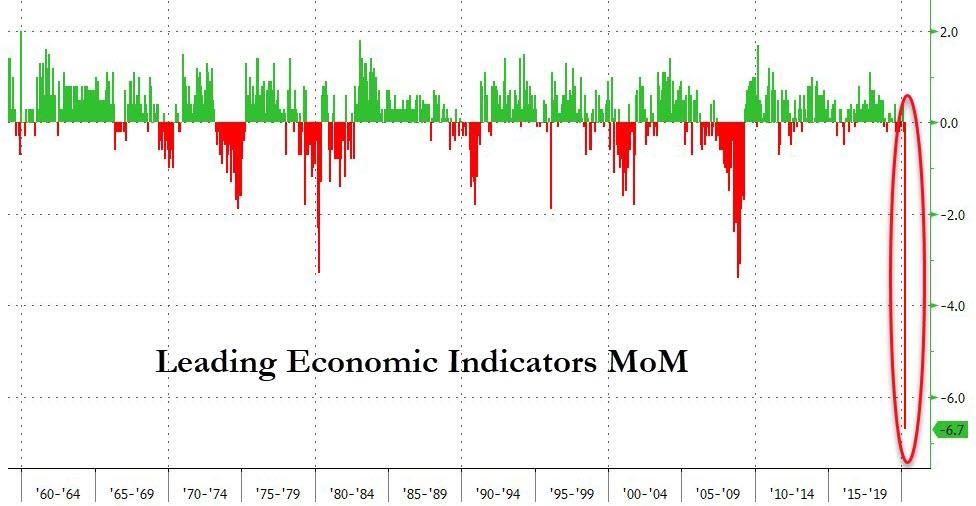
What
that means is that today’s rally was again fueled by nothing more than hope and
optimism, while totally disregarding economic realities, which I presented all
week, such as the latest data showing that the U.S. Leading Economic Indicators
crashed
by the most in 60 years.
All
this is market hype is based on the idea that we’d be quickly returning to
normal, once the shut-down is lifted, and the erroneous theory that assumes that
we can “turn the key and the economy will restart,” as fund manager/economist
Peter Schiff commented.
Peter
had a few other spot-on remarks, which represents the cruel reality:
Just
because Donald Trump snaps his fingers and says, “Go!” doesn’t mean that the
crisis ends. The damage done to the economy is deep. In fact, the economy was
already suffering from multiple wounds long before COVID-19 reared its ugly
head.
There
is no doubt that this downturn will be historic in depth. But the nature of the
event behind it is the core hurdle to an economic restart: A health crisis that
has killed more than 28,000 people in the country, according to a Reuters
tally, and has left fear and confusion in its wake. Behavioral economists note
that even much smaller shocks to how people perceive the world can cause
lasting effects in how they behave.
It
assumes everything was “normal” to begin with. It wasn’t normal. The economy
was a big, fat, ugly debt bubble. Normal was abnormal. The economy was levered
up to the hilt. Consumers were driving the economy with borrowed money.
Corporations were already carrying record debt-loads. The government was
already spending money as if we were in the depts of an economic recession.
Coronavirus
popped the bubble. It pulled the last piece out of the Jenga game. It turned a
fan on the house of cards. We’re not going back to normal any time soon.
We
have a debt bubble. Now, everybody is defaulting on their loans. It doesn’t
matter why they’re defaulting. All that matters is that they defaulted. And the
cat’s out of the bag now. It’s gone. It’s over. The bubble has popped and now
we are dealing with the consequences, not just of the virus, but of the
consequences of the bubble.
In
fact, we’re dealing with the consequences of the bubble that popped in 2008.
We’re dealing with the consequences of the bubble that popped in 2001. Because
we never finished dealing with them. Because the Fed kicked the can down the road,
and we’ve caught up with that can.
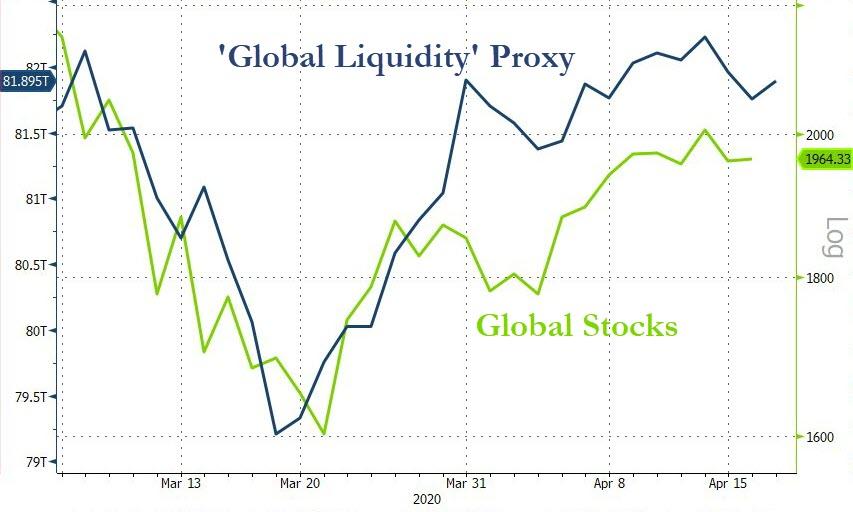
As
far as current market levels are concerned, Guggenheim’s Scott Minerd added
what I have been saying for quite a while:
“The
market at this level based upon where earnings are doesn’t represent any kind
of intrinsic value, it is being entirely propped up by liquidity.”
“S&P
could be 1,500, 1,600, 1,200.”
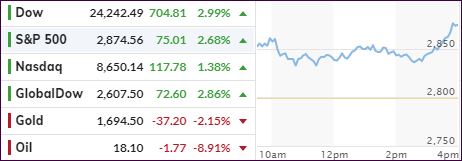
Closing
out the week, this is what we witnessed:
Crude
oil crashed, a record surge in Covid-19 deaths and unemployment, while the markets
exploded higher with the S&P 500 adding some 3%, although on severely lagging
volume.
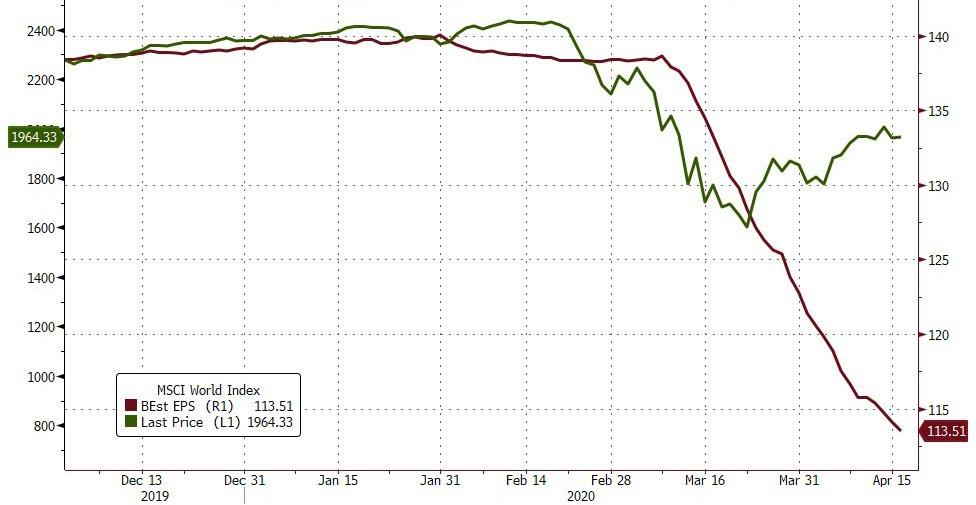
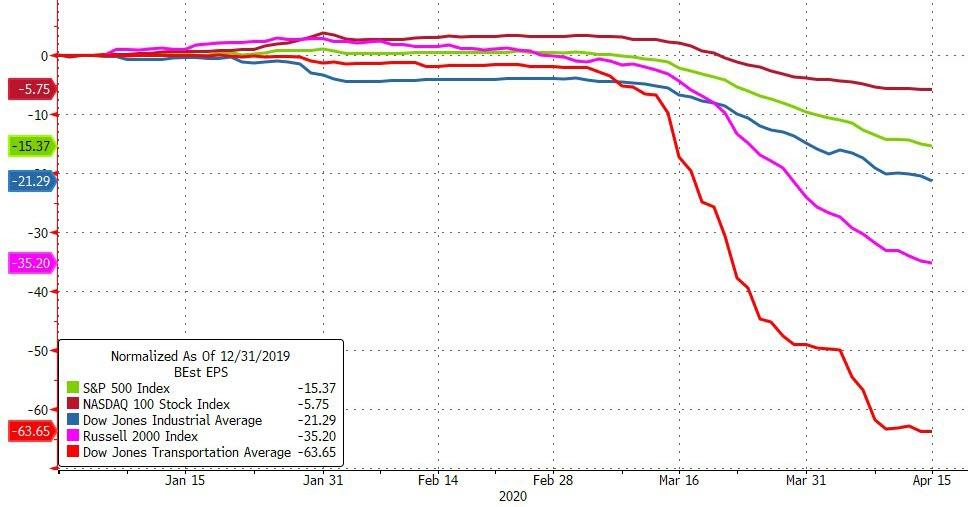
While
this is current reality, it will not end well. Even on a global basis, earnings
expectations are collapsing,
while stocks are soaring—but only for this
reason.
1. From the universe of over 1,800 ETFs, I have selected only those with a
trading volume of over $5 million per day (HV ETFs), so that liquidity and a
small bid/ask spread are assured.
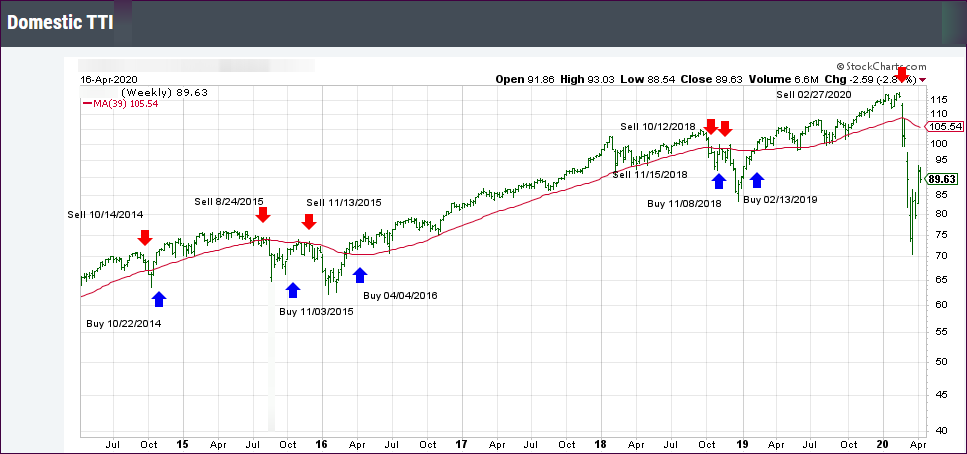
2. Trend Tracking Indexes (TTIs)
Buy or Sell decisions for Domestic and International ETFs (section 1 and
2), are made based on the respective TTI and its position either above or below
its long-term M/A (Moving Average). A crossing of the trend line from below
accompanied by some staying power above constitutes a “Buy” signal. Conversely,
a clear break below the line constitutes a “Sell” signal. Additionally, I use a
7.5% trailing stop loss on all positions in these categories to control
downside risk.
3. All other investment arenas do not have a TTI and should be traded
based on the position of the individual
ETF relative to its own respective trend line (%M/A). That’s why those signals
are referred to as a “Selective Buy.” In other words, if an ETF crosses its own
trendline to the upside, a “Buy” signal is generated. Since these areas tend to
be more volatile, I recommend a wider trailing sell stop of 7.5% -10% depending
on your risk tolerance.
If you are unfamiliar with some of the terminology, please see Glossary of Termsand new subscriber information in section 9.
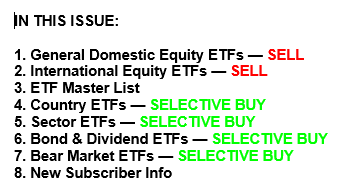
1. DOMESTIC EQUITY ETFs: SELL
— since 02/27/2020
Click on chart to enlarge
Our main directional indicator, the Domestic Trend Tracking Index (TTI-green line in the above chart) is now positioned below its long-term trend line (red) by -15.42% after having generated a new Domestic “Sell” signal effective 2/27/20 as posted.
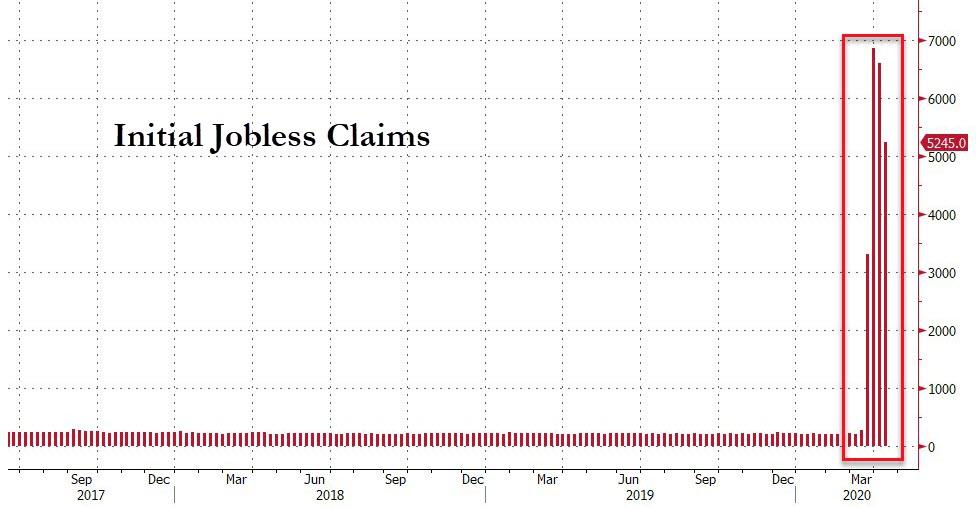
The major indexes went on another roller coaster ride but
managed to eke out a green close. Today’s jobless numbers were almost as bad as
last week’s with 5.245 million new
filings for unemployment benefits, but at least this was in line with
expectations.
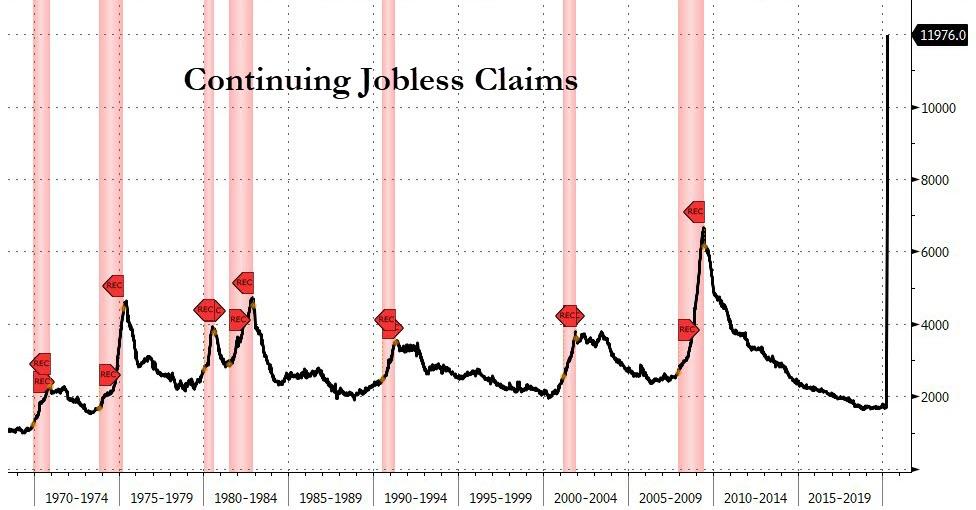
However, when looking at the big picture, this means that,
as ZeroHedge explains, the four-week total is now up to 22.025 million, which is
over 10 times the prior worst four-week period in the last 50-plus years.
Subsequently, the last week’s “initial” and this week’s “continuing” claims are
at the highest level as per Bloomberg’s
chart.
We will have to wait and see what this will do to the unemployment
rate, but early forecasts point to a range of 17-20%.
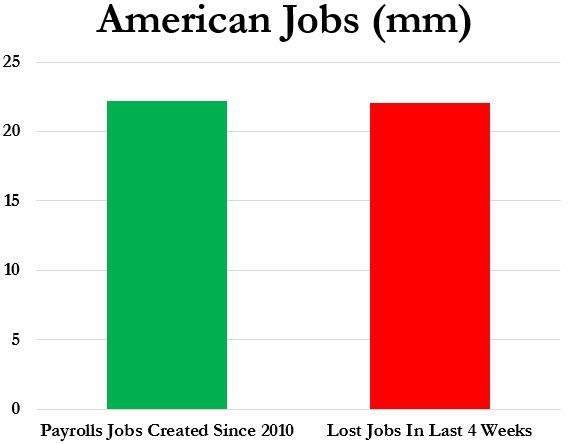
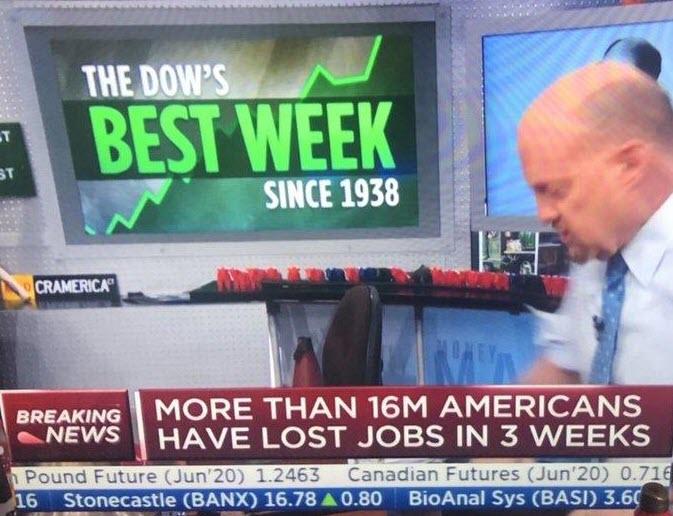
What’s most concerting, however, is that in
the last
four weeks, more Americans have filed for unemployment than jobs gained during
the last decade since the end of the Great Recession (22.13 million gained in a
decade, 22.025 million lost in 4 weeks.)
While the markets tumbled early on, hope prevailed that
U.S. and European leaders will begin reopening their economies, although I think
that will be slow process. Initially markets may jump at that fact, once it happens,
but possibly head south again, as reality sets in that a V-shape type of recovery
will not be in the cards and the actual upturn will be anything but speedy.
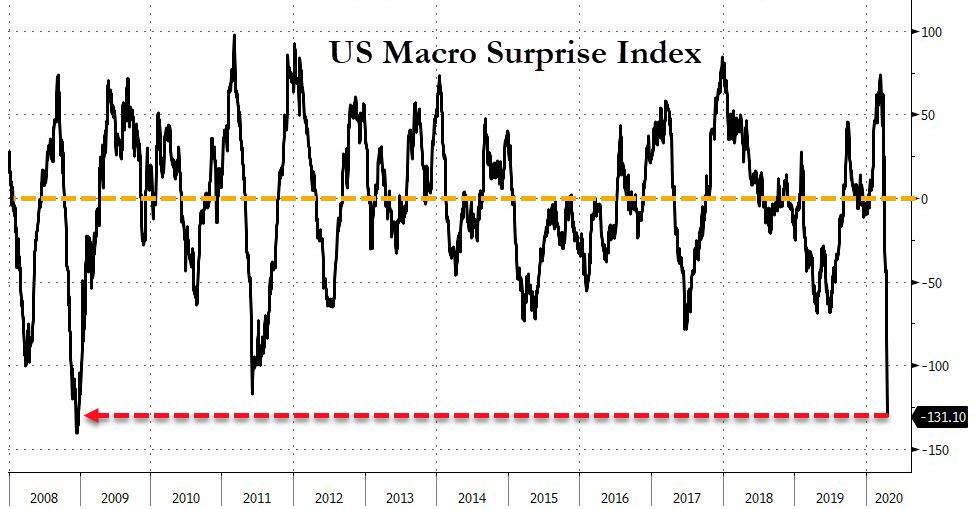
As Bloomberg points out, Macro Economic data took a steep
dive and earnings expectations are collapsing,
a serious issue, which so far has been conveniently overlooked by computer
algos and traders alike. These things don’t seem to matter, until one day they
do.
To confirm that fundamentals no longer matter, ZeroHedge
noted:
Over the last four
weeks, on days the initial jobless claims data has been released and
Americans have lost over 22 million jobs, the S&P 500 has actually rallied
(+6.2%, +2.3%, +1.4%, and +0.6%), and Nasdaq 100 (+5.72%, +1.99%, +0.11%, and
+2.0%).
