Below, please find the latest High-Volume ETF Cutline report, which shows how far above or below their respective long-term trend lines (39-week SMA) my currently tracked ETFs are positioned.
This report covers the HV ETF Master List from Thursday’s StatSheet and includes 312 High Volume ETFs, defined as those with an average daily volume of more than $5 million, of which currently 97 (last week 131) are hovering in bullish territory. The yellow line separates those ETFs that are positioned above their trend line (%M/A) from those that have dropped below it.
In case you are not familiar with some of the terminology used in the reports, please read the Glossary of Terms. If you missed the original post about the Cutline approach, you can read it here.
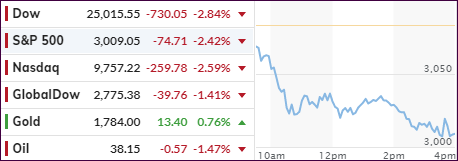
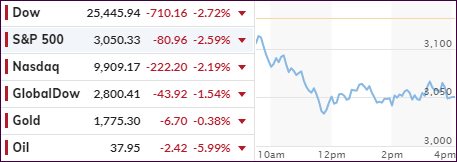
Yesterday’s late pump vanished in a hurry this morning, as the major indexes opened in the red, slipped but found some mid-day support, before diving into the close.
News of spikes in coronavirus cases were the cause with Texas and Florida taking drastic action by re-closing bars again. In other words, we’re backtracking the re-opening efforts, which should put a nail in the coffin of the highly anticipated V-shape recovery.
Even 2 of the White House mouth pieces could not stop the downward trend:
1510ET *KUDLOW SAYS EVERY NUMBER IS SHOWING V-SHAPE RECOVERY FOR U.S.
1515ET *MNUCHIN: WILL GO BACK TO CONGRESS NEXT MONTH FOR MORE TOOLS
Also not helping were new restrictions on banks, which MarketWatch summed up like this:
Investors are also digesting the results of the Federal Reserve’s annual bank stress tests which requires banks to preserve capital by suspending share repurchases and cap dividend payments in the third quarter based on average net income over the past four quarters.
However:
Financial institutions got a boost on Thursday after the Federal Deposit Insurance Commission and Office of the Comptroller of the Currency said they are planning to loosen the restrictions imposed by the Volcker rule and allow banks to more easily make large investments into venture capital and similar funds, among other rule rollbacks.
For the week, the indexes got slammed with the S&P 500 surrendering some -2.9% supporting our decision follow our TTI and move to the safety of the sidelines.
Coinciding with my “Sell” signal were several cycle analysts, who forecast this week, and into the 30th of this month, to be the end of this current rebound.
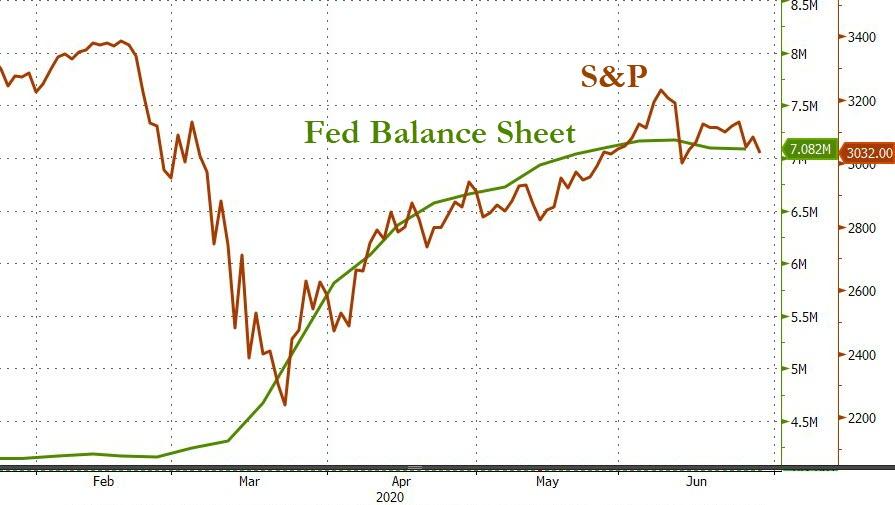
Remember, this past bullish period did not occur because of economic fundamentals, it was merely a gift by the Fed via generating enormous amounts of liquidity, which was soaked up by the markets.
Analyst Sven Henrich saw it this way:
No bull market without central bank intervention has now been proven beyond a reasonable doubt. The Fed is busted, and Wall Street exposed to be nothing but a suckling at the Fed’s liquidity chest.
Rallies still occur when the Fed intervenes. But despite two interventions in June prices now remain below the June 8th peak. The Fed and markets now have to prove they can exceed above these prices or potentially face the point of singularity: No bull market even with central bank intervention. If they can’t, then this bear market will come out of hiding.
What that means is that any further bullishness will be a function of the Fed throwing an assist, especially if the Covid-19 woes continue. If the Fed does not act, you can be assured that we will be re-visiting the March lows.
1. From the universe of over 1,800 ETFs, I have selected only those with a trading volume of over $5 million per day (HV ETFs), so that liquidity and a small bid/ask spread are assured.
2. Trend Tracking Indexes (TTIs)
Buy or Sell decisions for Domestic and International ETFs (section 1 and 2), are made based on the respective TTI and its position either above or below its long-term M/A (Moving Average). A crossing of the trend line from below accompanied by some staying power above constitutes a “Buy” signal. Conversely, a clear break below the line constitutes a “Sell” signal. Additionally, I use a 7.5% trailing stop loss on all positions in these categories to control downside risk.
3. All other investment arenas do not have a TTI and should be traded based on the position of the individual ETF relative to its own respective trend line (%M/A). That’s why those signals are referred to as a “Selective Buy.” In other words, if an ETF crosses its own trendline to the upside, a “Buy” signal is generated. Since these areas tend to be more volatile, I recommend a wider trailing sell stop of 7.5% -10% depending on your risk tolerance.
If you are unfamiliar with some of the terminology, please see Glossary of Termsand new subscriber information in section 9.
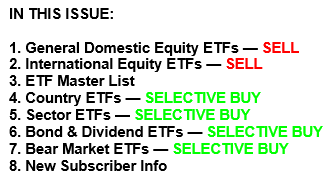
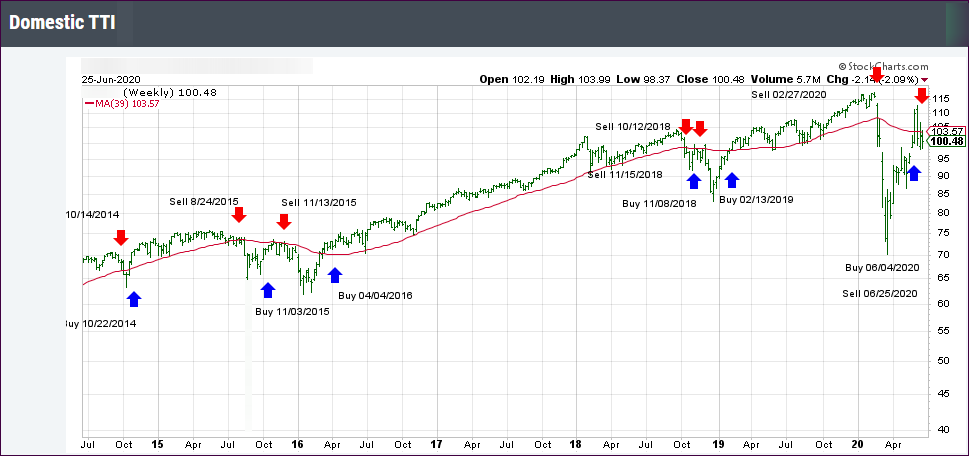
1. DOMESTIC EQUITY ETFs: SELL— since 06/25/2020
Click on chart to enlarge
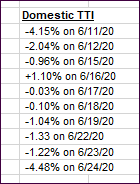
Our main directional indicator, the Domestic Trend Tracking Index (TTI-green line in the above chart) has now dropped below its long-term trend line (red) by -3.51% and has generated a new Domestic “Sell” signal effective 06/25/20 as posted.
The markets did not show us a rebound this morning, so the Domestic “Sell” signal stands—at least for the time being.
We’re living in such uncertain times, that we can never be sure, nor does anybody know, if this was just one more head fake or the beginning of another devastating down trend, that could take out the March lows.
As a result, we are going the safe route and follow our signals. Some analysts contribute this week’s sell-off to quarter-ending rebalancing, but that is nothing but a guess.
Should the bullish theme prevail via another rally next week, we will pick a new entry point in accordance with our Trend Tracking Index. I believe in this environment of total uncertainty it is better to be safe than sorry, however, we will hang on to our current gold/sector positions subject to their respective trailing sell stops.
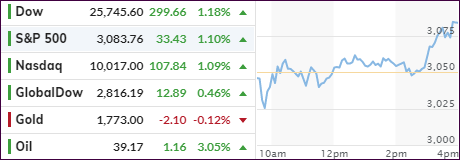
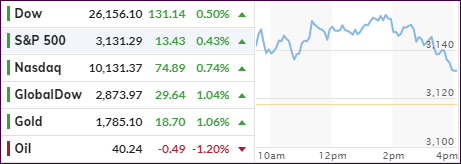
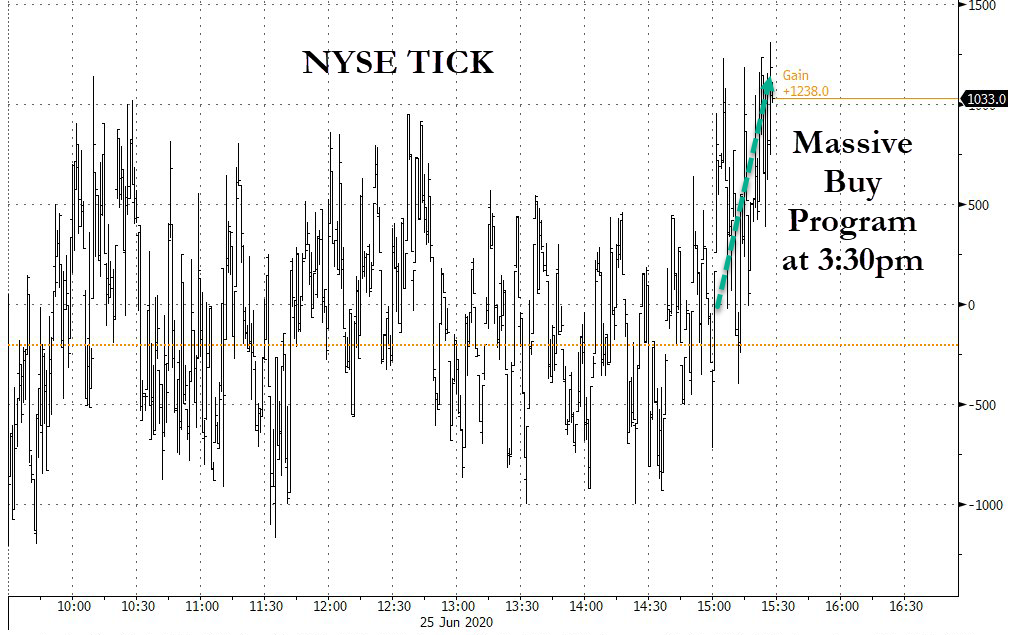
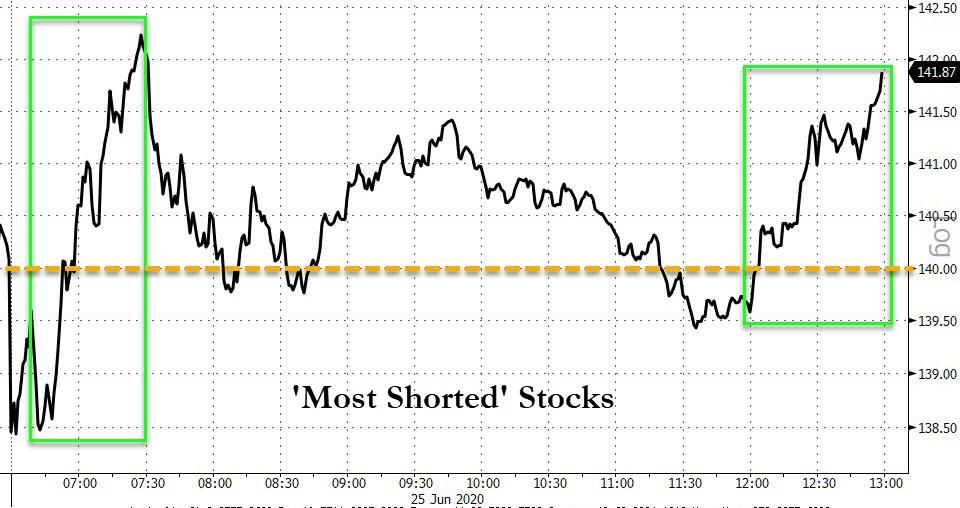
An early 200-point Dow drop was recouped with the indexes mainly vacillating around their unchanged lines in a tight range until, during the last 30 minute of the session, a massive Buy program kicked in and ignited a spectacular short-squeeze, which lifted the major indexes solidly in the green.
Reader Gary suggested that “you can’t fight the Fed plus we are going into election. The market is being controlled by the government so normal movement is gone.”
This is correct, but you also must consider that there are opposing forces that want to make sure at all costs that the incumbent President will not be re-elected. That means we are engaged in a tug-of-war with the outcome being impossible to predict.
I follow our TTI signals, because I don’t mind erring on the side of caution, which is far better than going down with a sinking ship—just because it wasn’t supposed to be sinking.
Yesterday, I was talking about the markets being stuck in a neutral zone regarding our Domestic Trend Tacking Index (TTI) and that more evidence of either bullishness or bearishness would determine our next cause of action.
We got that signal today when the major indexes plunged right after the opening bell with the Dow being down over 800 points at its worst, before recovering to close deep in the red and surrendering some -710 points.
As the markets slipped early on, I took the opportunity to lighten up even more on our holdings and locking in some profits, while leaving us only with sector exposure and gold.
Here’s how our Domestic TTI has performed recently relative to its long-term trend line:
Increased worries, that continued rising coronavirus cases in many states would at least set back the nascent economic recovery, created such anxiety that all 11 sectors in the S&P index closed lower. Florida and California set records for new cases, while intensive-care unit beds were reported to reach the 97% capacity in Houston.
Not helping matters were news that Apple was re-closing another 7 stores in Texas due to the coronavirus spike.
The headline hit at time when stock uneasiness was “morphing into fright” as Bloomberg put it, after data showed virus cases spiking in Florida and Texas, California reporting a record 7,149 new cases, while New York, Connecticut and New Jersey said visitors would face a mandatory quarantine. The news sent the S&P sliding 2.7%.
“The latest coronavirus news is not positive for the stock market which was betting the worst of the pandemic recession was behind us,” said Chris Rupkey, chief financial economist for MUFG Union Bank. “Hopes of investors looking for a better economy to improve the bottom lines of companies shut down in the recession have been dashed.”
In the end, our Domestic TTI confirmed the weakness it had shown for the past 10 trading days and generated a “Sell” signal for “broadly diversified domestic equity ETFs/Mutual funds.”
This “Sell” signal will be effective with the close of the market tomorrow, June 25th, unless a strong rebound is in the making, in which case I will postpone the effective date.
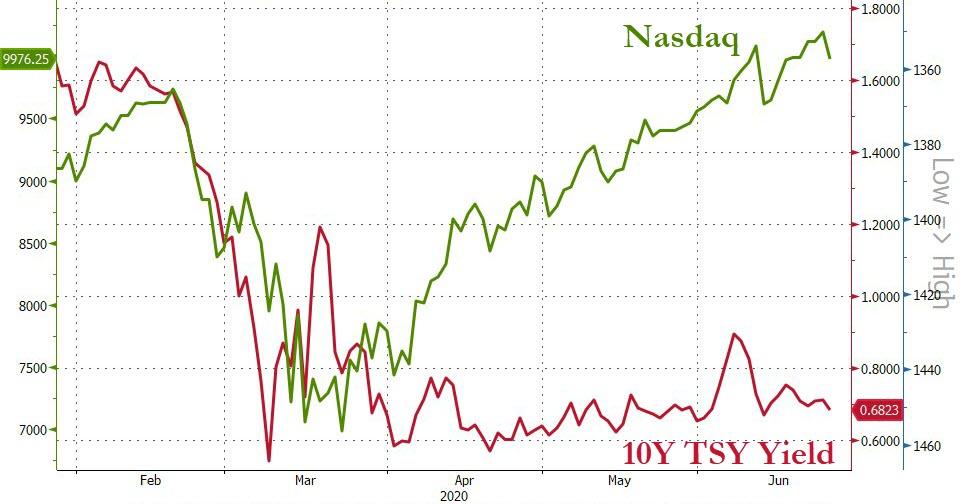
Have we now reached the point where stocks finally will catch down to bond’s reality, as ZH/Bloomberg posted in this chart?
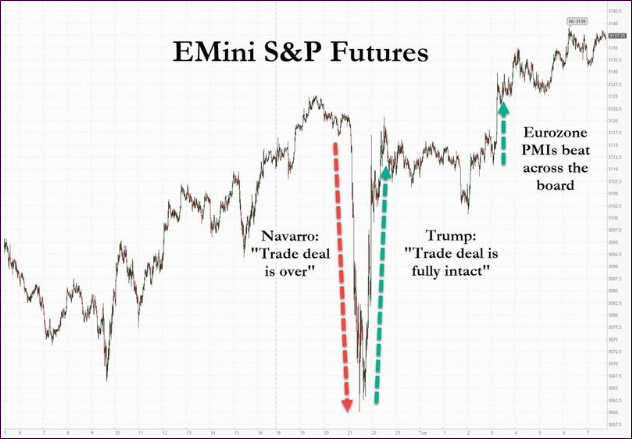
Yesterday was one of those moments, while watching the futures markets, when I had to laugh out loud. The major indexes were creeping higher when suddenly the bottom dropped out with the Down plunging over 500 points in minutes.
Turns out that Trump’s trade advisor Navarro responded during a Fox News interview regarding the China trade deal: “It’s over. Yes.” The fallout was imminent, and it appears that Navarro got a tap on the shoulder and hastily walked his comments back as “having been taken wildly out of context” pushing the futures back up.
Thanks to ZH, here’s a graphic representation of the events:
And the summary:
Navarro dump – US-China trade deal “is over”
Trump pump – US-China trade deal “fully intact”
Kudlow pump – “absolutely, definitely” no second lock-down due to virus
Fauci slump – “disturbing surge” in infections
Fauci pump – “promising” vaccine is imminent
The regular session had bullish undertones helped by US New Homes Sales, which soared in May, but the manufacturing and service sectors disappointed, as Labor weakness continued.
While the broad market continues to linger, the main story is all about the tech sector with Apple and Netflix scoring to new highs, as the Nasdaq notched a new intra-day record.
Despite the re-opening efforts with business trying to play catchup, Covid-19 is still on everyone’s mind, as MarketWatch reports:
Dr. Anthony Fauci, the nation’s top infectious disease expert, warned on Tuesday that the “next couple of weeks are going to be critical” in terms of the addressing a “disturbing surge” in COVID-19 cases across the United States, while also vowing to ramp up, not slow down, testing for the virus, in testimony before Congress on the federal response to the pandemic.
Again, broad markets lagged, which also explains why our Domestic TTI has not crossed back above its long-term trend line into bullish territory but lingers slightly below it.
This indicates that we continue to be stuck in the neutral zone, meaning we’re holding on to our positions until more evidence of either bullishness or bearishness emerges, which will then signal our next cause of action: Buy more or Sell all.
