
- Moving the markets
Yesterday, I was talking about the markets being stuck in a neutral zone regarding our Domestic Trend Tacking Index (TTI) and that more evidence of either bullishness or bearishness would determine our next cause of action.
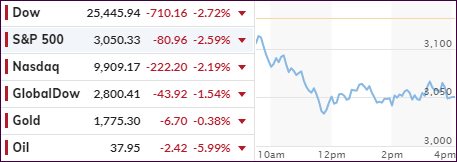
We got that signal today when the major indexes plunged right after the opening bell with the Dow being down over 800 points at its worst, before recovering to close deep in the red and surrendering some -710 points.
As the markets slipped early on, I took the opportunity to lighten up even more on our holdings and locking in some profits, while leaving us only with sector exposure and gold.
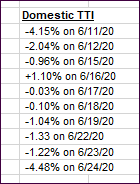
Here’s how our Domestic TTI has performed recently relative to its long-term trend line:
Increased worries, that continued rising coronavirus cases in many states would at least set back the nascent economic recovery, created such anxiety that all 11 sectors in the S&P index closed lower. Florida and California set records for new cases, while intensive-care unit beds were reported to reach the 97% capacity in Houston.
Not helping matters were news that Apple was re-closing another 7 stores in Texas due to the coronavirus spike.
The headline hit at time when stock uneasiness was “morphing into fright” as Bloomberg put it, after data showed virus cases spiking in Florida and Texas, California reporting a record 7,149 new cases, while New York, Connecticut and New Jersey said visitors would face a mandatory quarantine. The news sent the S&P sliding 2.7%.
“The latest coronavirus news is not positive for the stock market which was betting the worst of the pandemic recession was behind us,” said Chris Rupkey, chief financial economist for MUFG Union Bank. “Hopes of investors looking for a better economy to improve the bottom lines of companies shut down in the recession have been dashed.”
In the end, our Domestic TTI confirmed the weakness it had shown for the past 10 trading days and generated a “Sell” signal for “broadly diversified domestic equity ETFs/Mutual funds.”
This “Sell” signal will be effective with the close of the market tomorrow, June 25th, unless a strong rebound is in the making, in which case I will postpone the effective date.
Have we now reached the point where stocks finally will catch down to bond’s reality, as ZH/Bloomberg posted in this chart?
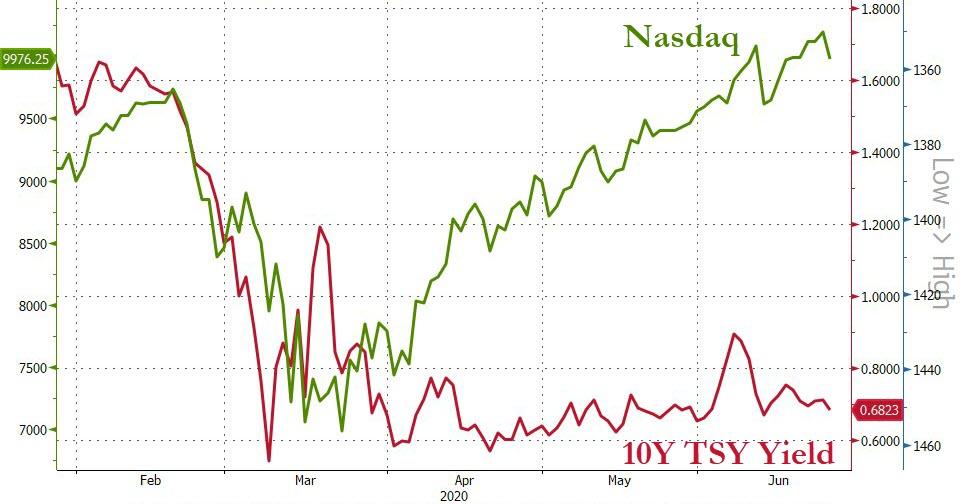
2. ETFs in the Spotlight
In case you missed the announcement and description of this section, you can read it here again.
It features some of the 10 broadly diversified domestic and sector ETFs from my HighVolume list as posted every Saturday. Furthermore, they are screened for the lowest MaxDD% number meaning they have been showing better resistance to temporary sell offs than all others over the past year.
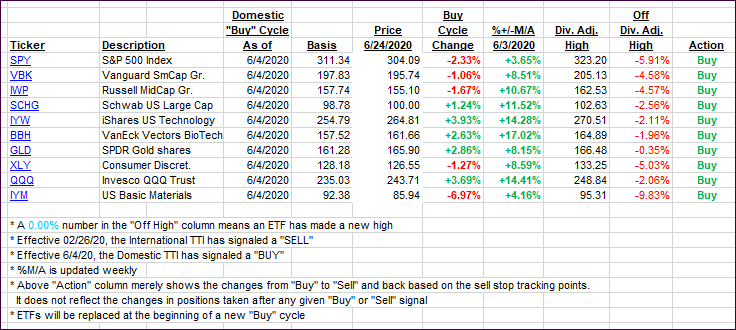
The below table simply demonstrates the magnitude with which these ETFs are fluctuating above or below their respective individual trend lines (%+/-M/A). A break below, represented by a negative number, shows weakness, while a break above, represented by a positive percentage, shows strength.
For hundreds of ETF choices, be sure to reference Thursday’s StatSheet.
For this new domestic “Buy” cycle, which was effective 6/4/2020, here’s how some our candidates have fared:
Click image to enlarge
Again, the %+/-M/A column above shows the position of the various ETFs in relation to their respective long-term trend lines, while the trailing sell stops are being tracked in the “Off High” column. The “Action” column will signal a “Sell” once the -8% point has been taken out in the “Off High” column. For more volatile sector ETFs, the trigger point is -10%.
3. Trend Tracking Indexes (TTIs)
Our TTIs plunged as new Covid-19 cases took the starch out of bullish momentum, thereby signaling a “Sell” for domestic equity ETFs/mutual funds. As mentioned above, this signal will be effective as of tomorrow, unless a strong rebound is in the making.
This is how we closed 06/24/2020:
Domestic TTI: -4.48% below its M/A (prior close -1.22%)—Buy signal effective 06/04/2020
International TTI: -4.63% below its M/A (prior close -2.13%)—Sell signal effective 02/26/2020
Disclosure: I am obliged to inform you that I, as well as my advisory clients, own some of the ETFs listed in the above table. Furthermore, they do not represent a specific investment recommendation for you, they merely show which ETFs from the universe I track are falling within the specified guidelines.
Contact Ulli