Do you want to know which ETFs are hot and which ones are not? Then you need my High-Volume ETF Cutline report. It tells you how close or far each of the 311 ETFs I follow is from its long-term trend line (39-week SMA). These are the ETFs that trade more than $5 million a day, so they are not some obscure funds that nobody cares about.
The report is split into two parts: The winners that are above their trend line (%M/A), and the losers that are below it. The yellow line is the line of shame that separates them. You can see how many ETFs are in each group and how they have changed since the last report (219 vs. 216 current).
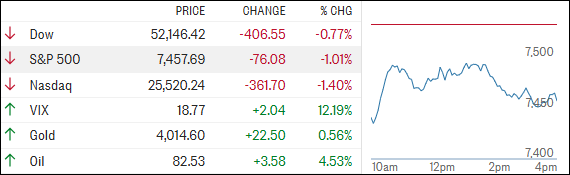
TECH TAKES A BEATING WHILE GEOPOLITICAL RISKS ADD TO MARKET JITTERS
[Chart courtesy of MarketWatch.com]
Moving the market
Stocks remained under pressure as the S&P 500 extended its decline, putting the index on track for a losing week.
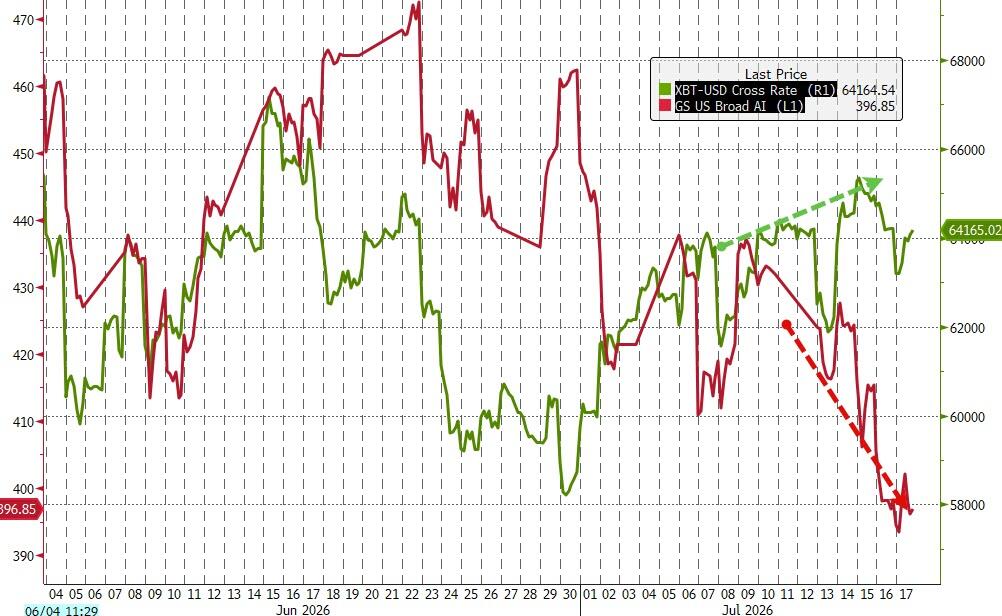
Much of the weakness came from the technology sector, with the Nasdaq taking a particularly hard hit as traders continued to question whether the massive spending spree on artificial intelligence will deliver the returns many have been expecting.
Semiconductor stocks were once again at the center of the selloff. Both the iShares semiconductor ETF (SOXX) and the VanEck semiconductor ETF (SMH) fell more than 2% on the day, with SMH now down roughly 9% for the week.
The weakness added to losses from the previous session, underscoring just how quickly sentiment has turned against one of the market’s strongest groups this year.
A growing concern is the rapid progress of open-source AI models coming out of China.
Reports suggesting these models are beginning to rival offerings from OpenAI and anthropic have investors wondering whether the industry’s enormous ai spending commitments can be justified over the long run.
Outside of semiconductors, Netflix was another notable loser, tumbling more than 8% after its outlook did little to calm fears that subscriber and revenue growth may be starting to slow.
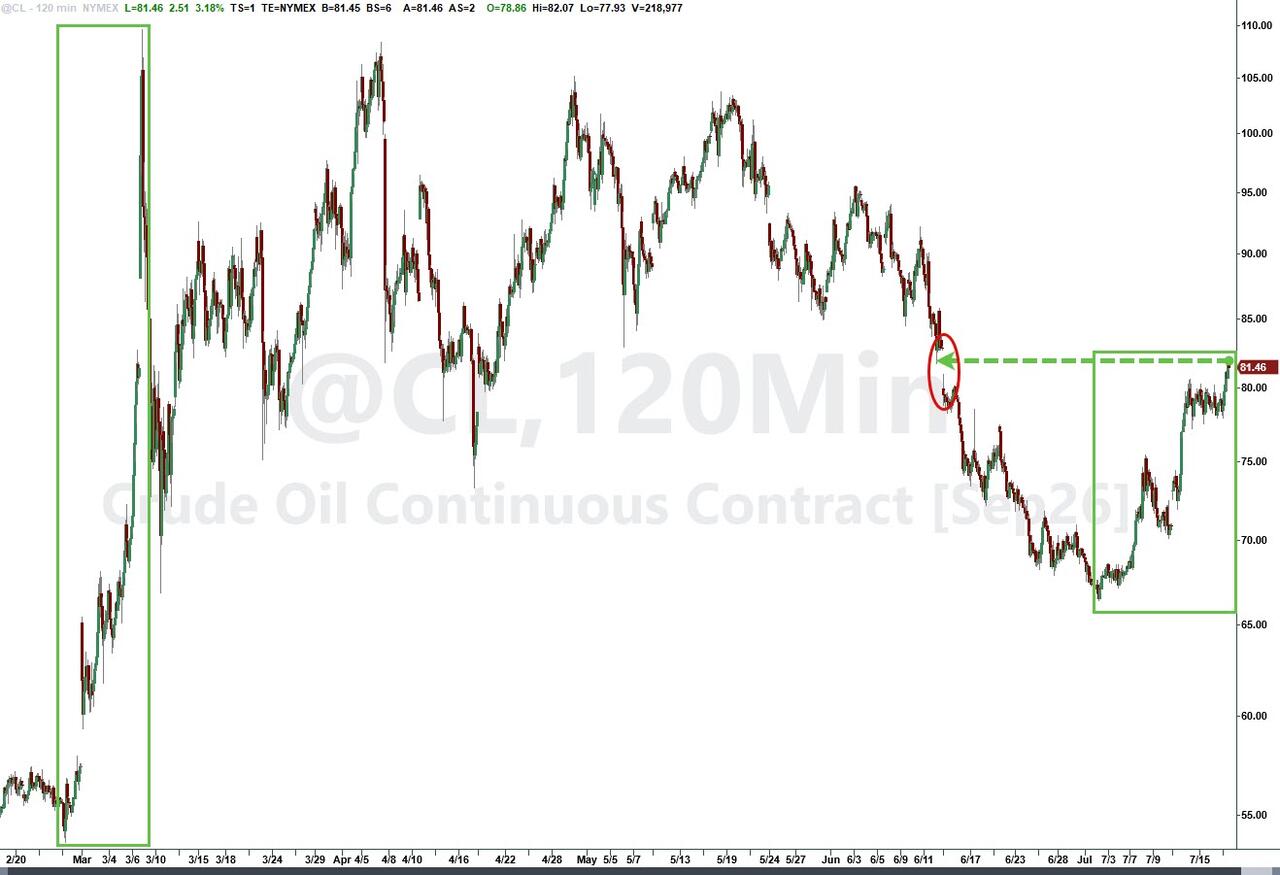
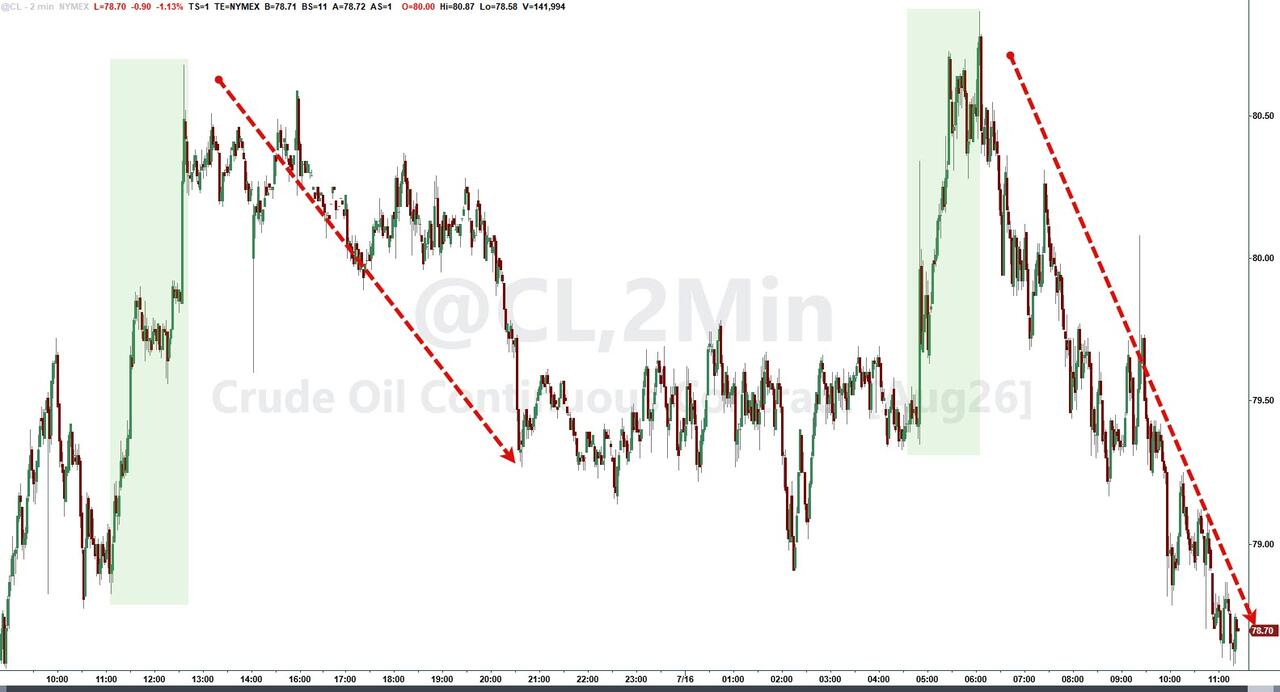
Geopolitical tensions also stayed firmly on investors’ radar. Escalating hostilities between the U.S. and Iran helped push oil prices higher, while reports that Iran targeted U.S. military assets in Syria and Bahrain added to concerns that the conflict could spread further across the region.
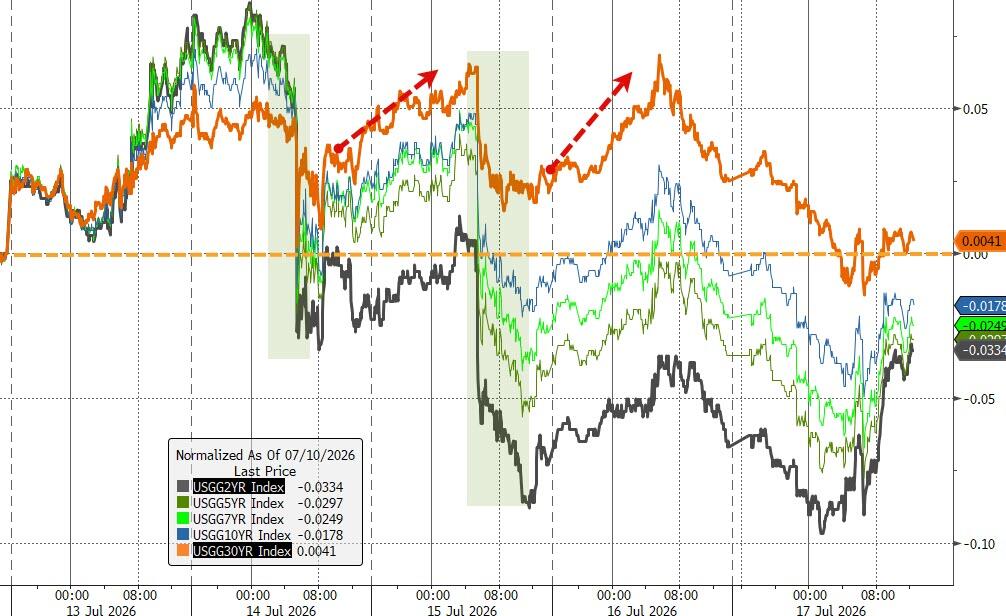
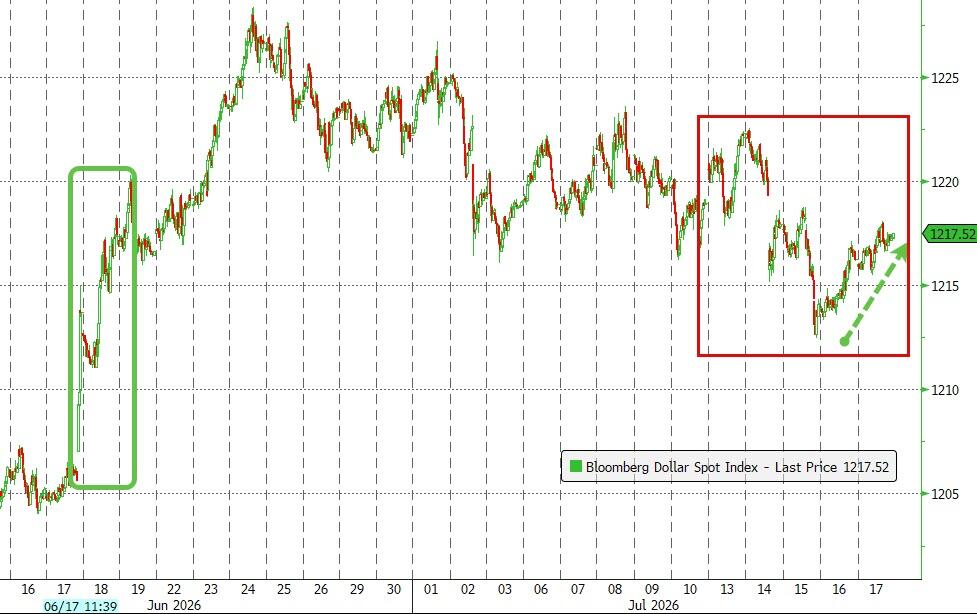
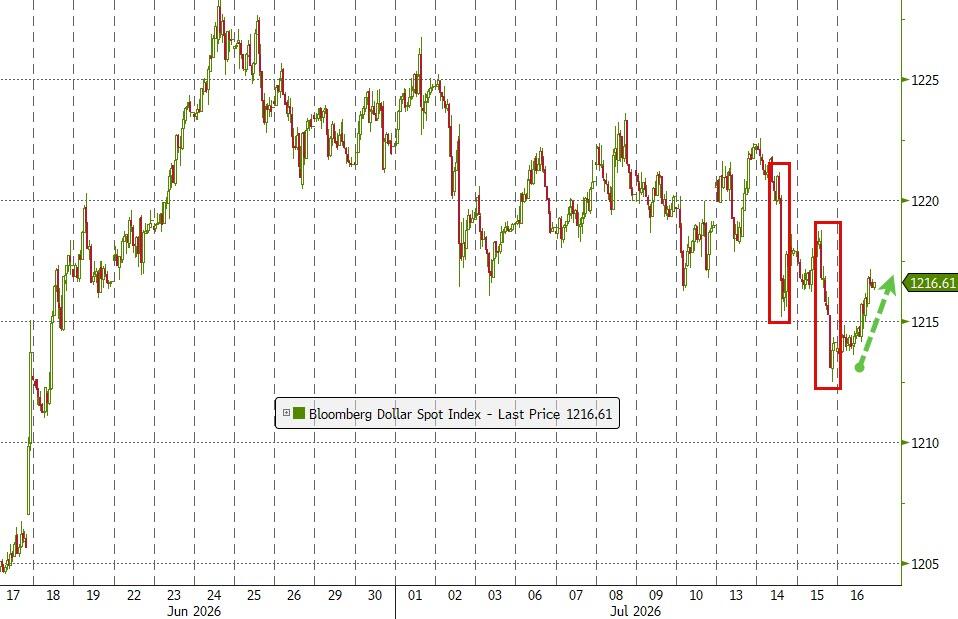
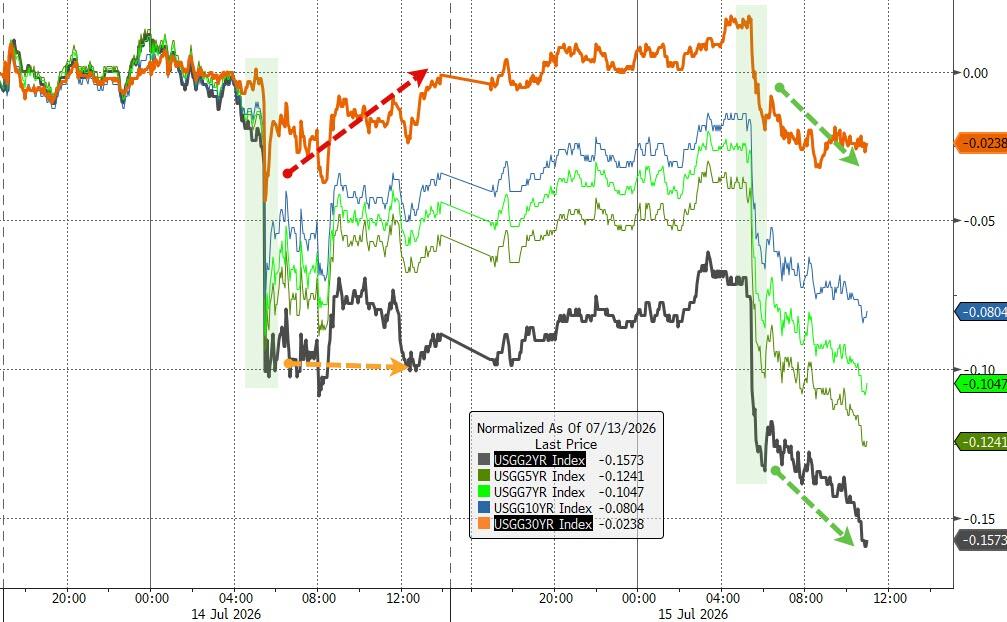
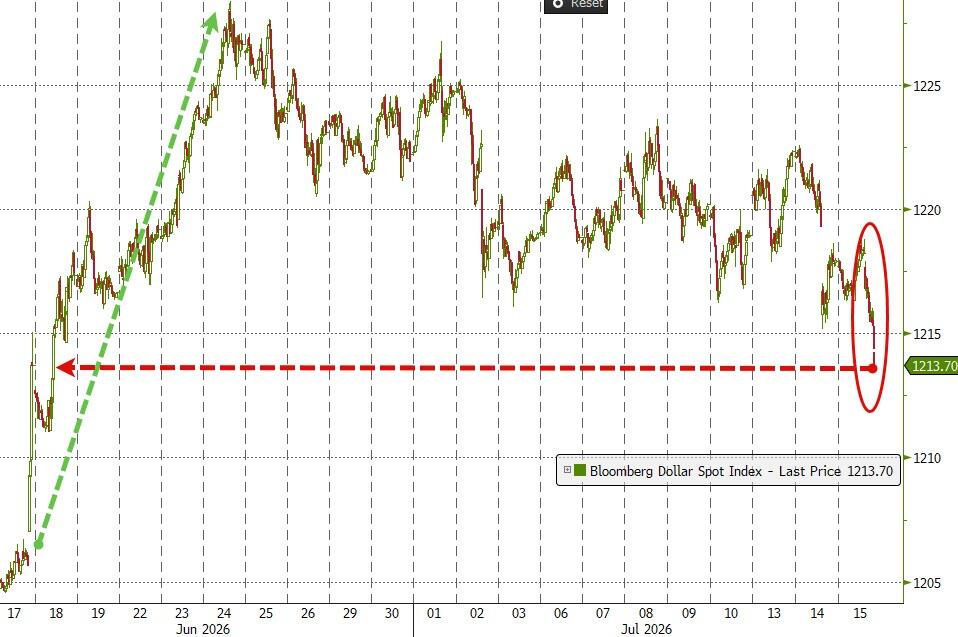
Elsewhere, bond yields moved lower over the course of the week, while the dollar traded choppily.
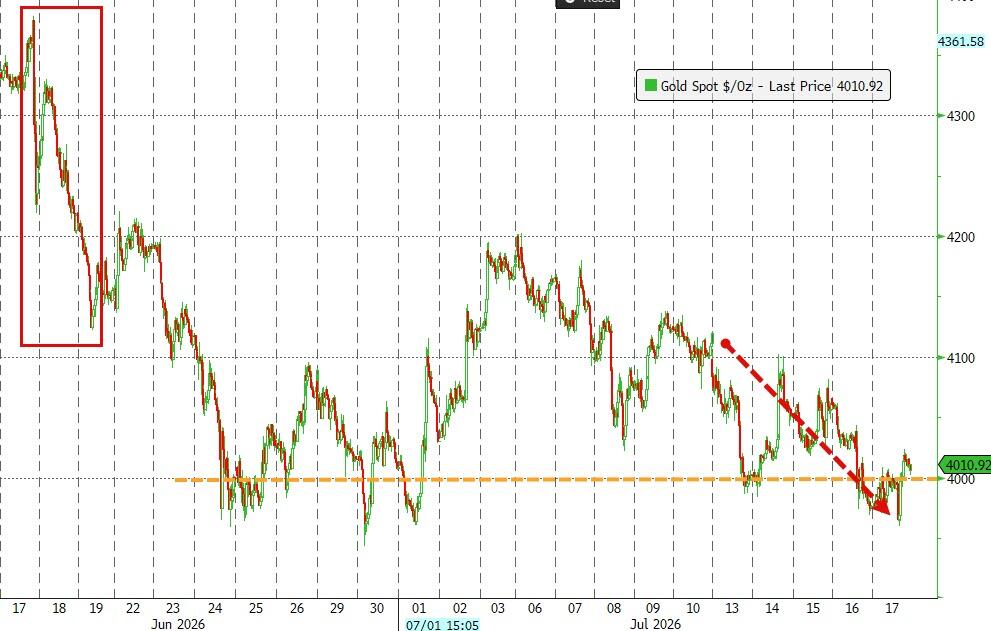
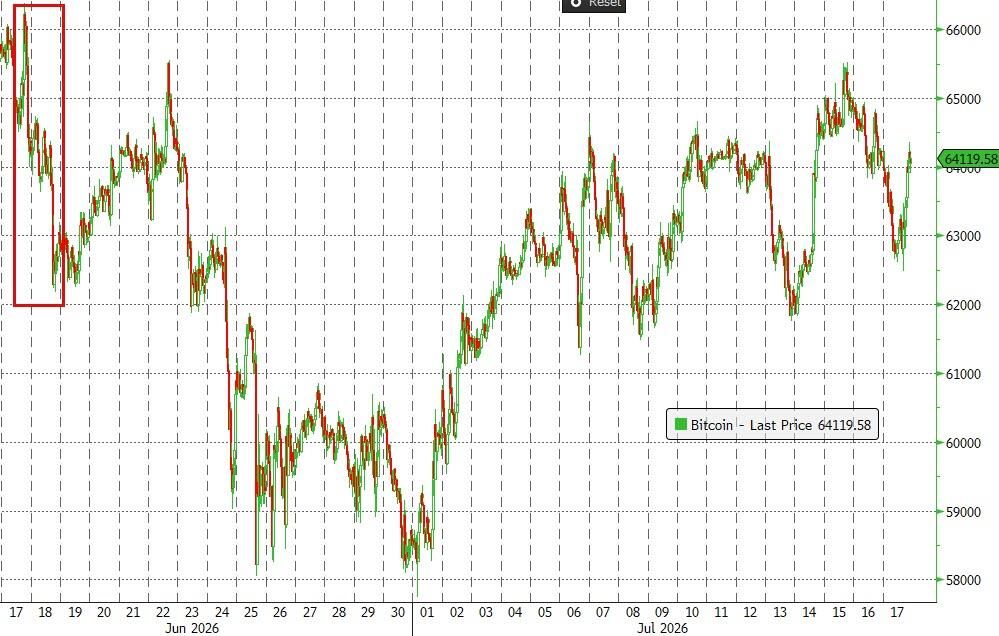
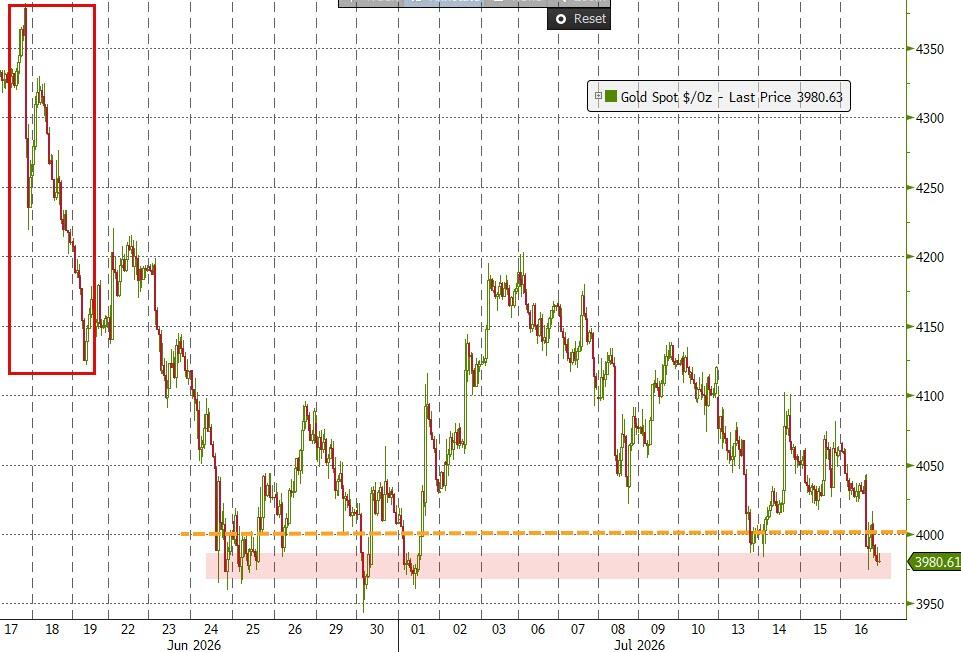
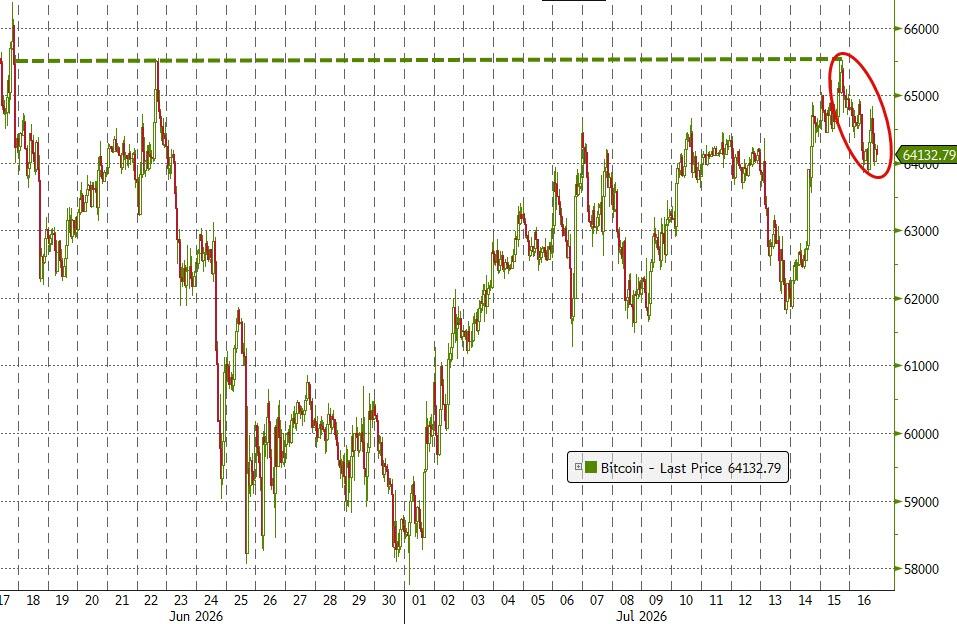
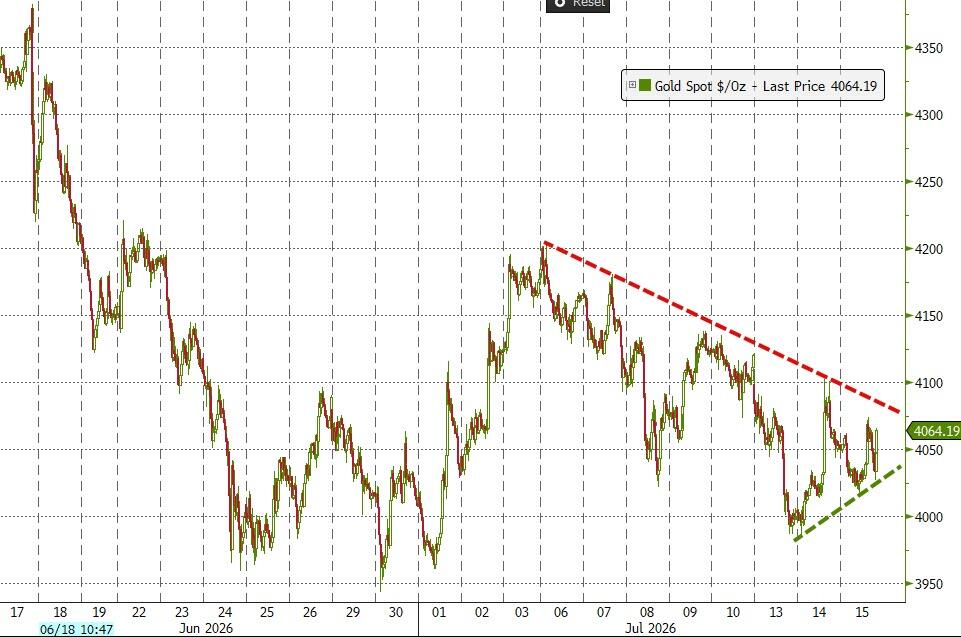
Gold struggled to hold above the $4,000 level, and bitcoin endured another roller-coaster week but managed to finish little changed, showing surprising resilience despite the sharp selloff in technology shares.
Stepping back, this week’s market action was largely driven by a significant shift in the macro narrative.
Cooler-than-expected inflation data reduced expectations for near-term federal reserve rate hikes, weakening the dollar and prompting traders to rethink many of the trades that had worked so well earlier this year.
As one analyst put it, “everything that has worked year-to-date suddenly seems to be moving in the wrong direction.“
The question now is whether this is simply a healthy rotation beneath the surface, or the beginning of a more meaningful change in market leadership?
Out of the 1,800+ ETFs out there, I only pick the ones that trade over $5 million per day (HV ETFs), so you don’t get stuck with a lemon that nobody wants to buy or sell.
Trend Tracking Indexes (TTIs)
These are the main indicators that tell you when to buy or sell Domestic and International ETFs (section 1 and 2). They do that by comparing their position to their long-term M/A (Moving Average). If they cross above, and stay there, it’s a green light to buy. If they fall below, and keep going, it’s a red light to sell. And to make sure you don’t lose your shirt if things go south, I also use a 12% trailing stop loss on all positions in these categories.
All other investment areas don’t have a TTI and should be traded based on the position of each ETF relative to its own trend line (%M/A). That’s why I call them “Selective Buy.” In other words, if an ETF goes above its own trend line, you can buy it. But don’t forget to use a trailing sell stop of 12%, or less if you’re feeling nervous.
If some of these words sound like Greek to you, please check out the Glossary of Terms and new subscriber information in section 9.
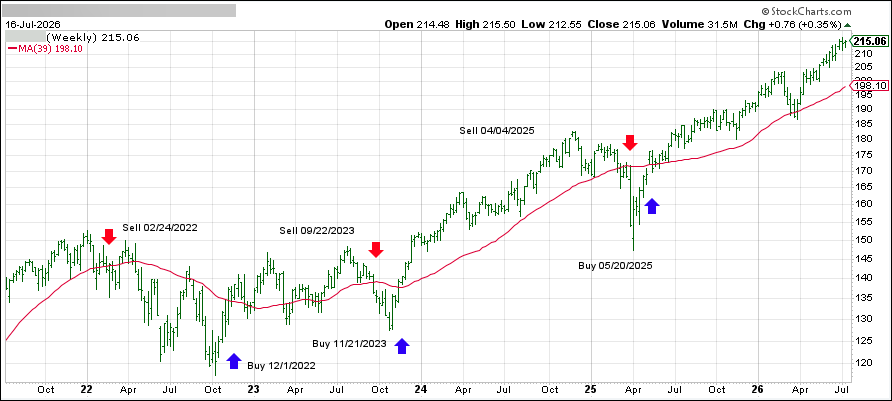
DOMESTIC EQUITY ETFs: BUY— effective 5/20/2025
Click on chart to enlarge
This is our main compass, the Domestic Trend Tracking Index (TTI-green line in the above chart). It has broken above its long-term trend line (red) by +8.99% and remains in “Buy” mode, with our holdings being subject to our trailing sell stops.
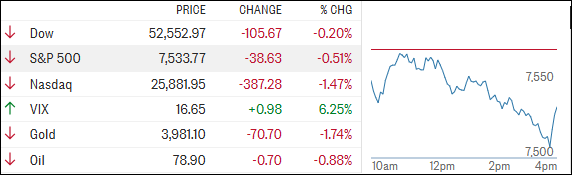
Stocks struggled to gain traction today, with the S&P 500 and Nasdaq coming under pressure early as a sell-off in chip stocks overshadowed an otherwise encouraging batch of earnings reports.
In fact, earnings season is off to a strong start. Of the 40 S&P 500 companies that have reported so far, more than 87% have beaten expectations.
The major banks, often viewed as a barometer of overall economic health, set a positive tone earlier this week by delivering second-quarter results that comfortably topped forecasts.
The economic data painted a mixed but generally resilient picture. The U.S. consumer continues to hold up despite ongoing pricing pressures.
Weekly jobless claims came in at 208,000, better than the 218,000 economists were expecting, while retail sales matched forecasts with a 0.2% increase.
On the flip side, housing data, consumer sentiment, and pending home sales all came in softer than expected.
Elsewhere, markets kept a close eye on geopolitics and commodities. Oil initially surged following reports of intensified U.S. strikes against Iran overnight, only to give back those gains later in the session.
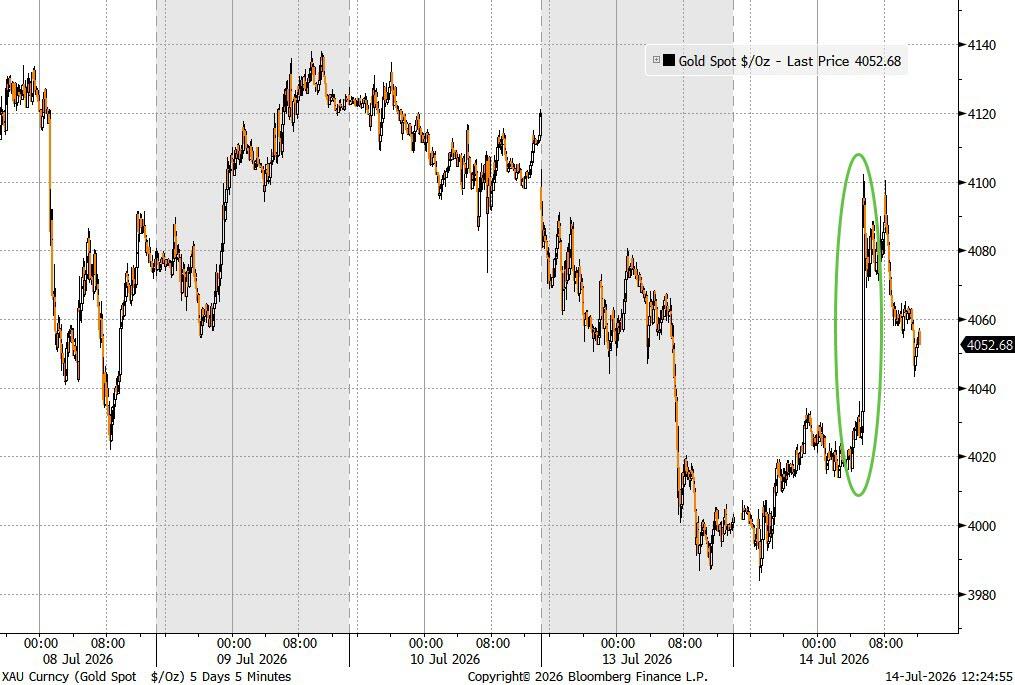
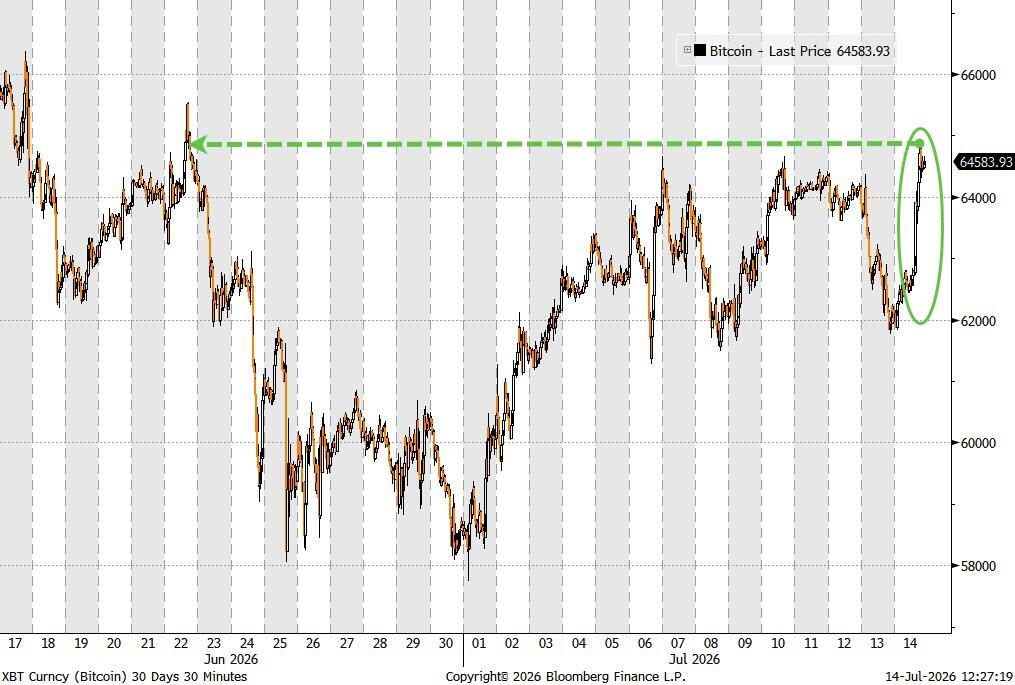
Despite the drama, crude has essentially gone nowhere over the past three days. The dollar bounced higher, gold fell below the $4,000 level, and bitcoin drifted lower before finding support near $64,000.
Meanwhile, the AI trade appears to be hitting a rough patch. Traders are beginning to question where the next leg of growth will come from as returns remain elusive, financing costs rise, local communities push back against data-center expansion, and power and water availability become increasingly important constraints.
Taken together, these crosscurrents could keep markets stuck in a sideways trading range until we get greater clarity on earnings, economic growth, and the future of the AI investment boom.
The question now is: will strong earnings be enough to reignite the market’s momentum, or is a longer period of consolidation ahead?
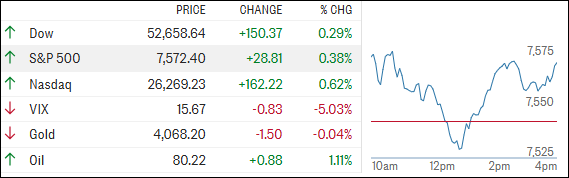
Stocks got off to a strong start today, with Big Tech leading the charge as investors welcomed more signs that inflation continues to cool.
Amazon, Apple, and Microsoft gained around 3%, while Alphabet added more than 1%, helping lift the major indexes. Risk appetite was also supported by strength in SpaceX shares.
The market’s upbeat mood was fueled by another encouraging inflation report. June’s Producer Price Index (PPI) unexpectedly fell 0.3%, following Tuesday’s cooler-than-expected Consumer Price Index (CPI) reading.
Together, the reports reinforced the view that inflation pressures may be easing, and that the Fed could have less reason to keep pushing interest rates higher.
New York Fed President John Williams added to that optimism, saying there are “encouraging reasons” to believe inflation has peaked and should continue edging lower in the coming quarters.
Even with stocks moving higher, gains were somewhat restrained as crude oil prices strengthened after renewed U.S. military action involving Iran raised geopolitical concerns.
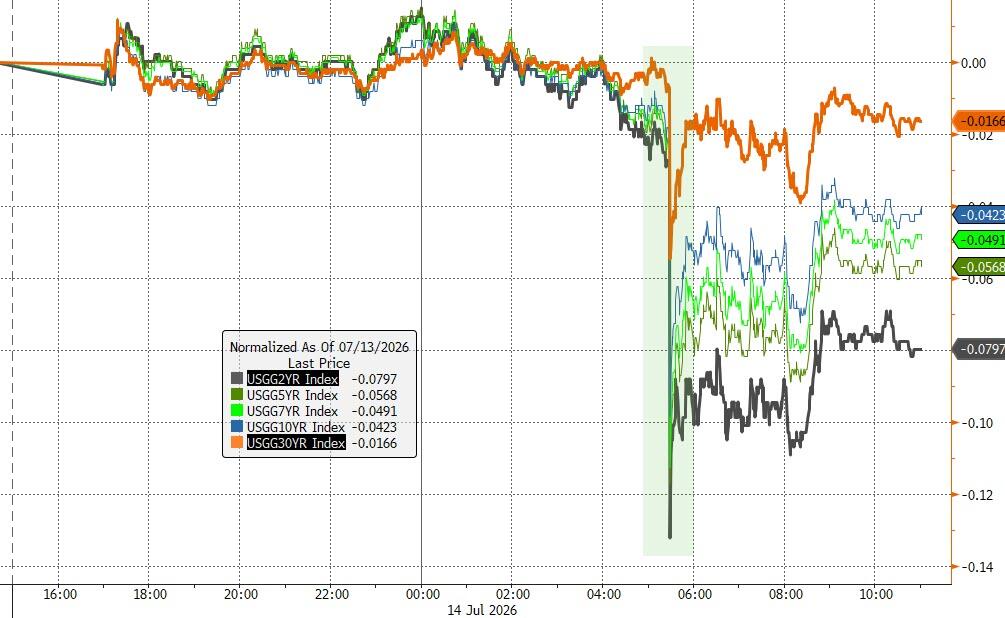
Meanwhile, bond yields continued their recent decline, falling for a second straight day as investors dialed back expectations for additional Fed tightening.
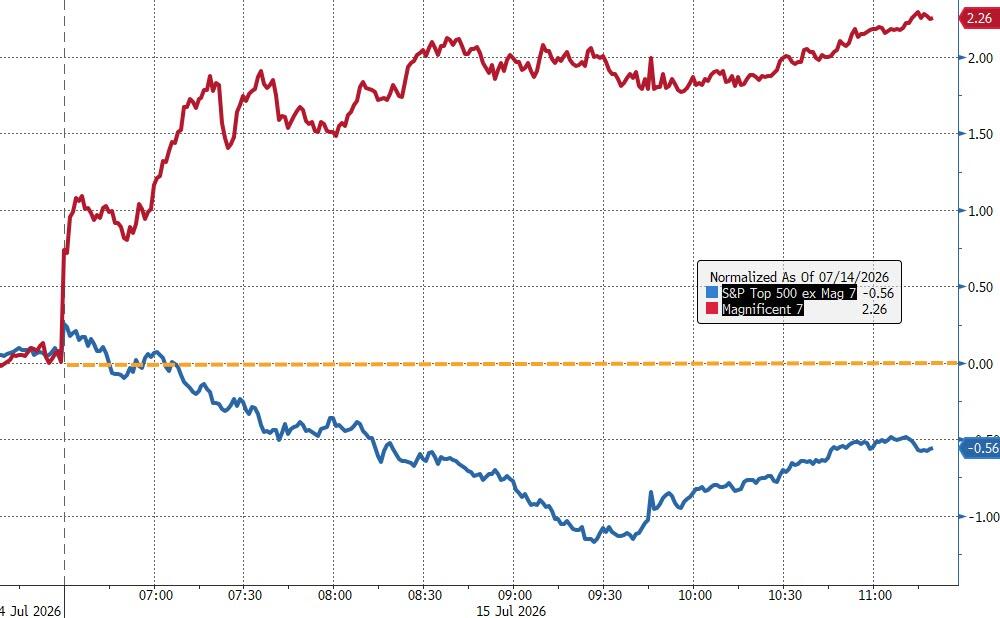
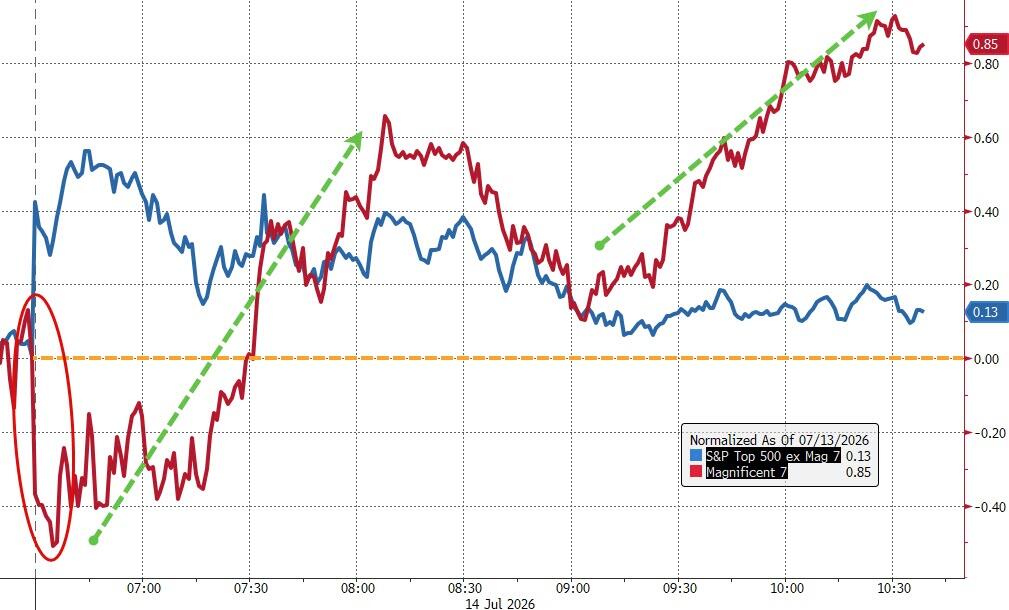
The Mag 7 was clearly in rally mode, handily outperforming the other 493 stocks in the S&P 500.
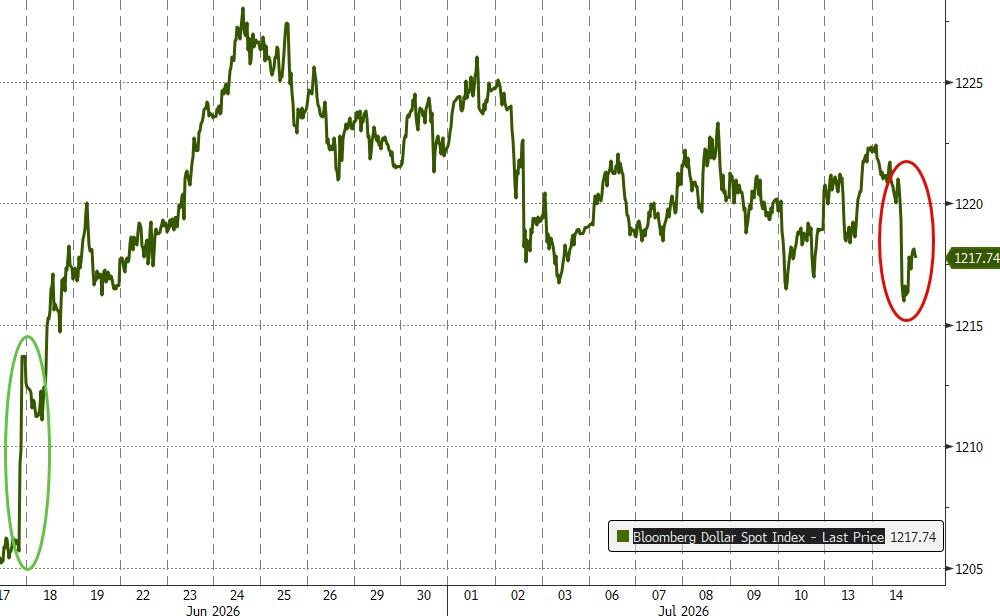
Outside of equities, the dollar took a noticeable hit, gold marked time but managed to remain above the $4,000 level, and bitcoin surged to as high as $65,500 before giving back a small portion of those gains into the afternoon.
All in all, it was a relatively quiet day beneath the surface. The broad market remained largely range-bound, but falling inflation data pushed rate-hike expectations, bond yields, and the dollar lower.
Bitcoin enjoyed a strong rally, while the precious metals market largely stood still.
The big question now is: Will cooling inflation continue to fuel the tech-led rally, or will investors start looking beyond the Magnificent 7 for the market’s next move?
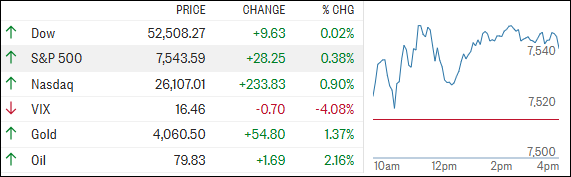
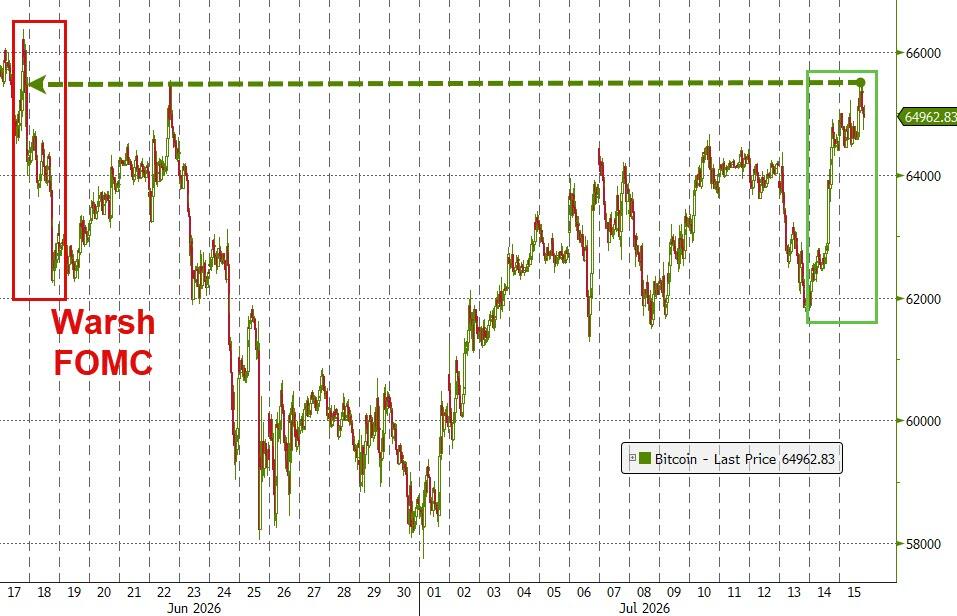
The S&P 500 and Nasdaq got off to a strong start today, led higher by semiconductor stocks after June inflation came in cooler than expected.
The Consumer Price Index (CPI) fell 0.4% for the month, bringing the annual inflation rate down to 3.5%, well below economists’ expectations of 3.8%.
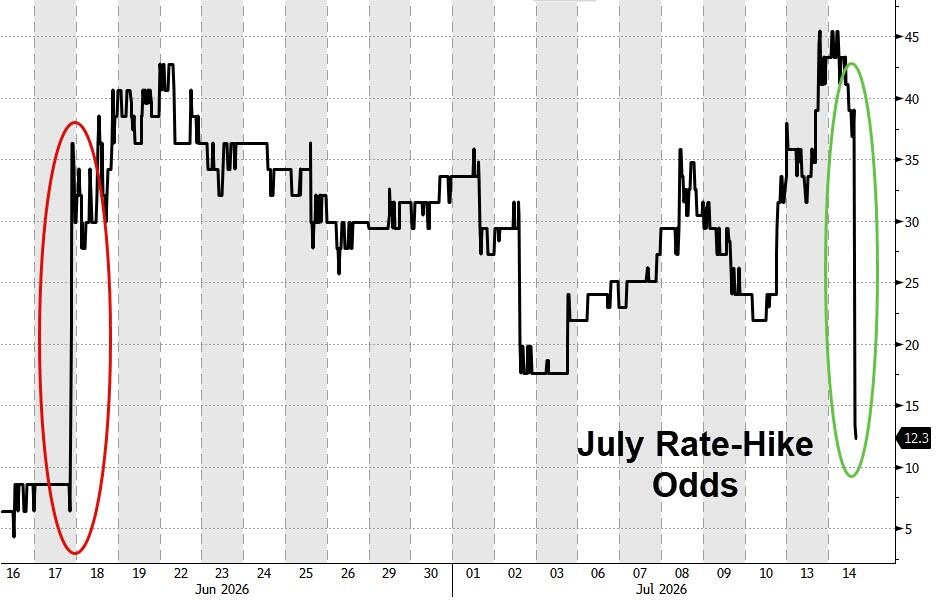
The softer inflation data immediately fueled hopes that the Federal Reserve may not need to be as aggressive with interest rates.
Expectations for a rate hike at the July meeting dropped sharply, while traders continued to price in a better-than-even chance of a move in September.
While today’s CPI report suggests that the inflation spike tied to the Iran conflict may be easing, investors aren’t ready to declare victory just yet.
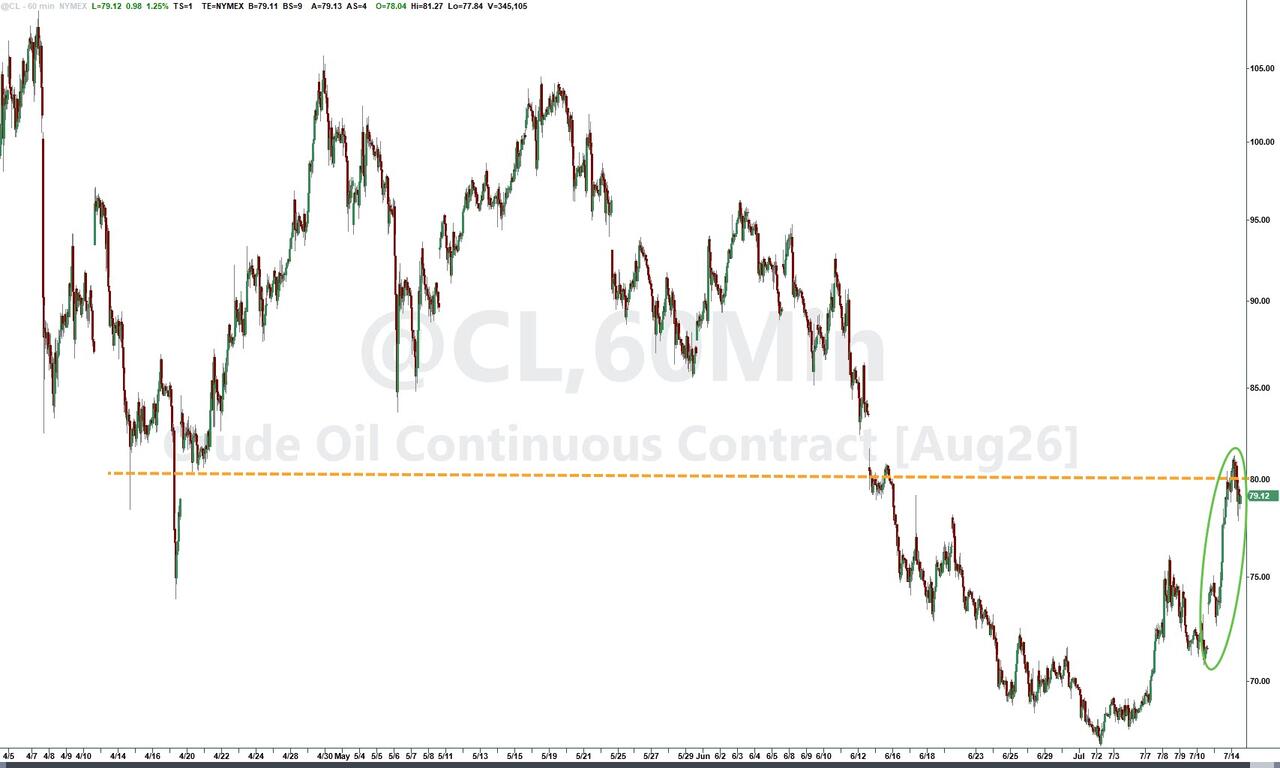
Geopolitical tensions remain elevated, and traders continued to keep a close eye on oil prices after U.S. crude briefly climbed above $80 per barrel.
Fresh concerns emerged after President Trump announced plans to reinstate a blockade on Iranian shipping through the Strait of Hormuz, a key global energy chokepoint.
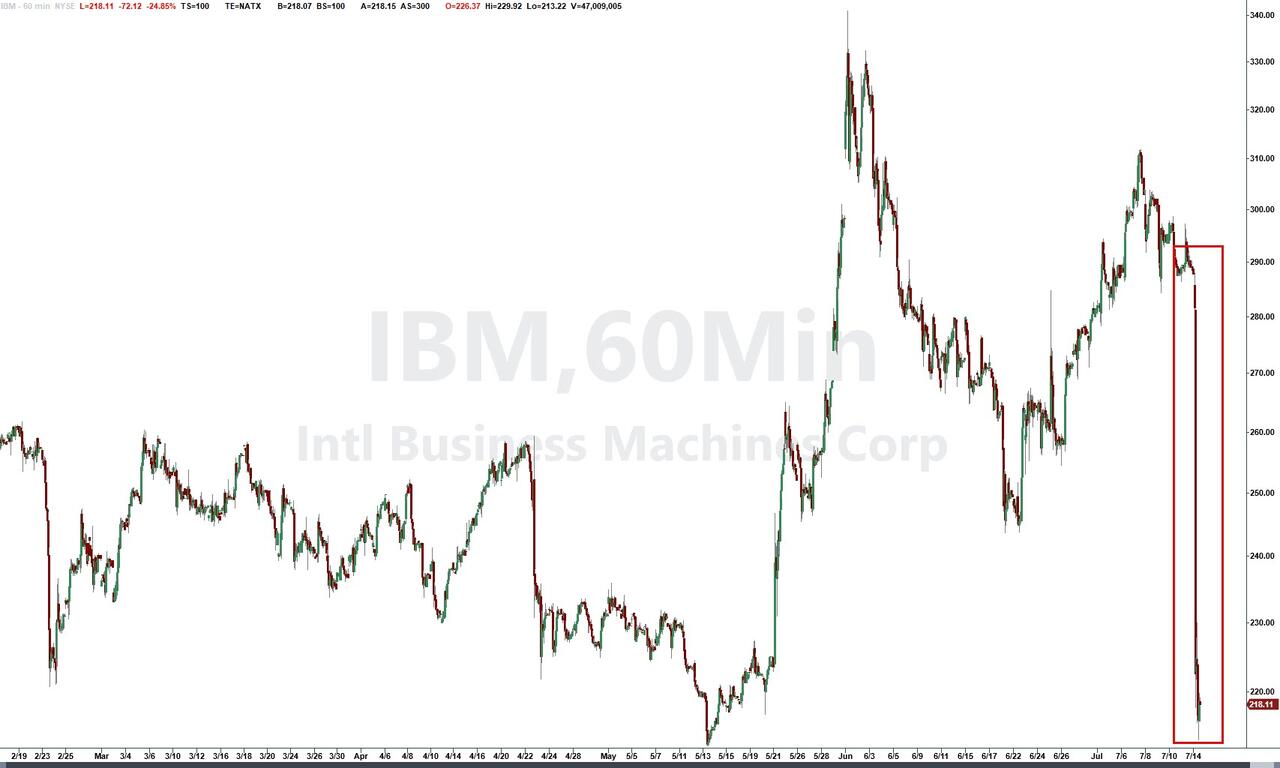
Not everything was rosy, however. IBM shares plunged 25% after the company warned that second-quarter profits would fall short of expectations due to weak demand in its software and infrastructure businesses. Ouch.
Despite those headwinds, falling bond yields and renewed buying in Mega-Cap and AI-related stocks helped support the broader market.
The Mag 7 once again outperformed the other 493 stocks in the S&P 500, overcoming a rough start to the session and leading the major indexes higher.
The dollar also weakened, providing a tailwind for alternative assets. Gold surged back above the $4,000 level, while bitcoin rallied from roughly $61,000 toward $65,000, marking its highest level in three weeks.
There were plenty of crosscurrents for traders to navigate today, but the market handled them surprisingly well. The big question now is whether the upcoming earnings season can provide enough fuel to keep this rally moving higher.
