
[Chart courtesy of MarketWatch.com]
- Moving the market
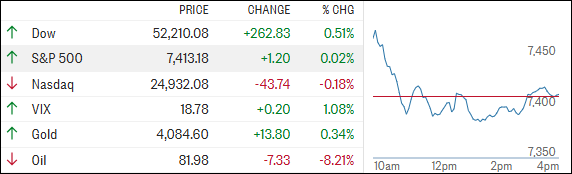
After opening higher, the S&P 500 and Nasdaq quickly reversed course as semiconductor stocks came under heavy selling pressure, overshadowing the relative calm that followed the weekend’s pause in hostilities between the U.S. and Iran.
Chipmakers led the retreat. The VanEck Semiconductor ETF (SMH) tumbled 3.7%, extending Friday’s losses. AMD and Teradyne each fell more than 7%, while Micron Technology dropped over 6%, weighing heavily on tech sentiment.
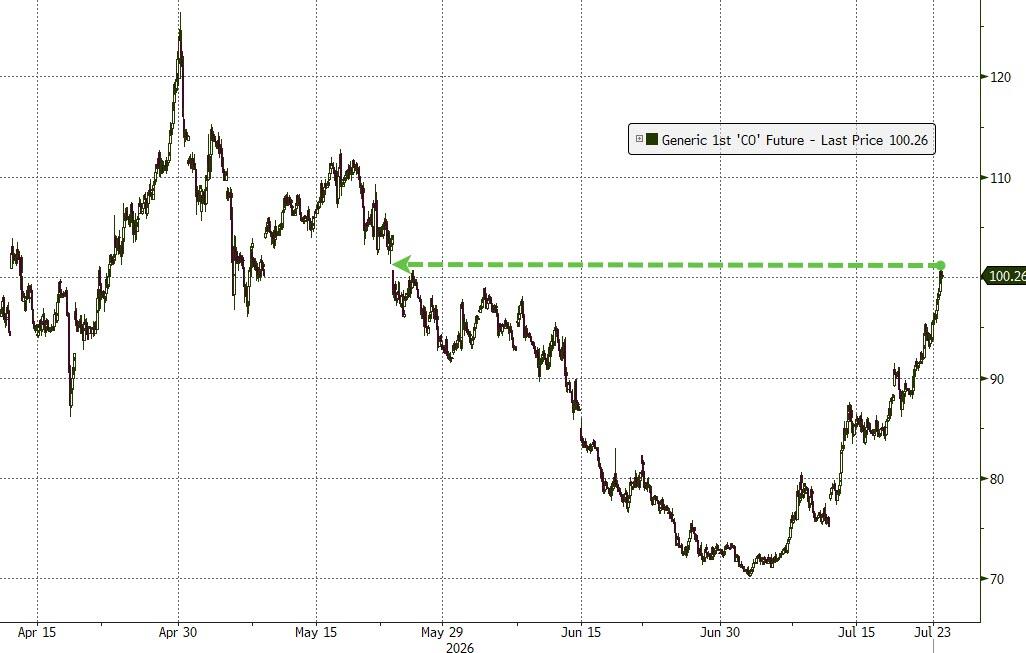
One bright spot came from the energy market. Easing tensions in the Middle East sent Brent crude futures sharply lower, with September contracts falling nearly 7% to around $90 per barrel.
Under normal circumstances, cheaper oil would provide a tailwind for stocks, but investors remained focused on broader market risks.
Meanwhile, geopolitical uncertainty is far from disappearing. Ukraine’s reported strike on an Iranian commercial vessel in the Caspian Sea added another layer of tension, prompting Tehran to denounce the incident as a “hostile and criminal act.”
Investors now face a critical week packed with potential market-moving events. Earnings reports from Amazon, Apple, Meta, and Microsoft will put the spotlight on corporate spending and the return on massive AI investments.
After Alphabet’s disappointing report last week, traders will be watching closely for signs that AI-related spending is starting to generate meaningful results.
The Federal Reserve also takes center stage on Wednesday. While most economists expect the next rate hike to come in September, markets are increasingly considering the possibility that the Fed could act sooner, adding another layer of uncertainty.
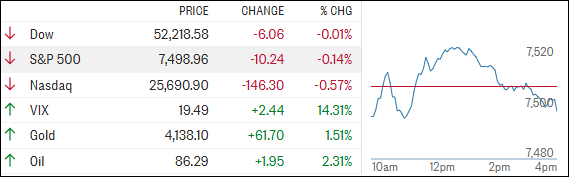
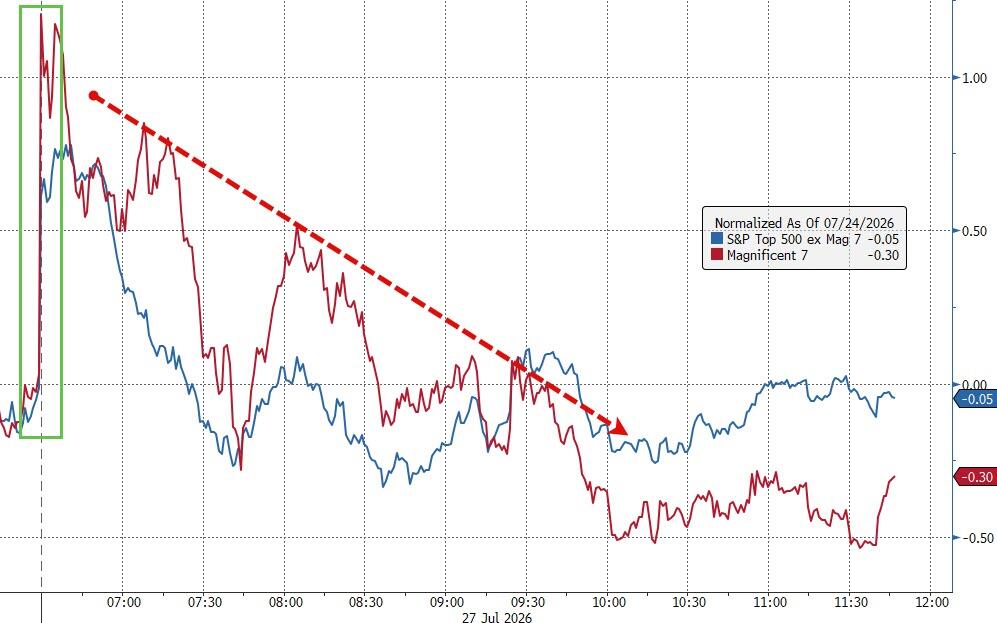
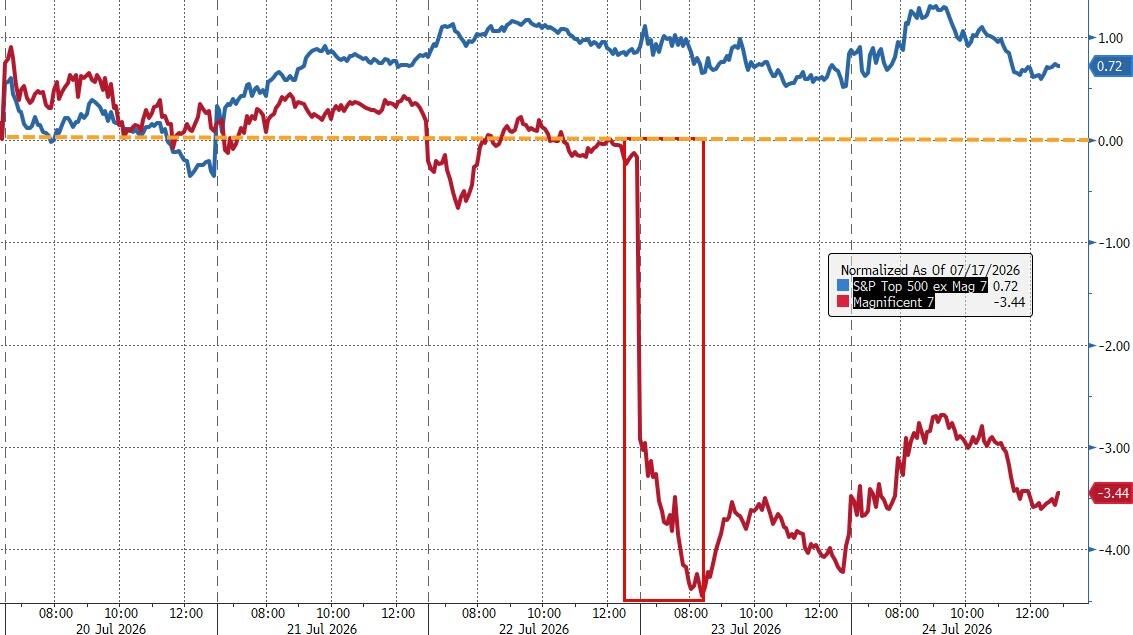
By the closing bell, even falling oil prices weren’t enough to lift the broader market. The S&P 500 and Nasdaq finished lower, while the Dow managed to hold onto a modest gain. The Mag 7 erased all their early advances, highlighting the market’s lack of conviction.
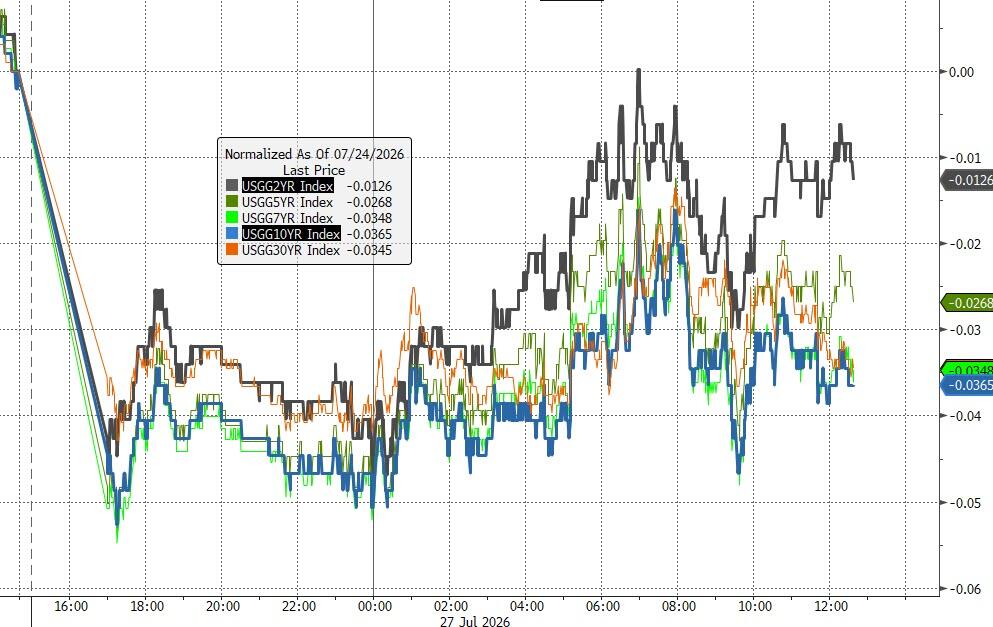
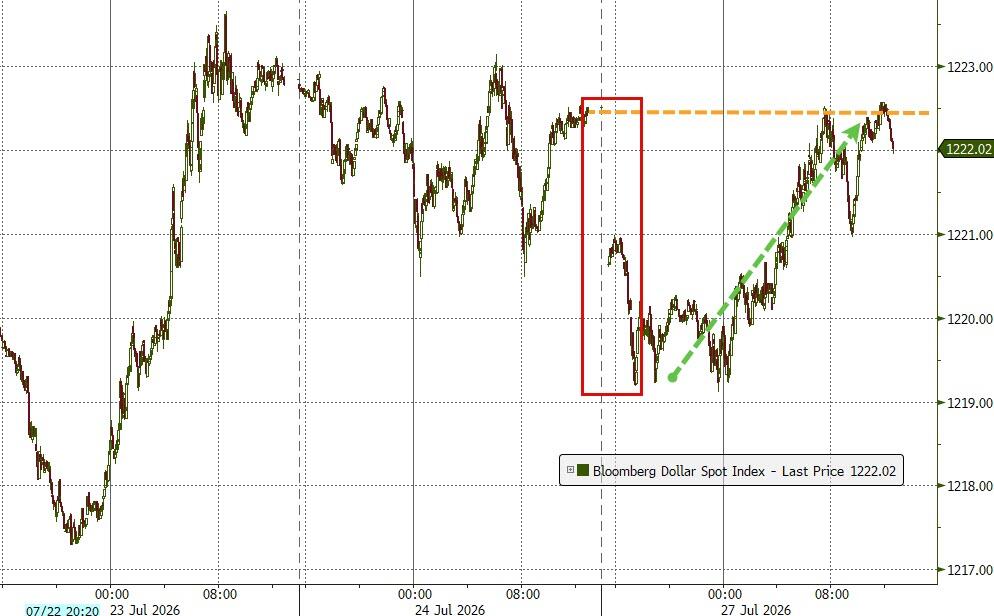
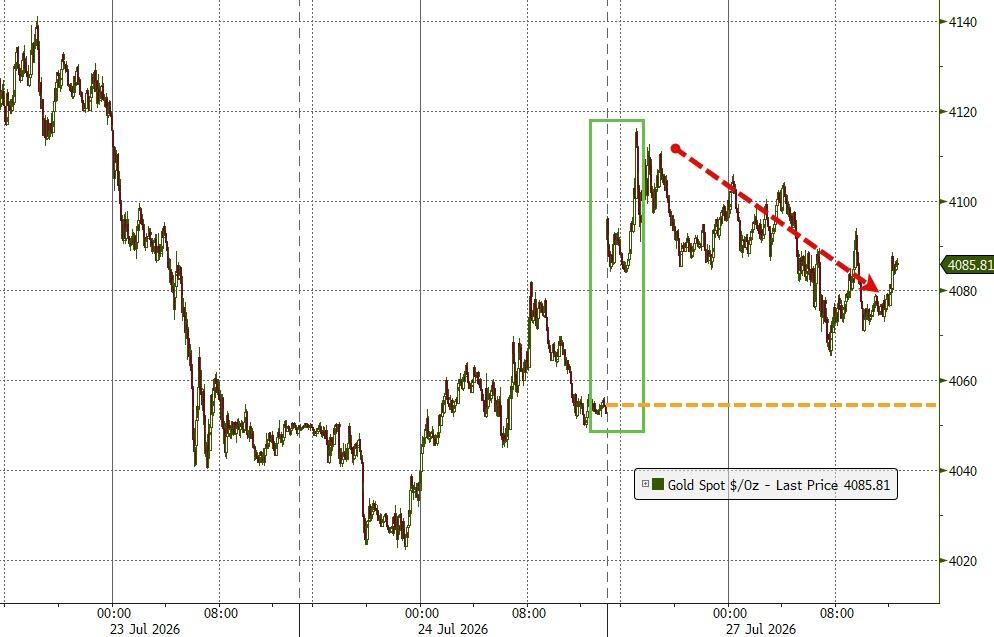
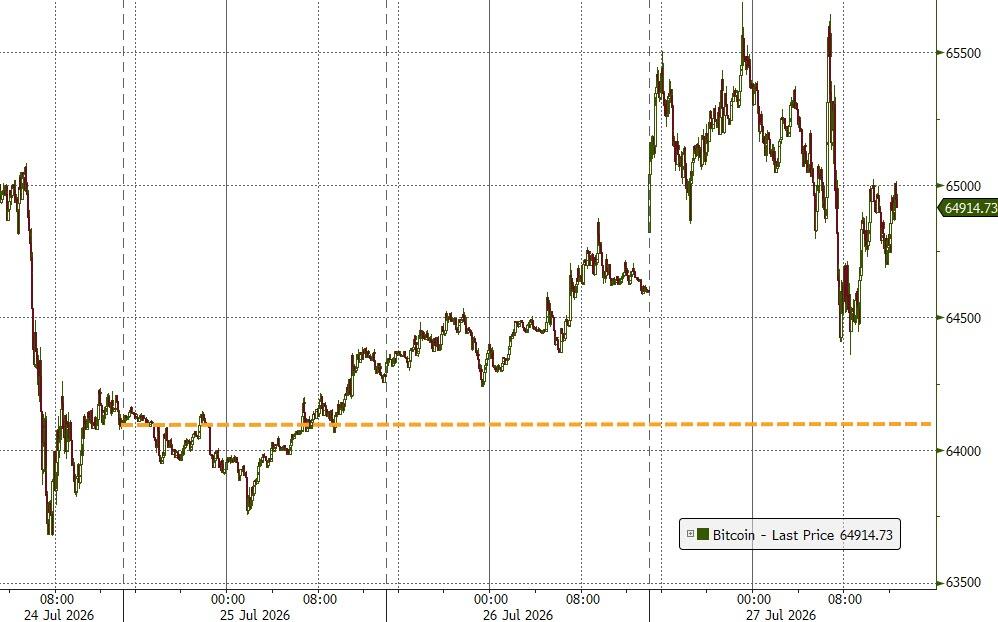
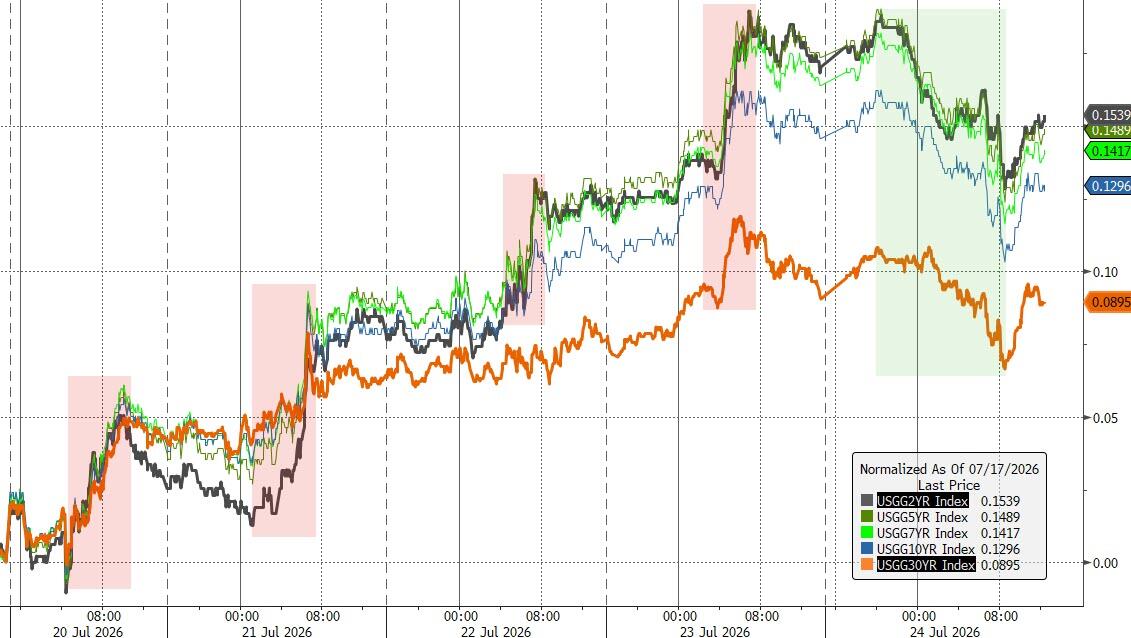
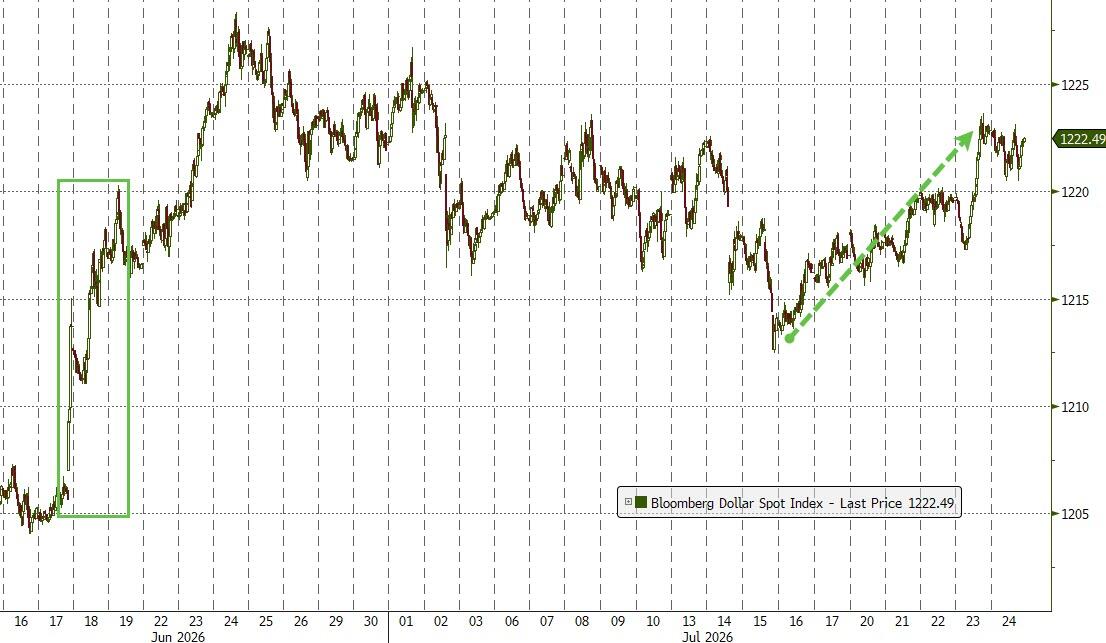
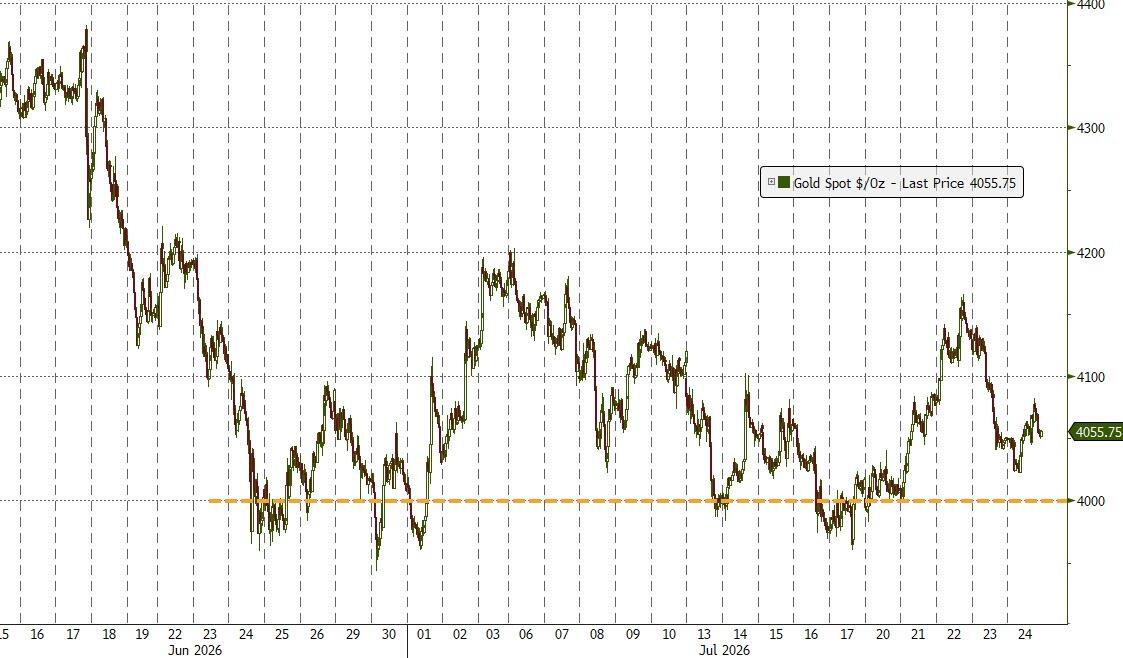
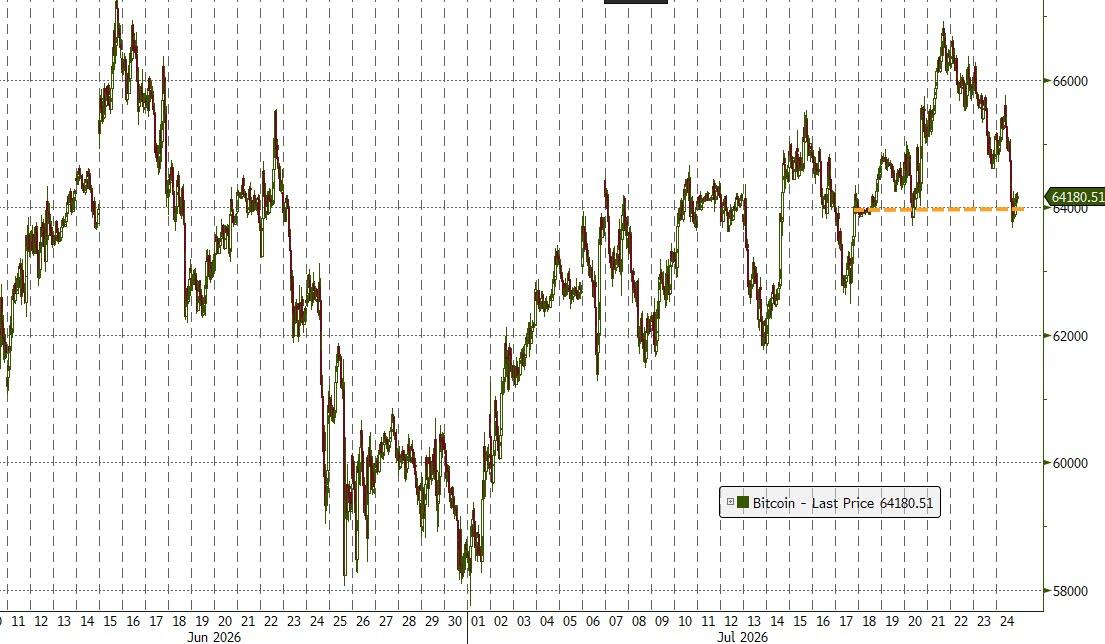
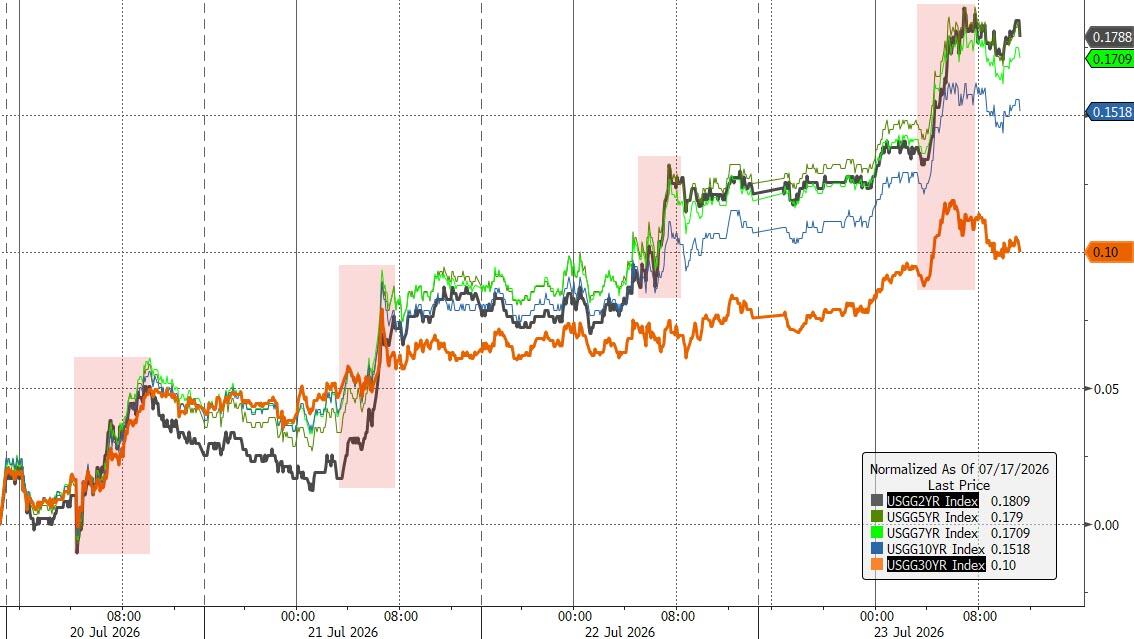
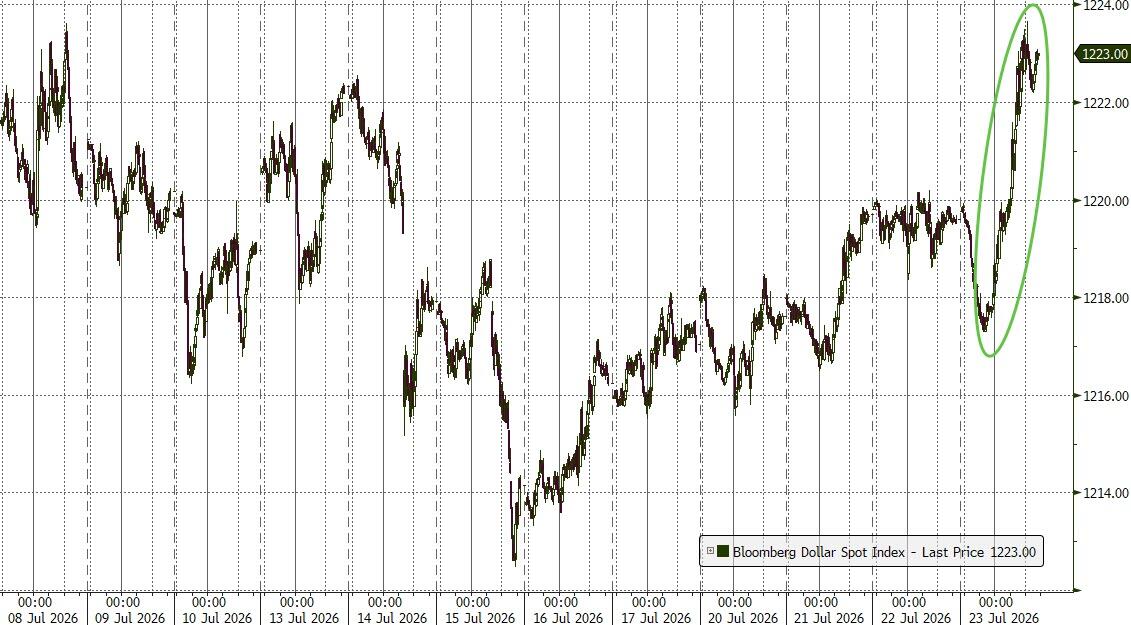
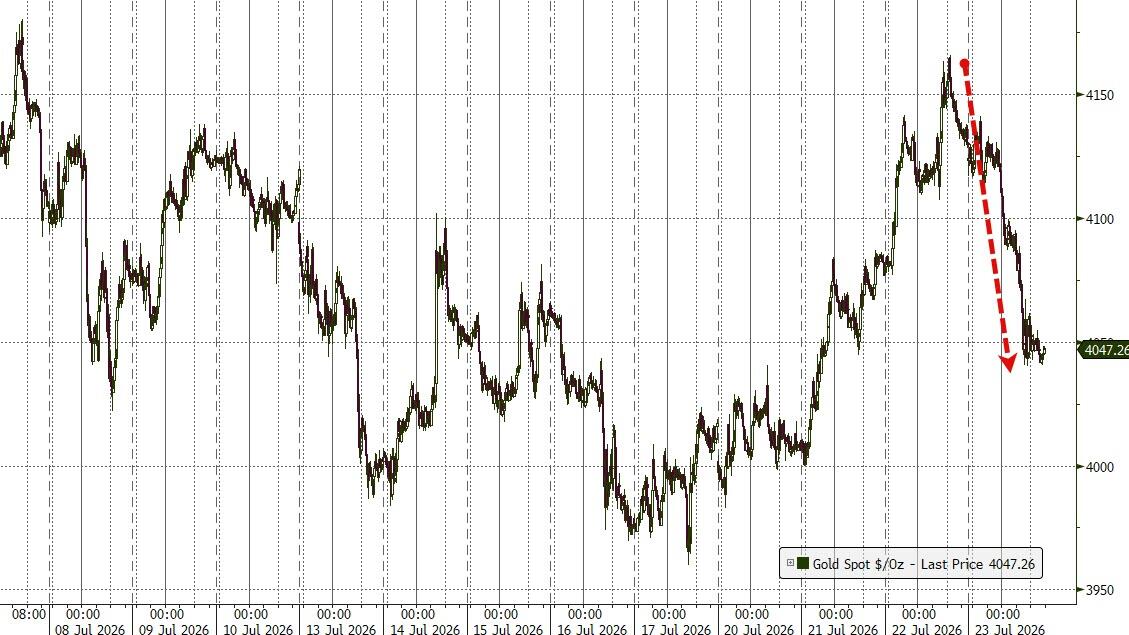
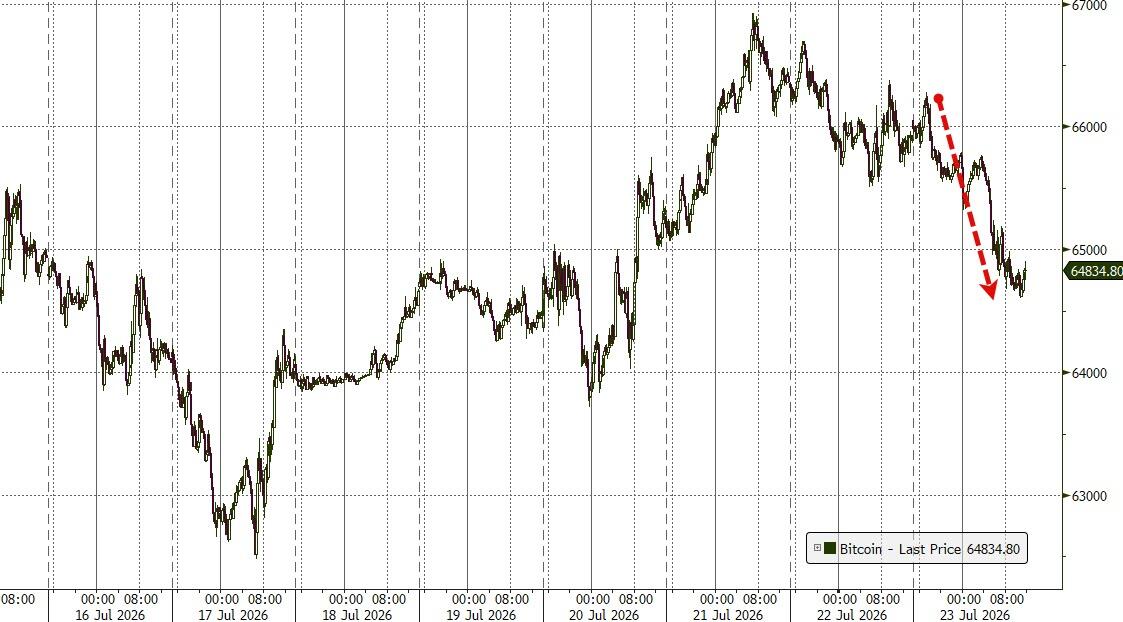
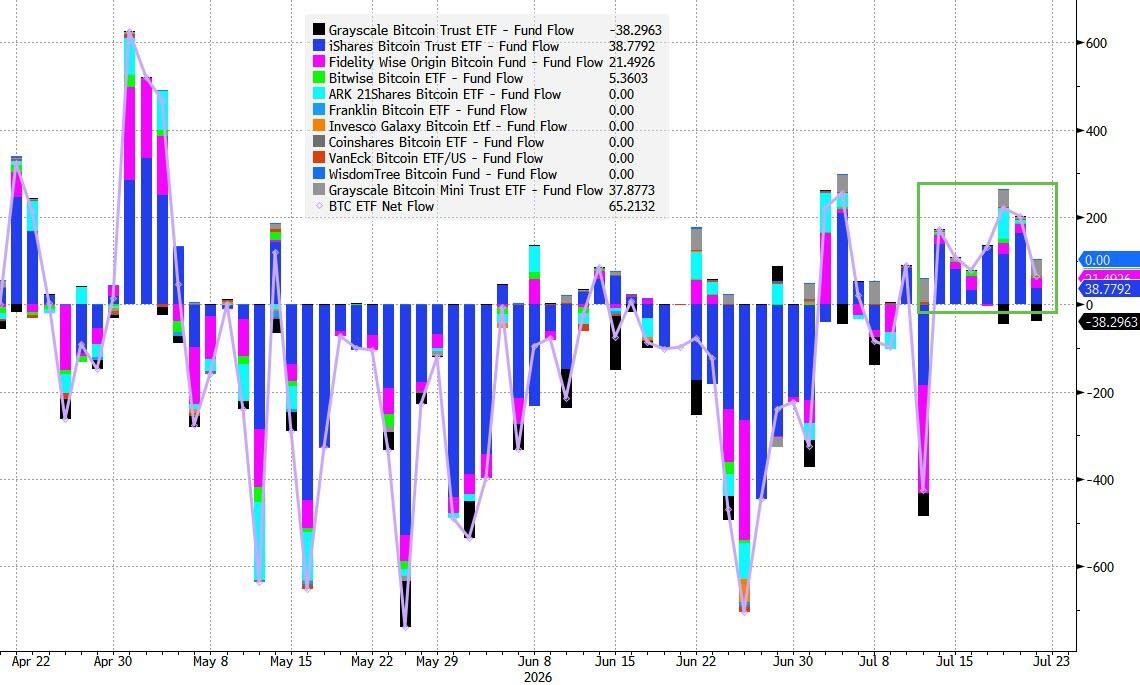
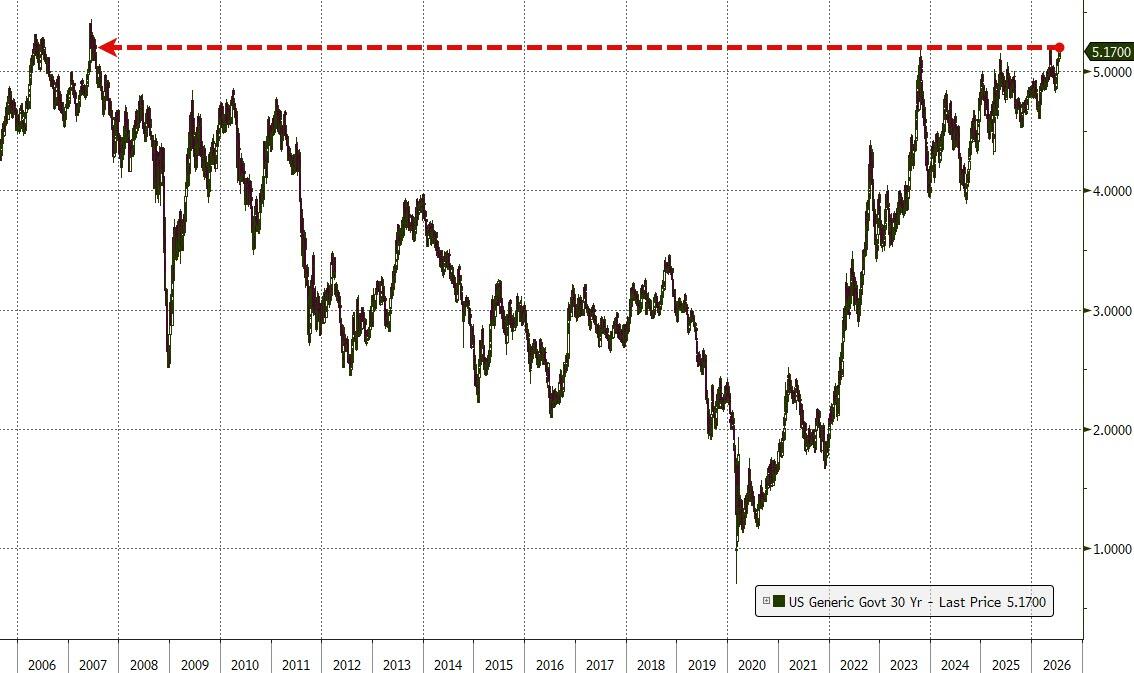
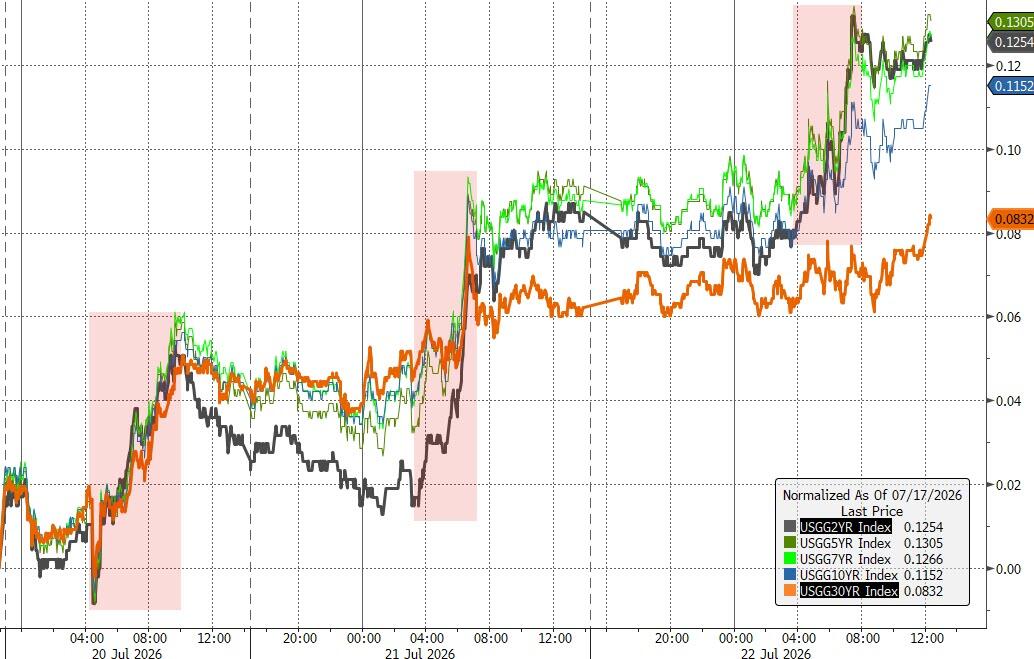
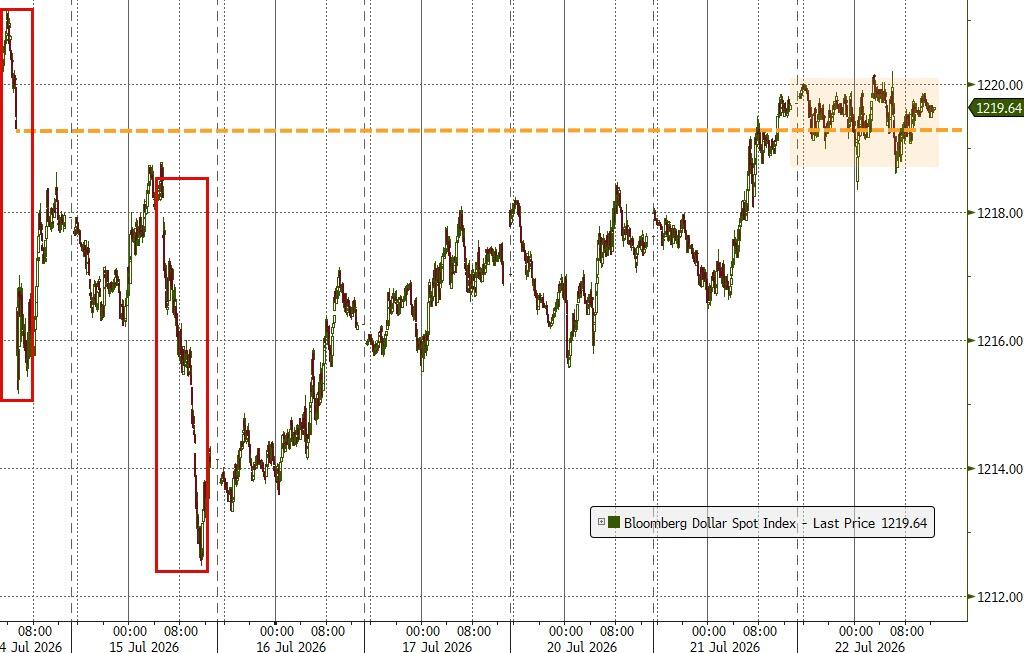
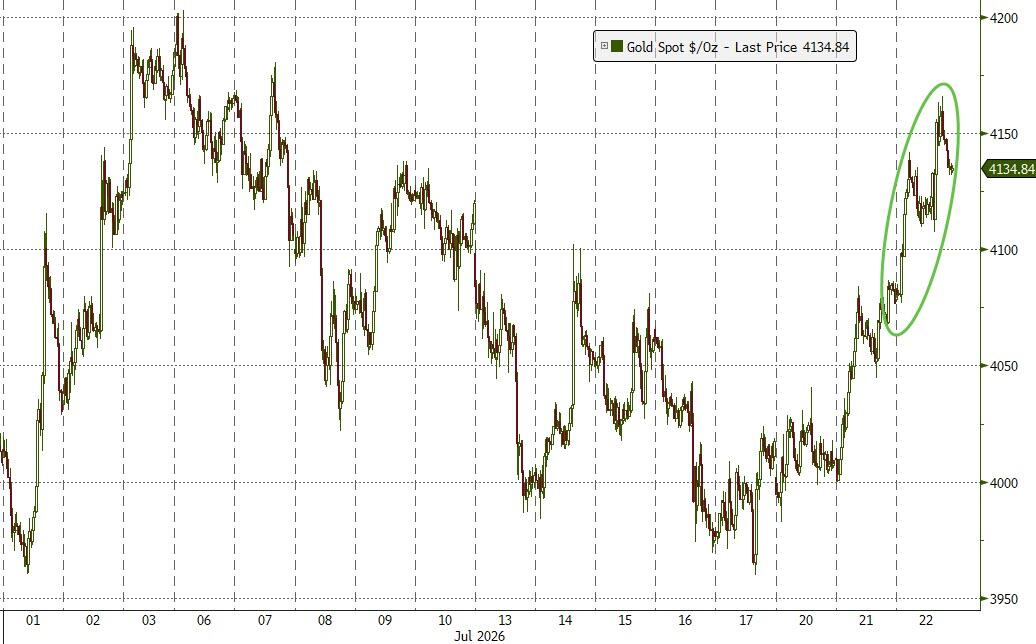
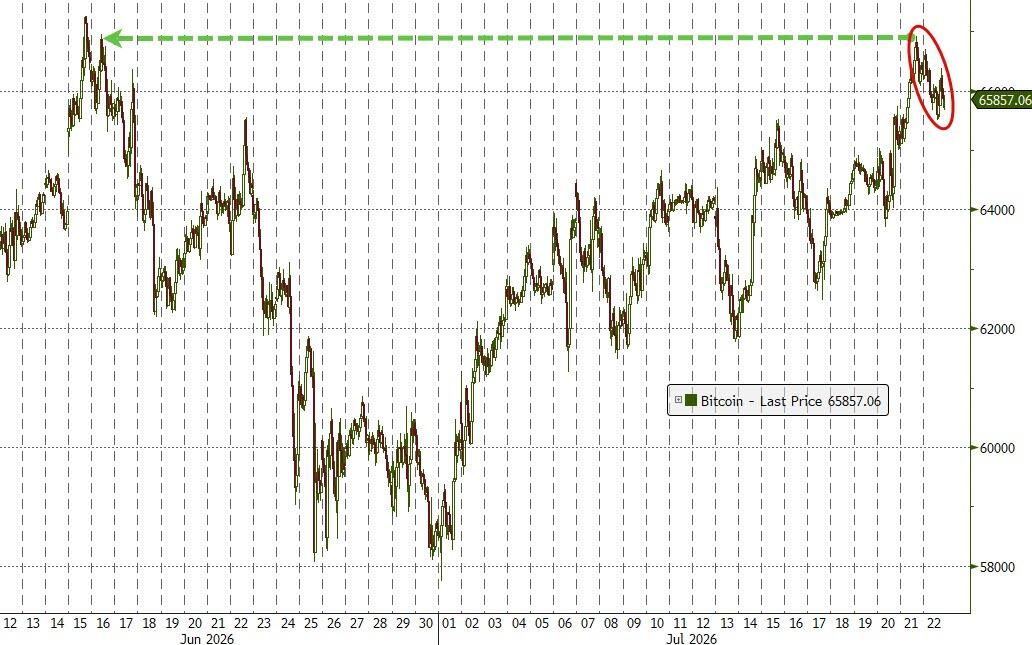
Elsewhere, bond yields moved lower, the dollar traded mostly sideways, gold rose but slipped back below the $4,100 level, and Bitcoin bounced around before finishing above Friday’s close.
For now, traders remain locked into a headline-driven market, reacting to every geopolitical development, earnings release, and Fed rumor.
With a major Fed decision and several mega-cap earnings reports just days away, will this week’s events finally provide a clear direction for the market, or simply add another layer of uncertainty?
Read More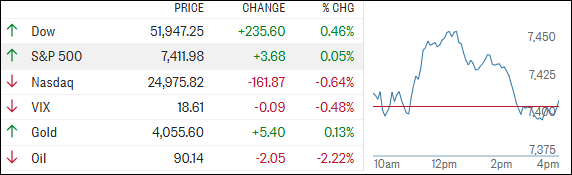
