Below, please find the latest High-Volume ETF Cutline report, which shows how far above or below their respective long-term trend lines (39-week SMA) my currently tracked ETFs are positioned.
This report covers the HV ETF Master List from Thursday’s StatSheet and includes 312 High Volume ETFs, defined as those with an average daily volume of more than $5 million, of which currently 235 (last week 227) are hovering in bullish territory. The yellow line separates those ETFs that are positioned above their trend line (%M/A) from those that have dropped below it.
In case you are not familiar with some of the terminology used in the reports, please read the Glossary of Terms. If you missed the original post about the Cutline approach, you can read it here.
Bobbing and weaving best describes today’s market action with the major indexes clinging to their respective unchanged lines. Bulls were not in a buying mood with news about economic data lacking spunk, as did the stalled negotiations about extending the coronavirus aid.
Weaker-than-expected retail sales pulled the all-important question about the economic rebound back on the front burner, but it’s all a guessing game at this point. I believe any thoughts of a V-shape recovery is merely wishful thinking and not based on reality.
The data “underscores that wary consumers have turned more cautious amid a virus resurgence and fading stimulus support,” said Lydia Boussour, senior economist at Oxford Economics. She said the data also matches up with a stall in the firm’s own recovery tracker, confirming that “consumers are likely to keep a tight rein on their spending until a medical solution to the pandemic is found.”
(source: Marketwatch)
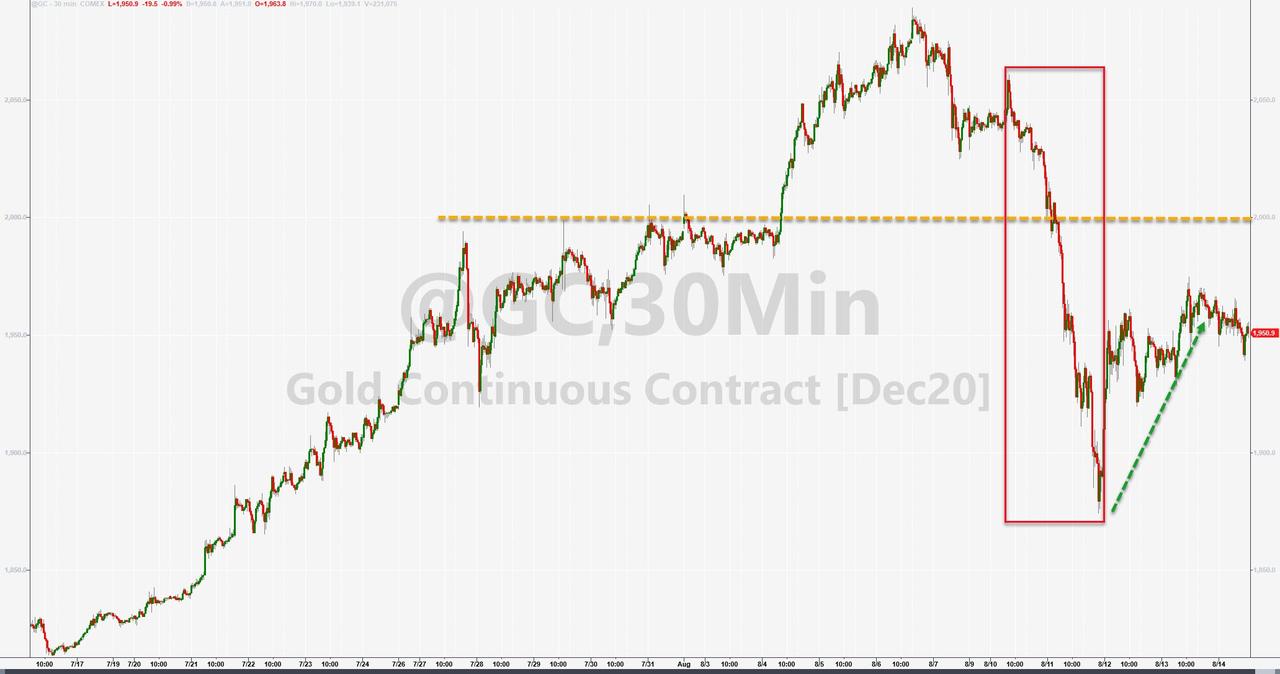
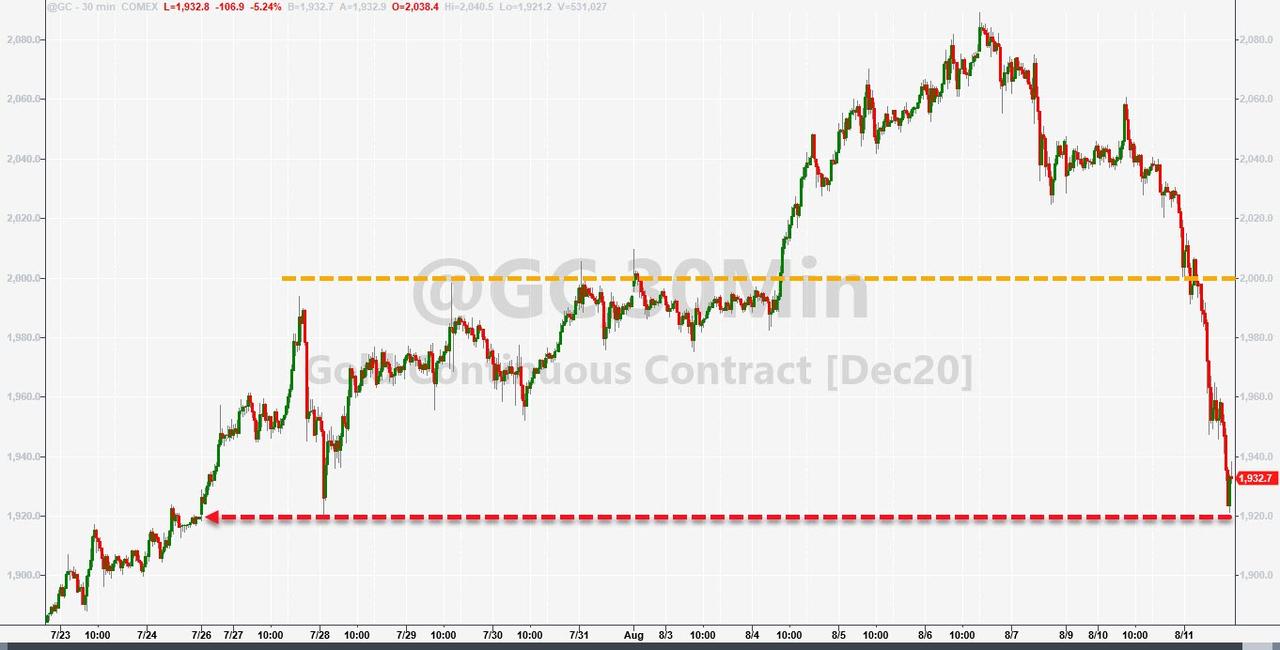
For the week, the S&P 500 eked out a meager +0.66%, while gold was not able to recoup all of its losses sustained early in the week. The precious metal ended down -4.5% breaking a nine-week winning streak.
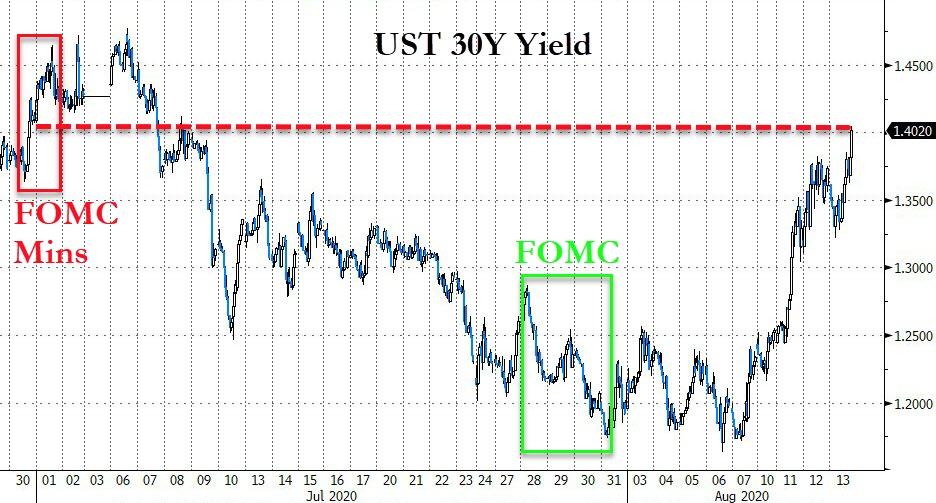
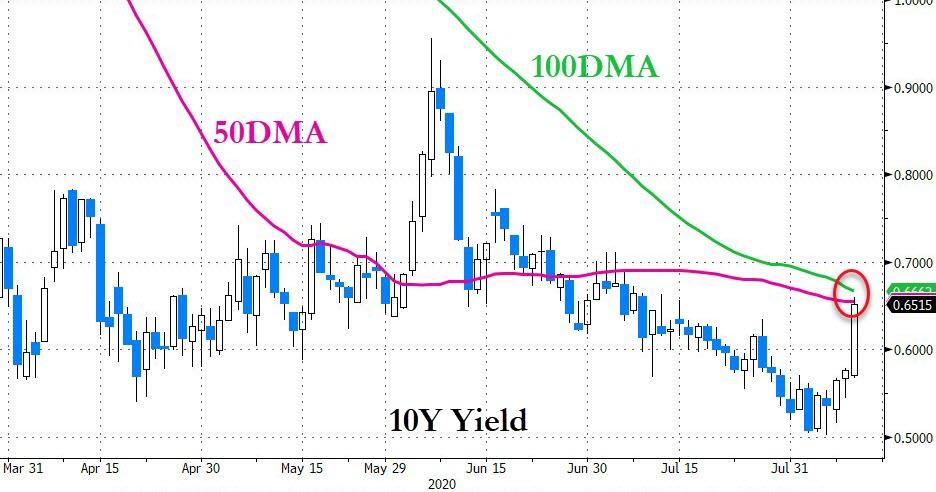
The same fate happened to bonds with Treasury yields spiking 19 basis points (30-year) this week sending prices reeling. Weakness continued in the US dollar as well, which experienced its sixth drop in the last seven weeks, according to ZH.
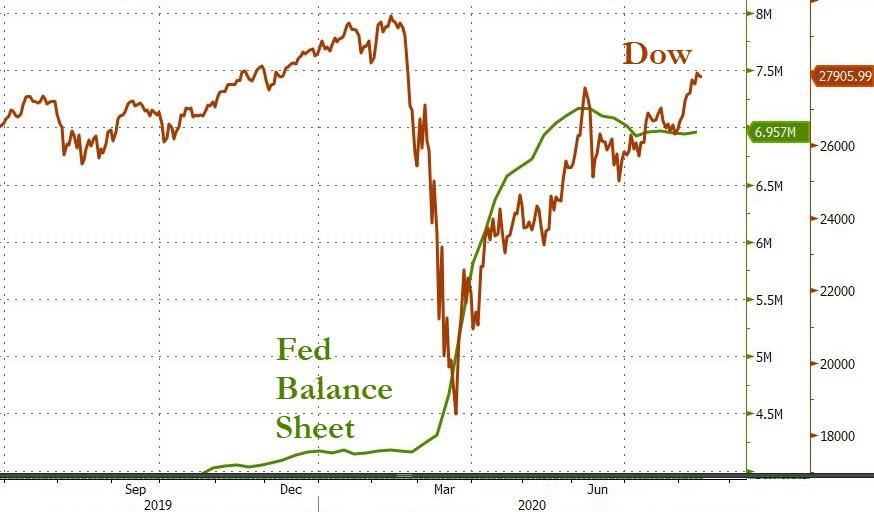
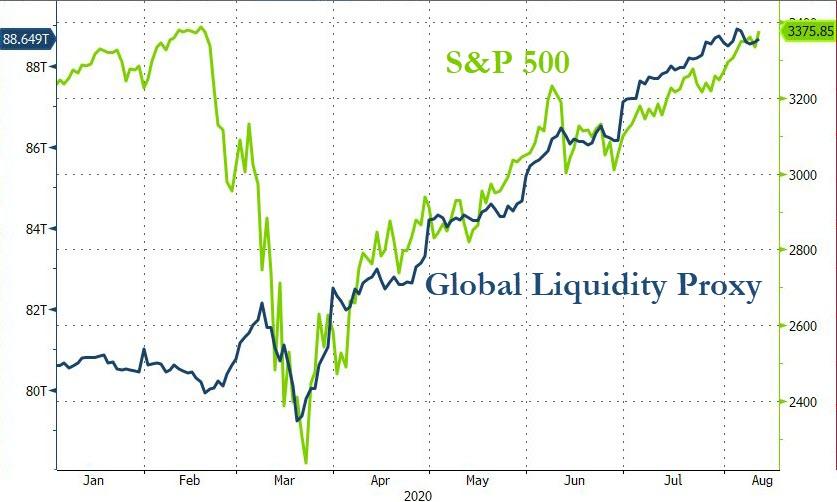
In the end, all future equity moves higher depend predominantly on the Fed’s balance sheet continuing to expand, as Bloomberg demonstrates in this chart.
ETF Data updated through Thursday, August 13, 2020
Methodology/Use of this StatSheet:
1. From the universe of over 1,800 ETFs, I have selected only those with a trading volume of over $5 million per day (HV ETFs), so that liquidity and a small bid/ask spread are assured.
2. Trend Tracking Indexes (TTIs)
Buy or Sell decisions for Domestic and International ETFs (section 1 and 2), are made based on the respective TTI and its position either above or below its long-term M/A (Moving Average). A crossing of the trend line from below accompanied by some staying power above constitutes a “Buy” signal. Conversely, a clear break below the line constitutes a “Sell” signal. Additionally, I use a 7.5% trailing stop loss on all positions in these categories to control downside risk.
3. All other investment arenas do not have a TTI and should be traded based on the position of the individual ETF relative to its own respective trend line (%M/A). That’s why those signals are referred to as a “Selective Buy.” In other words, if an ETF crosses its own trendline to the upside, a “Buy” signal is generated. Since these areas tend to be more volatile, I recommend a wider trailing sell stop of 7.5% -10% depending on your risk tolerance.
If you are unfamiliar with some of the terminology, please see Glossary of Termsand new subscriber information in section 9.
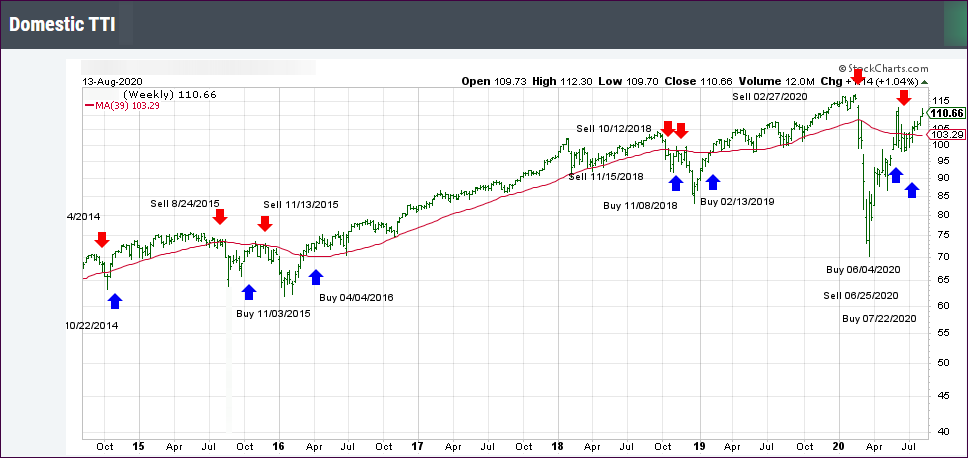
1. DOMESTIC EQUITY ETFs: BUY— since 07/22/2020
Click on chart to enlarge
Our main directional indicator, the Domestic Trend Tracking Index (TTI-green line in the above chart) has now rallied above its long-term trend line (red) by +7.14% and remains in “BUY” mode as posted.
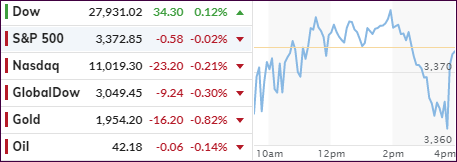
While the Dow never managed to climb above its unchanged line, the S&P 500 showed some promising early gains, only to give them back late in the session. However, the Nasdaq resisted red numbers and closed in the green, along with GLD, which added a solid +2.36% for the session.
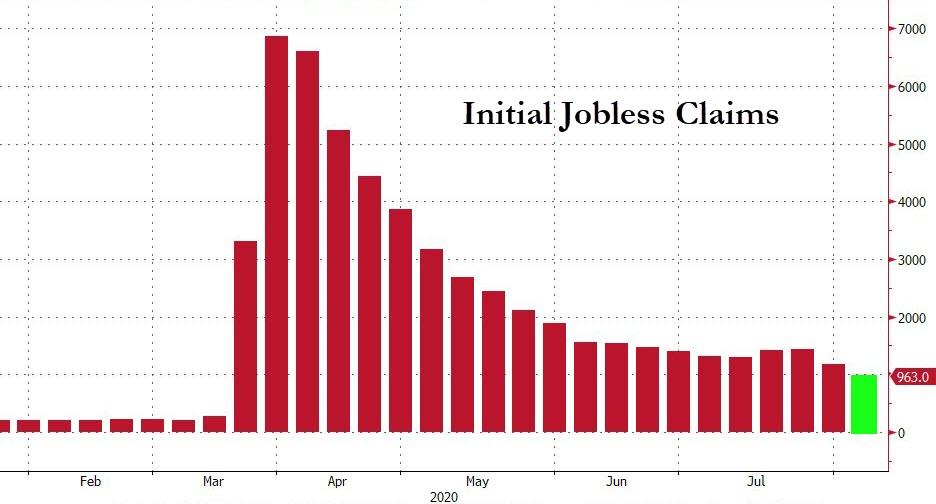
The latest jobs numbers showed initial claims falling below 1 million for the first time in 21 weeks, but still came in at a horrific 963k vs. 1.1 million expected.
Added ZH:
A total of 56.29 million Americans have now applied for jobless benefits for the first time since the pandemic lockdowns began (that’s over 360 layoffs for every COVID death in America), and massively more than the 22.1 million during the great financial crisis.
However, Despite today’s relatively positive news (yes 963,000 Americans still filed for first time benefits), following President Trump’s EOs, leaving the latest round of virus relief continuing to be stuck in gridlock, we suspect things will get depressingly worse before they get better.
That looks to be a possibility, as the ongoing impasse over Covid-19 relief is likely to drag into September with most lawmakers having retreated to their home states. In other words, we’ll have to wait for the next jawboning event.
This lack of action is what keeps the markets bouncing around with the S&P 500 continuing to sniff at its all-time high but falling short of closing above it.
Not helping sentiment at all was the 30-year Treasury auction, which bombed, as yields spiked to a level last seen early July and thereby taking the steam out of the early equity rally. It was an oddity to see bonds down and gold up, since both usually run in tandem.
Oh well, I sure don’t mind seeing gold to be the winner in this battle.
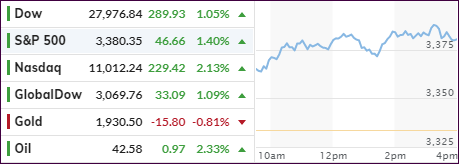
Yesterday’s sell-off now appears in the rear-view mirror as a vanishing object, as the major indexes stormed back and ended solidly in the green. The S&P 500 closed just shy of a new record, although it broke the old high set on February 19 on an intra-day basis.
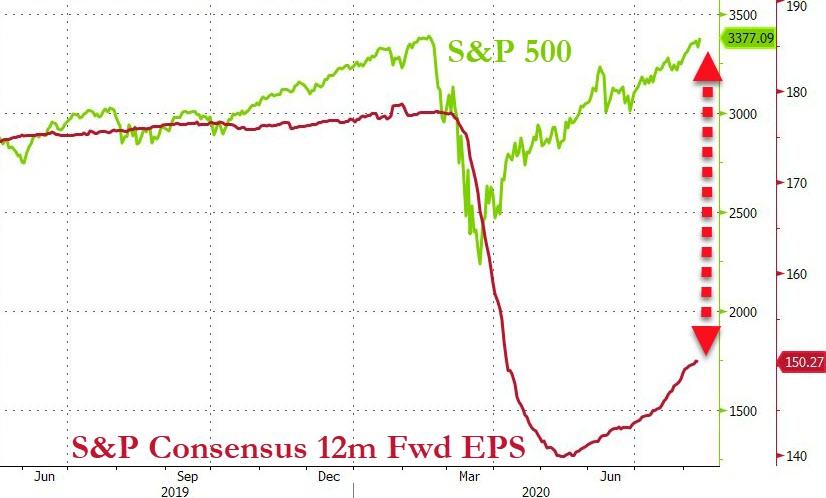
Surely, the move was not based on fundamentals, which are way out of whack, as Bloomberg demonstrates here, while explaining the real reason in this chart. Of course, for readers of this blog, this is nothing new but merely a refresher.
Gold lagged the entire session, thanks to higher bond yields, and pulled back into close to end the day in the red. Reviewing yesterday’s performance, and the importance of gold in the bigger picture, was Rabobank’s Michael Every:
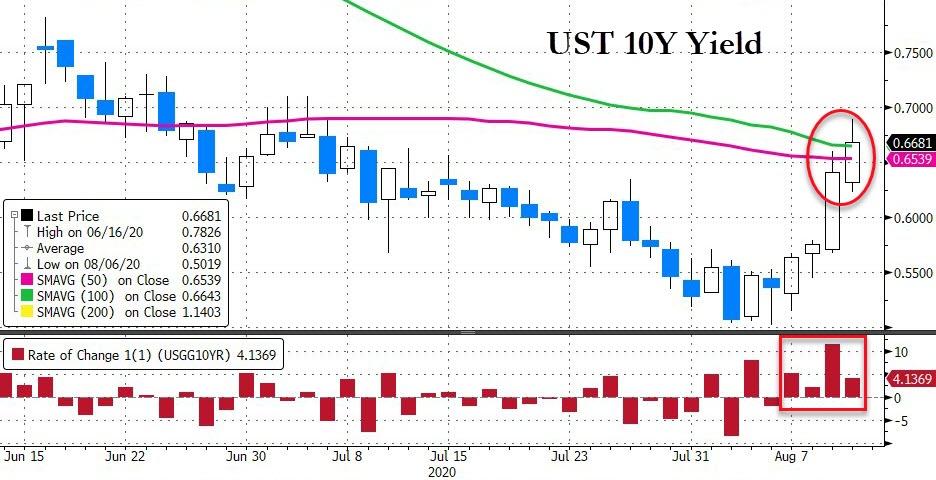
Meanwhile, markets did wobble yesterday for entirely different reasons, with one of the key ones being that 10-year US Treasuries are now back up to 0.65%, which makes holding everything else that much less attractive. Including gold, which was supposed to be showing us that inflation was everywhere ahead (not just in assets) and that the USD was over. Yes, being below $1,900 and not above $2,000 is just a small detail in a far bigger picture, but it does underline that nothing is rock solid day-to-day – even metal.
That the precious metal will have a great future was further underscored today, as news that the Budget Deficit has hit a record caused ZH to comment:
On a YTD basis, 10 months into the 2020 fiscal year, the US has spent $5.631 trillion and collected just $2.824 trillion, which means that YTD outlays are a record 100% higher than receipts, which also includes the $8.3BN received last month and $63.4BN YTD in deposits of earnings by the Fed.
Ouch! And considering that this trend will not end soon, gold remains an important component in everyone’s portfolio, but it also means that sharp corrections will be inevitable.
Author and gold bug Peter Schiff saw yesterday’s sell-off this way:
What the market is doing is trying to flush out the weaker players. When it comes to a bear market, it’s trying to create some hope and sucker people back into the market by having a really big rally. Well, in a bull market it’s the opposite. The market is trying to instill fear in the weaker hands, so you get these spectacular one-day moves in the opposite direction of the primary trend to shake people out, to get the weaker players out of the market so you can clear away the excess baggage and then continue the trend.
In the meantime, equities remain in bullish mode, despite the Washington stalemate about a new coronavirus package with legal challenges about Trump’s executive orders to extend spending measures waiting on deck.
For sure, it was a market where anything was possible. The Dow reigned supreme for most of the day, with a 300-point advance at one point, while the S&P 500 cruised slightly above its unchanged line. Gold and the tech sector plunged, with especially the former getting hurt by rising yields as bond prices crumbled but reversed a bit late in the session.
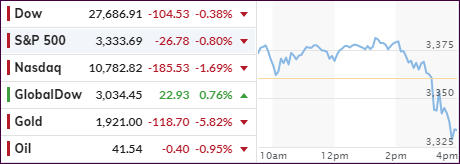
Things changed in the afternoon when all rebound efforts failed and the major indexes, including the Dow, went into swan dive mode and headed sharply south.
Traders were not sure about the outlook for the economy, despite slowing new coronavirus cases. However, the lack of progress in Washington toward additional aid soured the mood, and down we went.
Of course, after the sizzling ramp in gold and tech over the past weeks, a pause was to be expected. It remains to be seen whether today was just an outlier, or the beginning of more liquidation, as all asset classes puked in sync.
Quipped ZH:
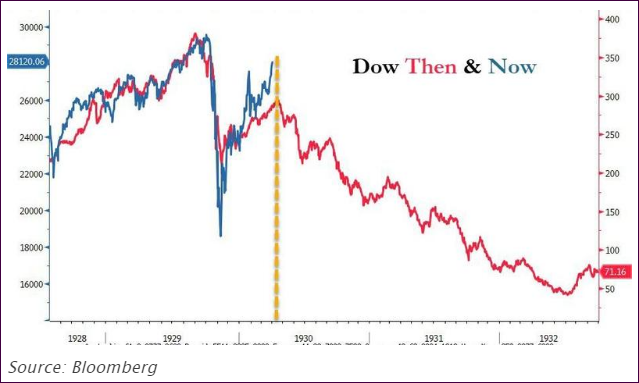
And one wonders if the ‘dead cat bounce’ is over (if nothing else, today’s reversal is interestingly timed):
We will find out soon enough how this analog to the 1930s plays out. Just in case, have an exit strategy in place.


