
- Moving the market
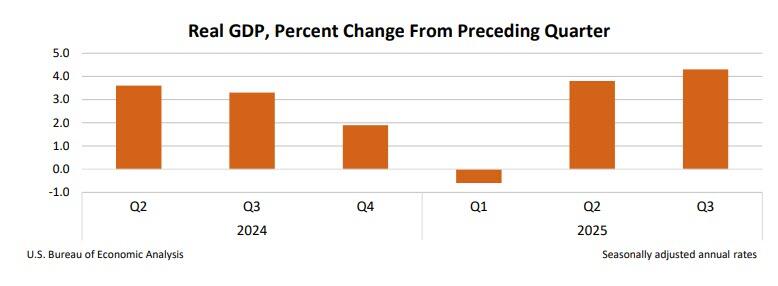
The day started a little wobbly—delayed Q3 GDP data finally dropped and came in hot at 4.3% (way above the 3.2% guess).
That had everyone pausing to wonder if the Fed might slow-walk those early-2026 rate cuts. Futures traders nudged up the odds of steady rates in January and March a touch, but they’re still betting on two cuts by year-end.
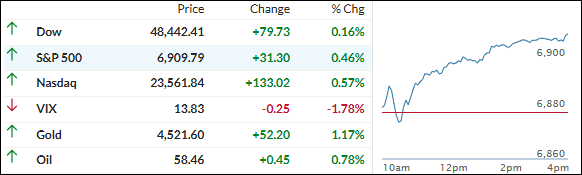
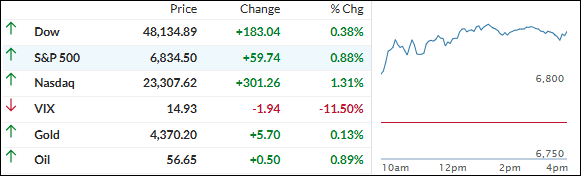
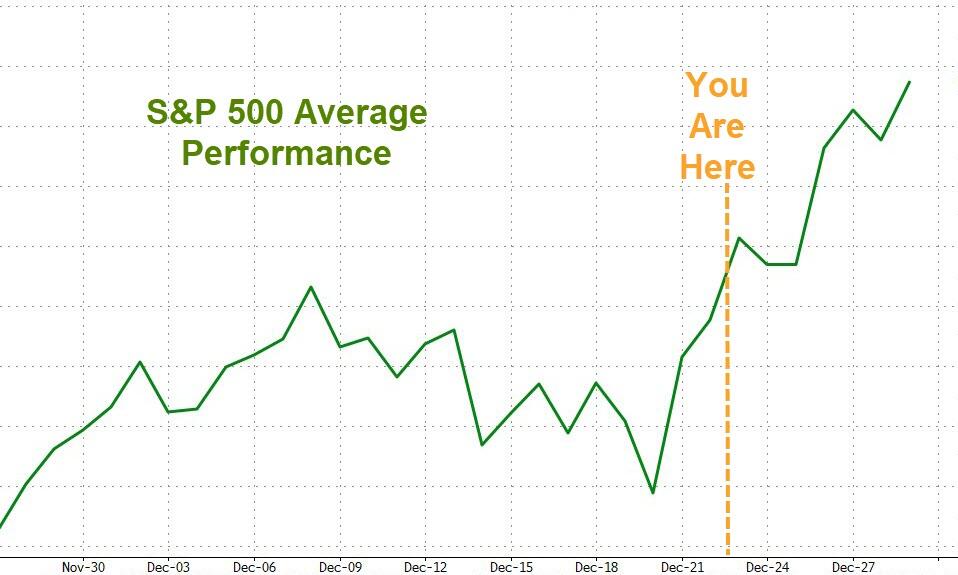
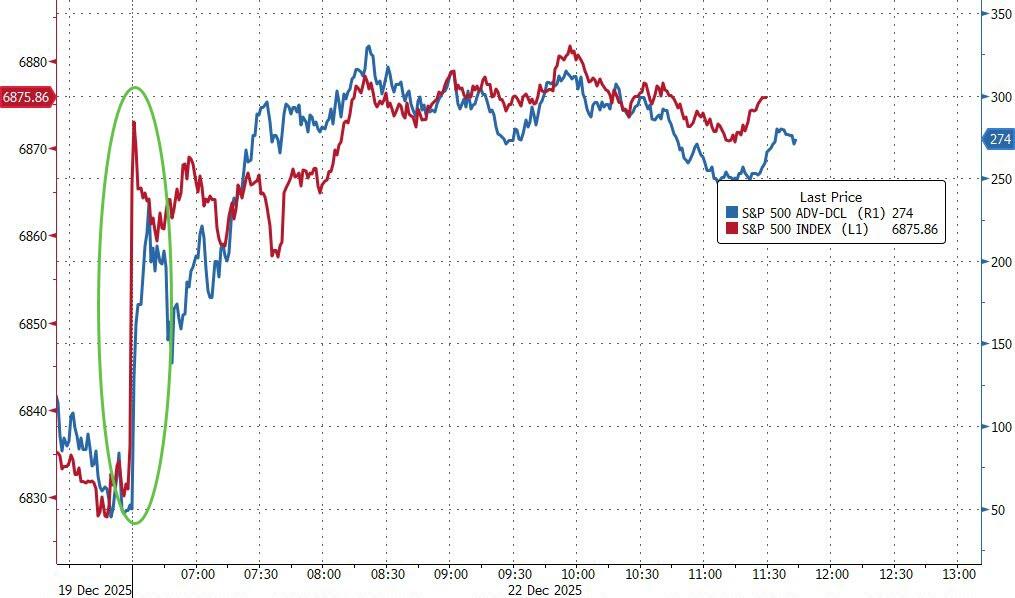
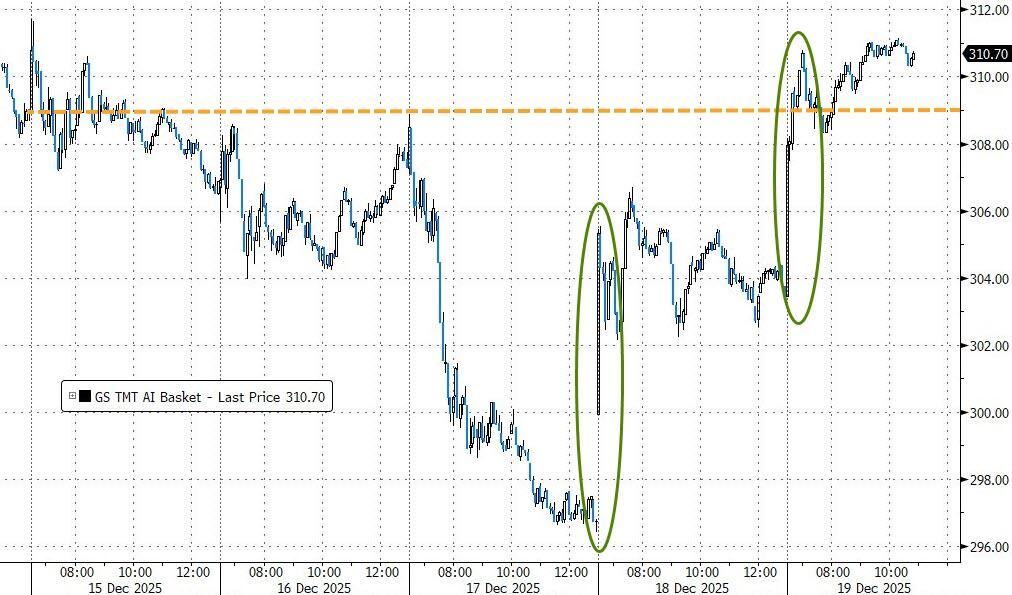
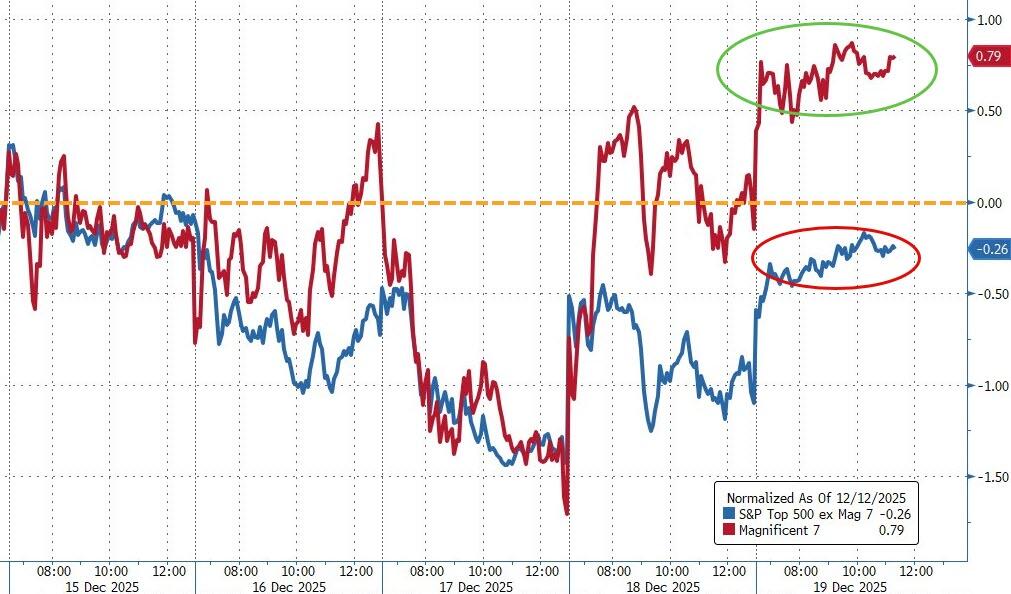
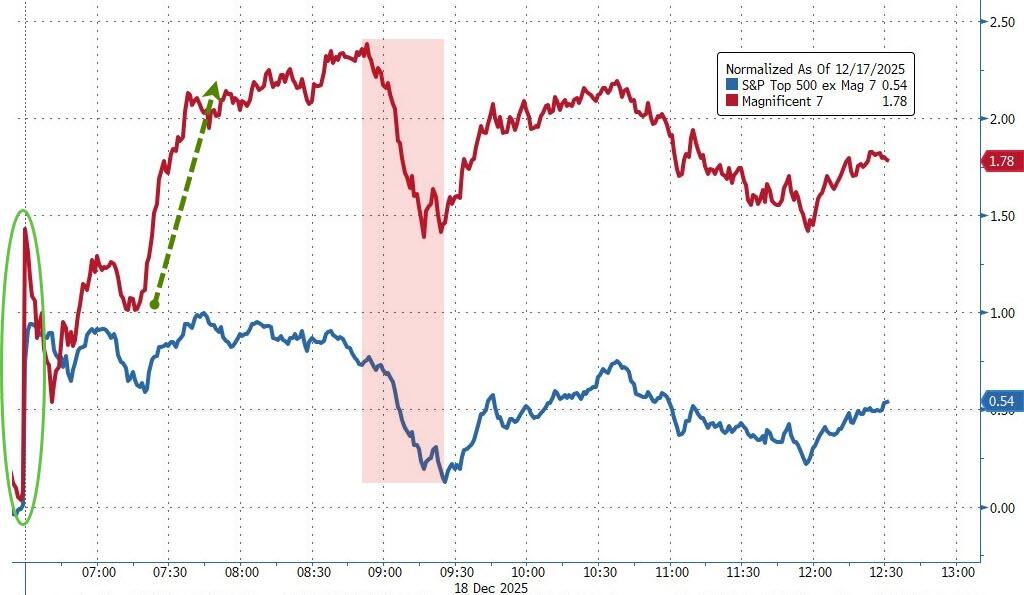
Early nerves turned into afternoon buying, though. The indexes shook off the slump, with the Nasdaq leading the charge. The S&P 500 hit a fresh record high, and all the majors locked in their fourth straight green day. Nice way to head into the holidays.
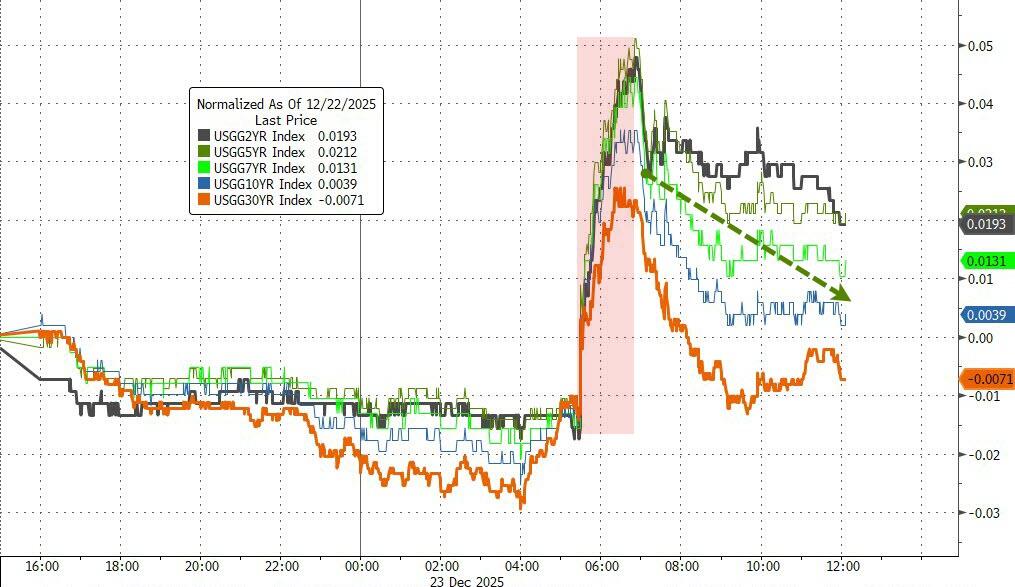
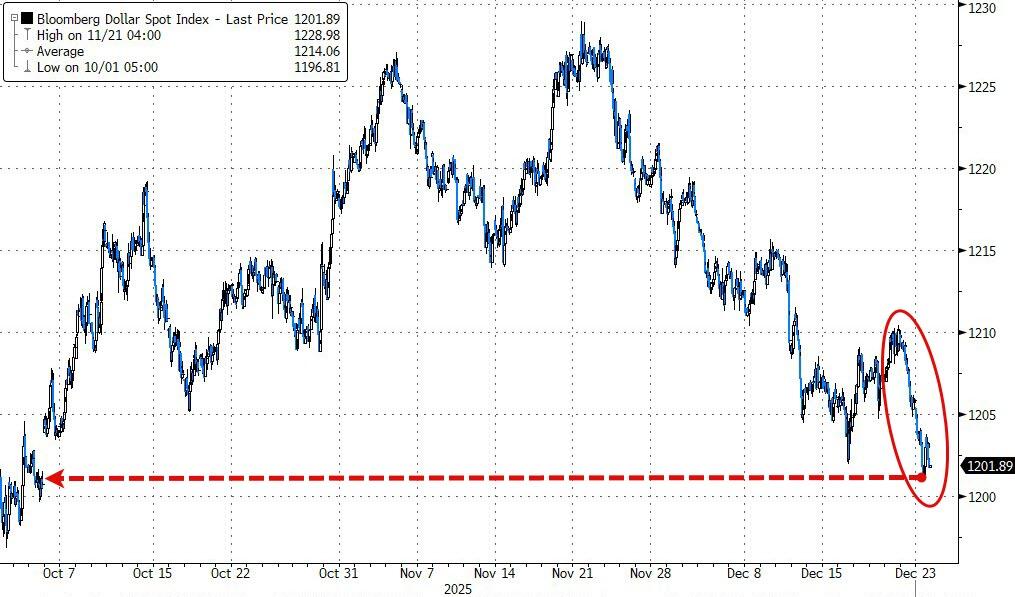
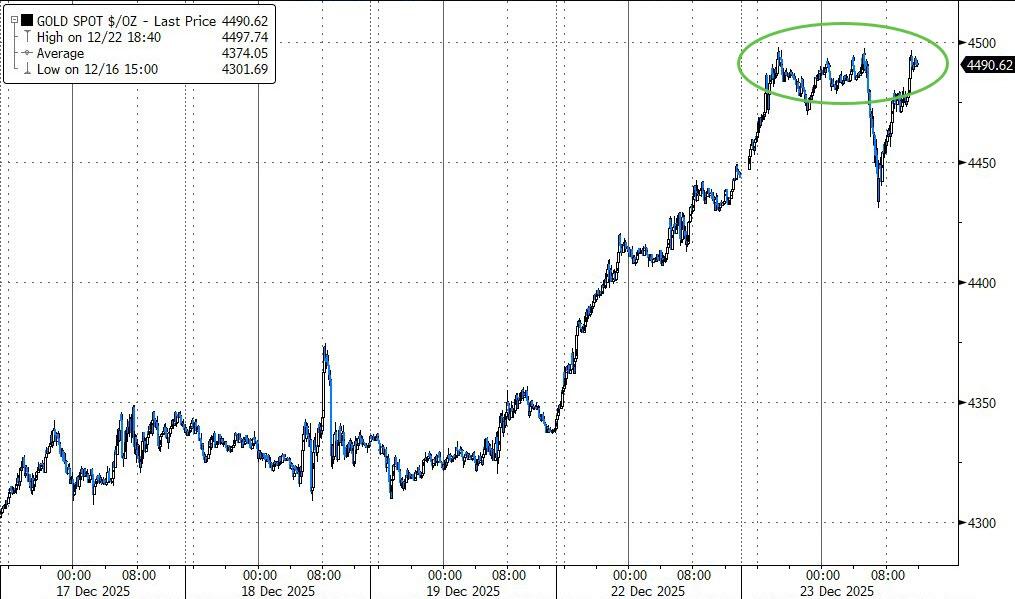
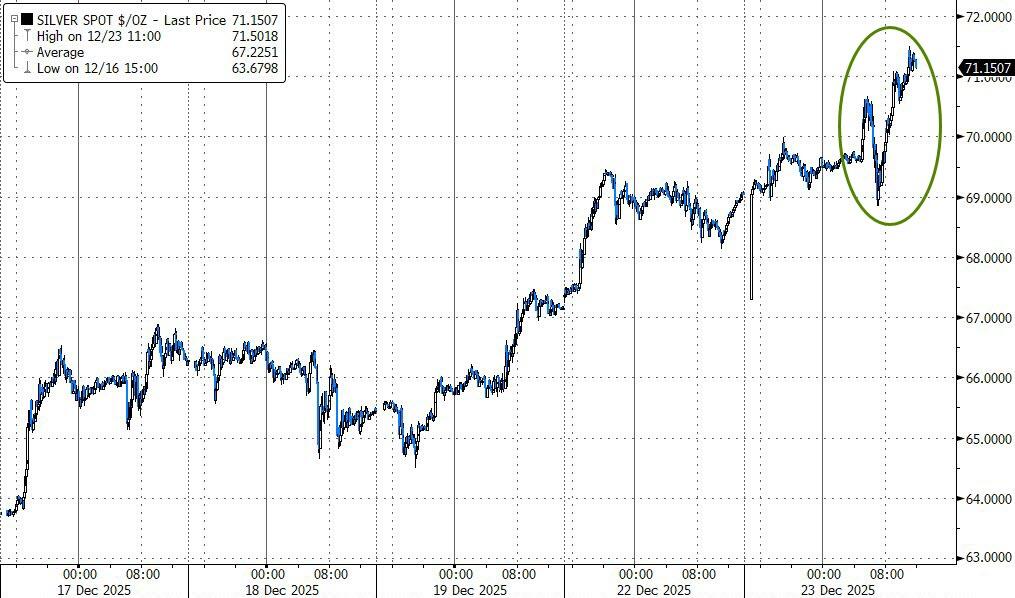
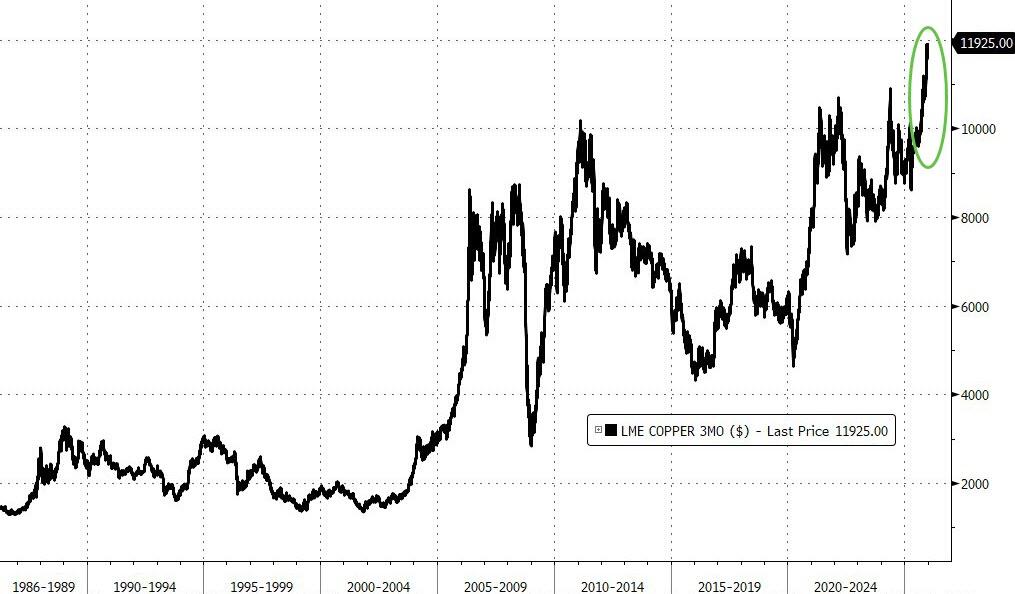
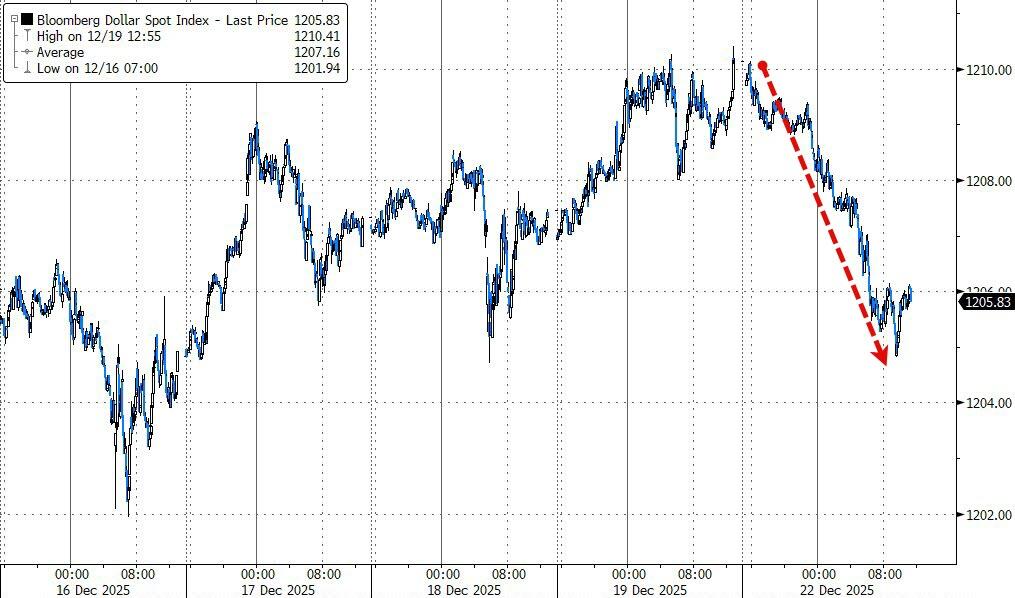
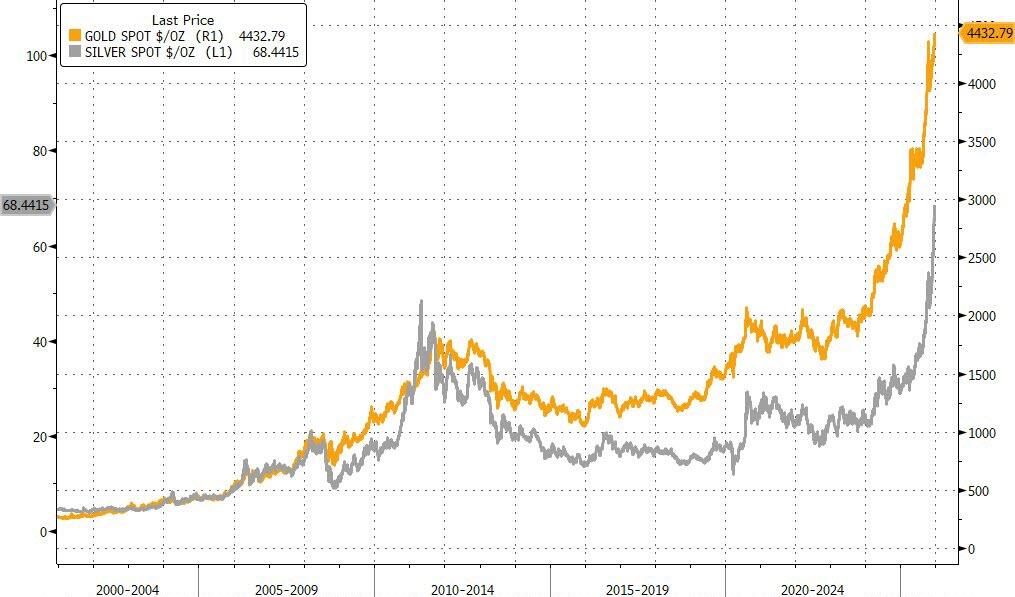
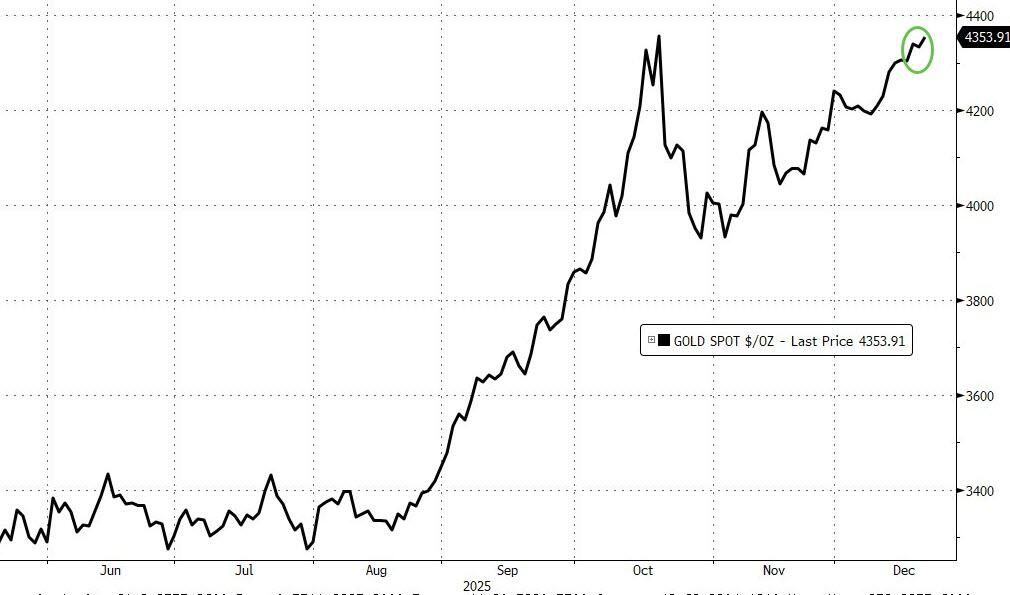
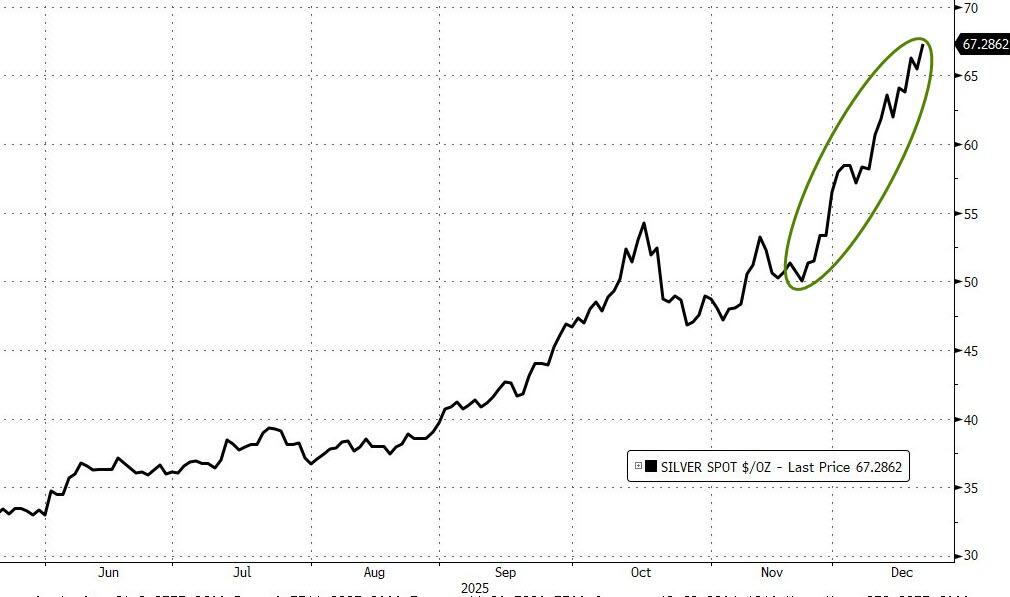
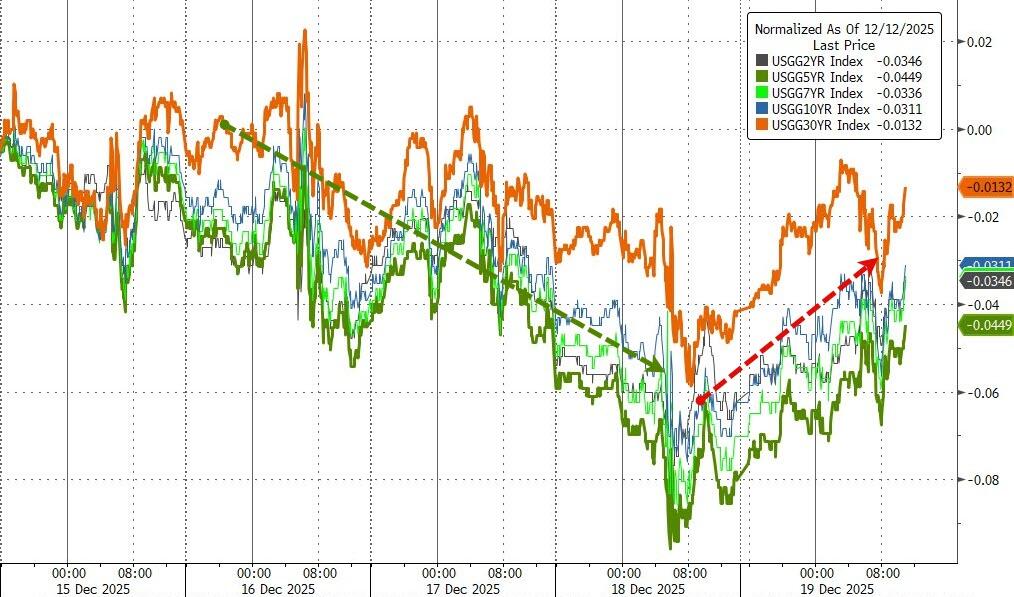
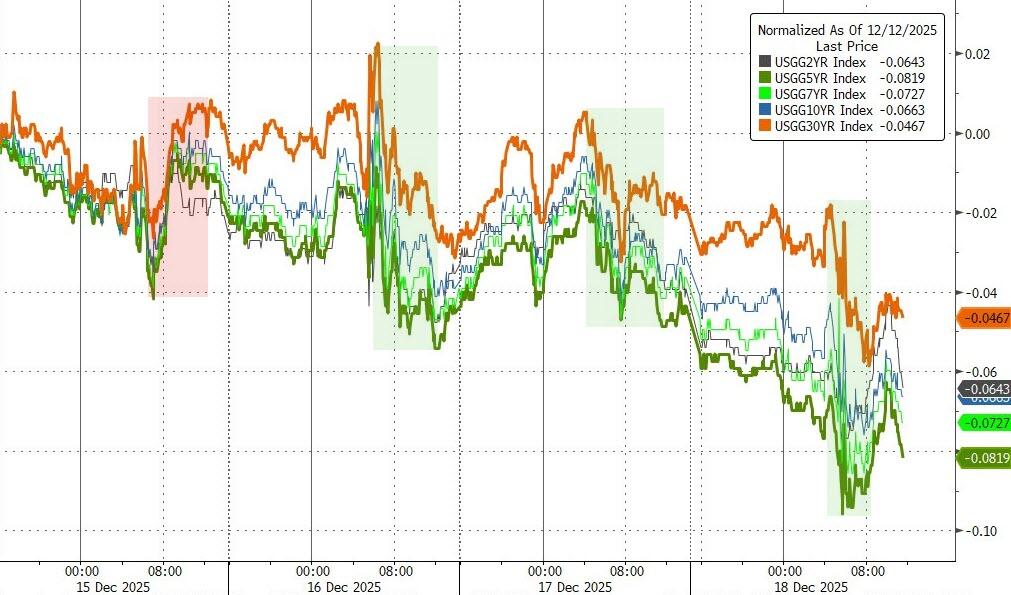
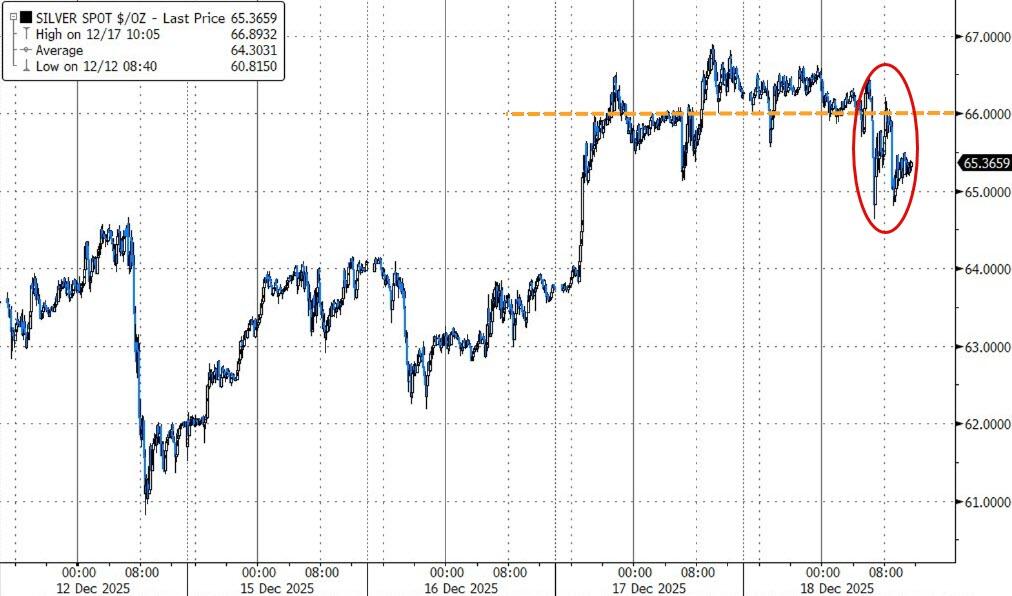
Bond yields crept higher (but backed off the peaks), the dollar sank to October lows, and that was rocket fuel for metals:
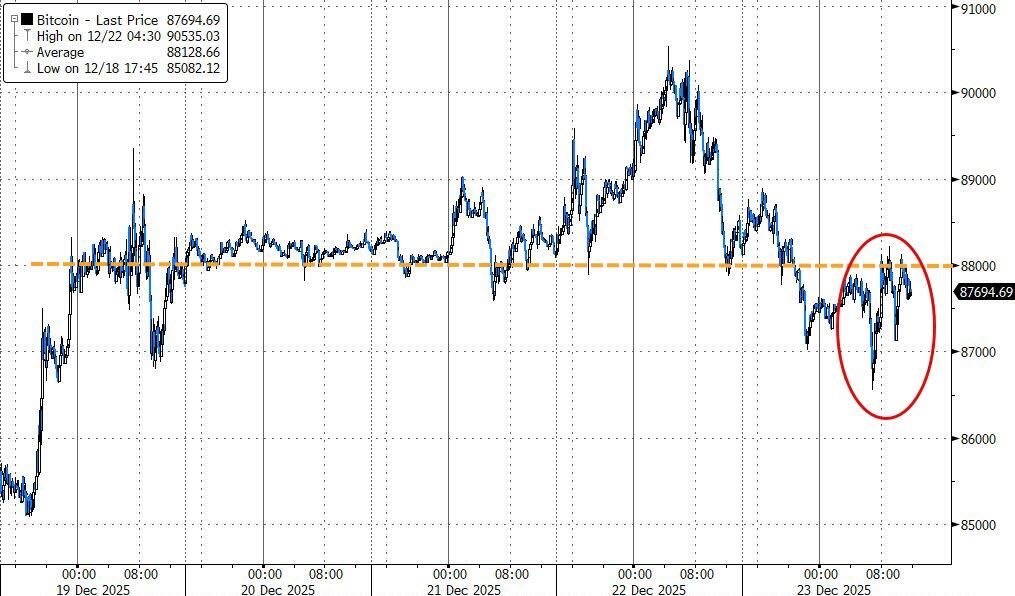
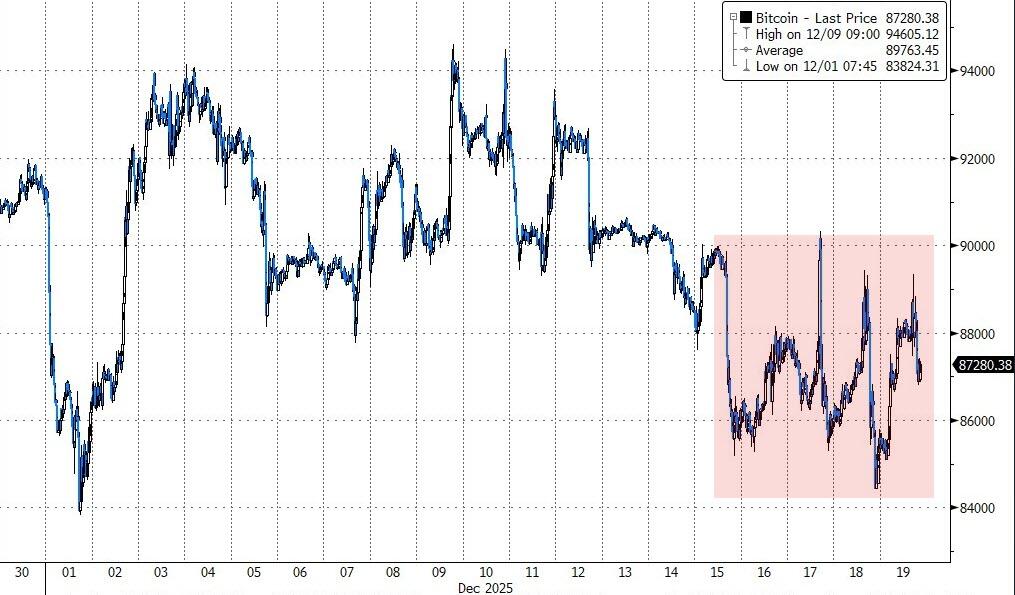
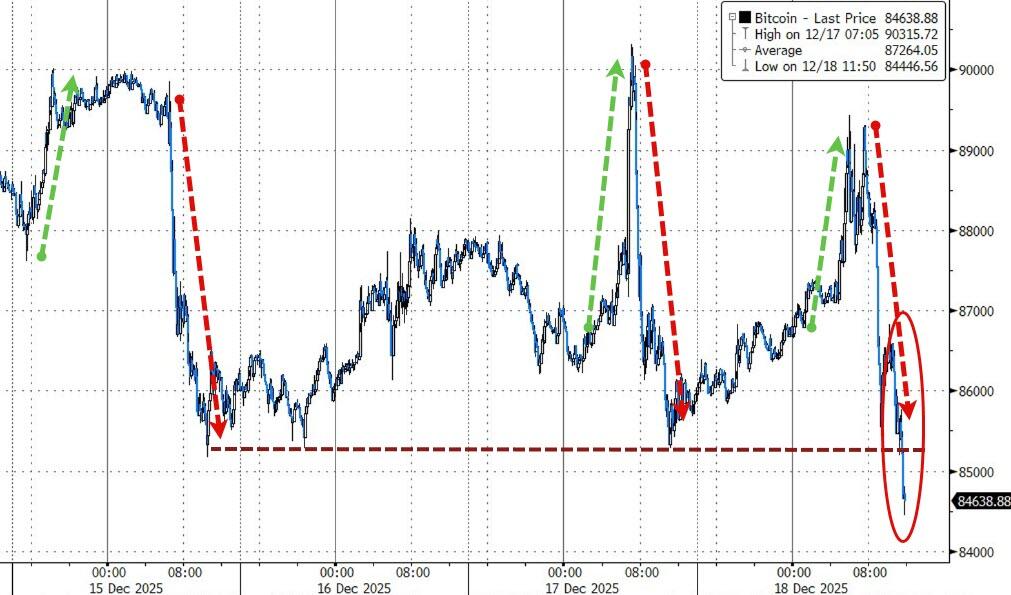
Gold got within a whisker of $4,500, silver blasted through $71 (though it stopped shy of $72), and copper punched another record high. Bitcoin lagged a bit and couldn’t crack $88K.
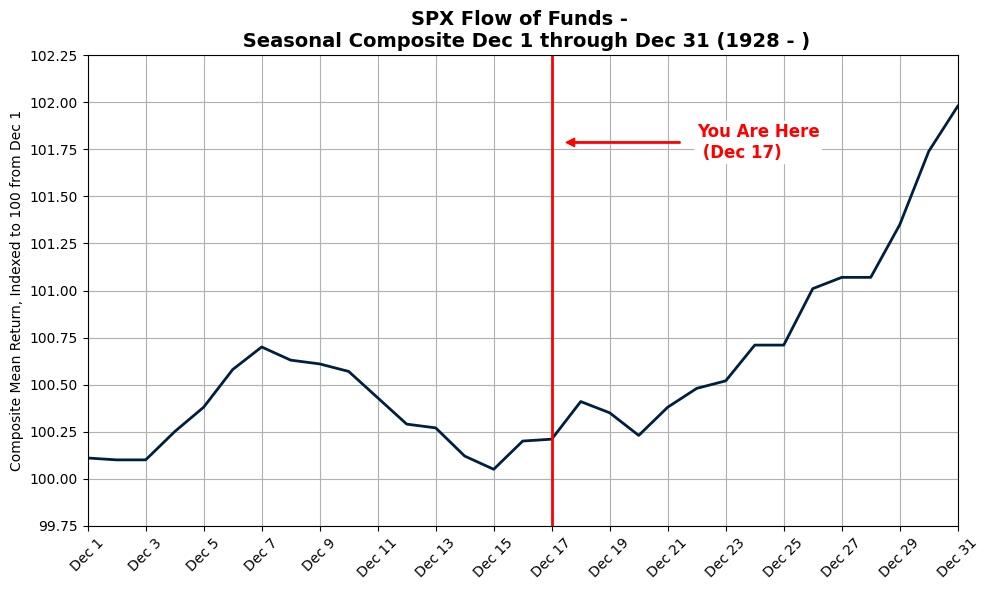
Uncertainty’s still hanging around—it’s just been shoved to the back burner while seasonal tailwinds take the wheel.
We’re enjoying the calm ride for now, but volatility’s always lurking in the shadows.
Read More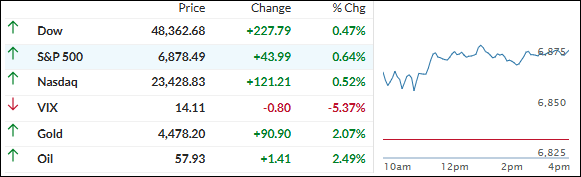

