S&P 500 Scores Best Month Since November

Ulli Market Commentary Contact

[Chart courtesy of MarketWatch.com]

  1. Moving the markets

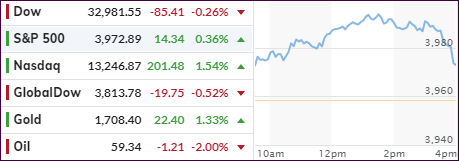
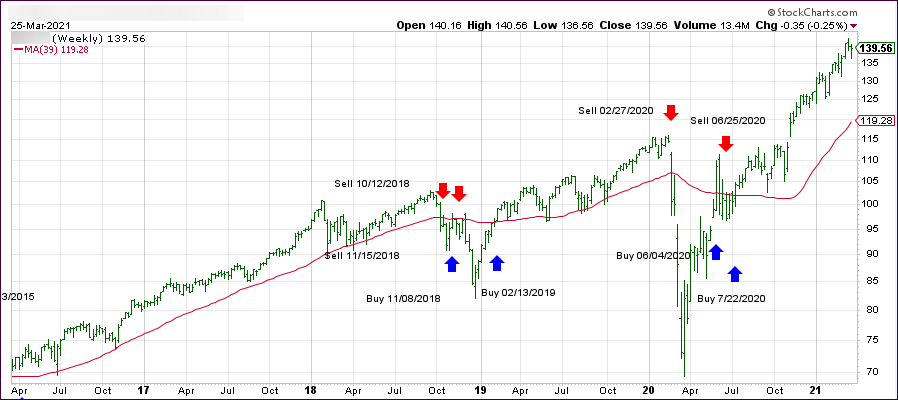
The S&P 500 made a valiant effort to reach its magic 4,000 mark but fell short yet scored its best month since November. Today, it seemed like the rotation was back into the tech sector with the Nasdaq popping 1.52%, while the S&P was helped higher due to its tech heavy components.

Giving an assist was Biden’s big infrastructure plan, despite not only the negative connotations because of increased tax rates for corporations but also due to the closure of a variety of tax loopholes.

Regardless of the tech sector’s resurgence today, for the quarter it has been the laggard with a gain of 3% vs. the Dow’s and S&P’s 8% and 6.2% respectively. CNBC explained the reason this way:

The Nasdaq has been the relative underperformer as technology stocks are especially sensitive to rising rates because they depend on borrowing money cheaply to invest in their future growth.

Traders and investors alike are concerned about the possible negative impact of the massive stimulus/infrastructure plan with Tom Essaye of Sevens Report pointing straight to the underlying issues:

“Economic stimulus is no longer 100% virtuous in the eyes of the market, that’s because it will bring with it 1) Higher yields, 2) Rising inflation expectations and 3) Erosion of the idea that the Fed will be on hold for the entirety of 2021. Additionally, all this stimulus is being used to offset and usher in tax increases on individuals, corporations and investments.”

Well said, but I believe that the initial reaction will be positive for some market sectors, which we try to get exposure in.

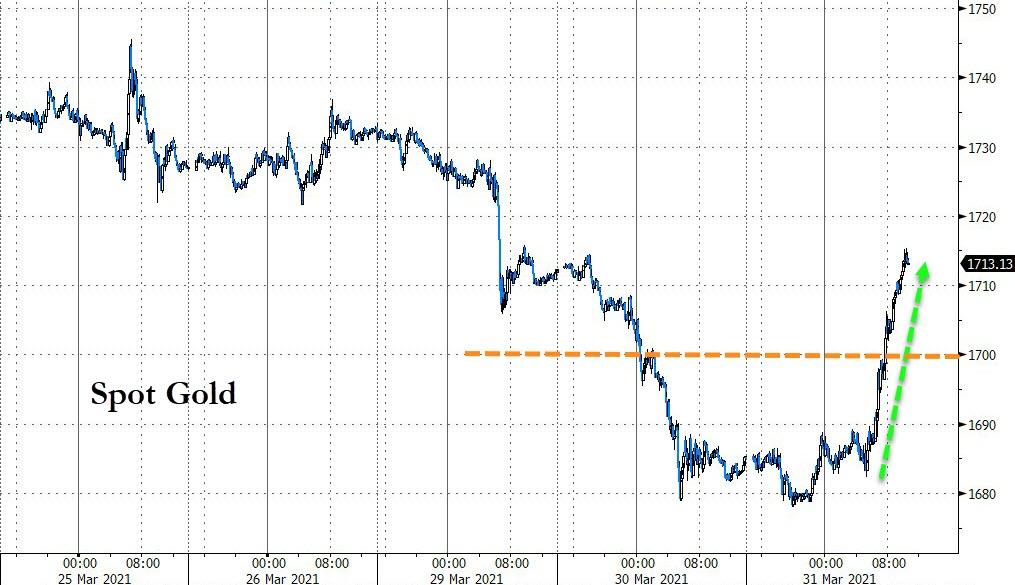
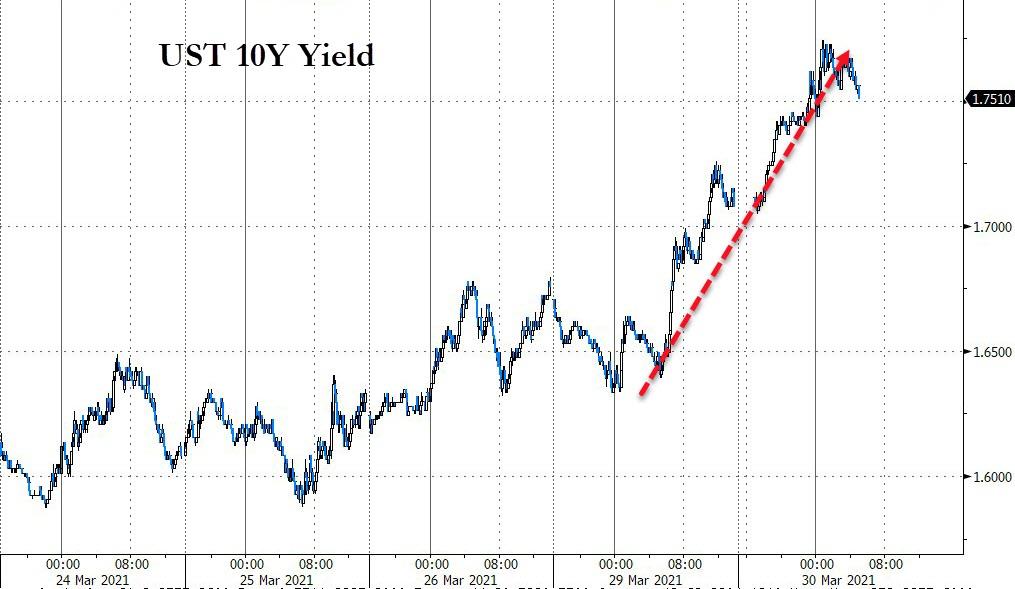
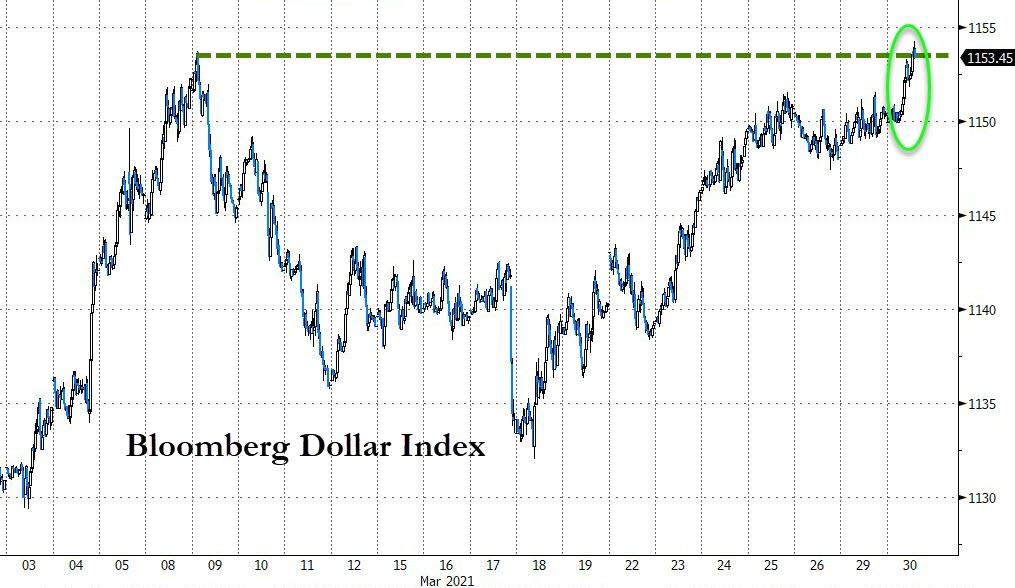
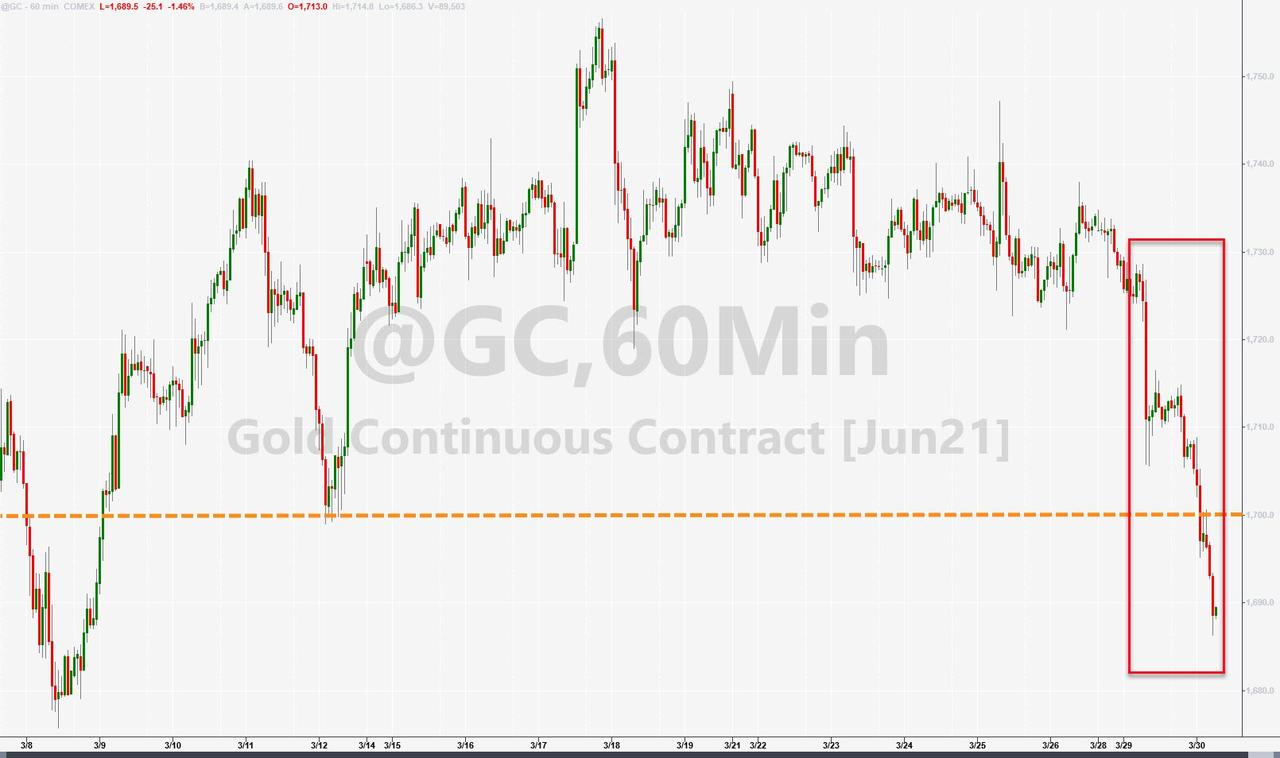
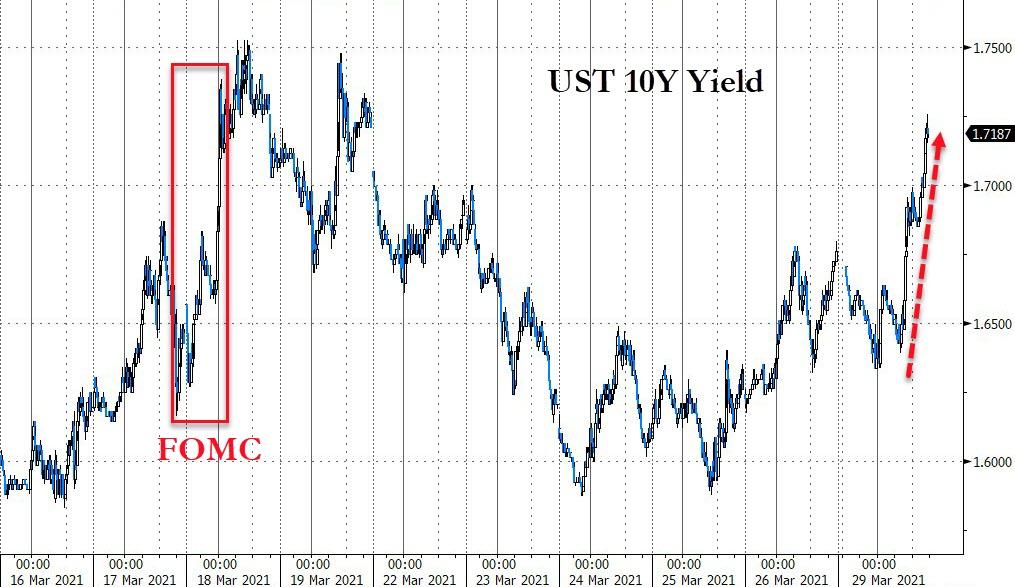
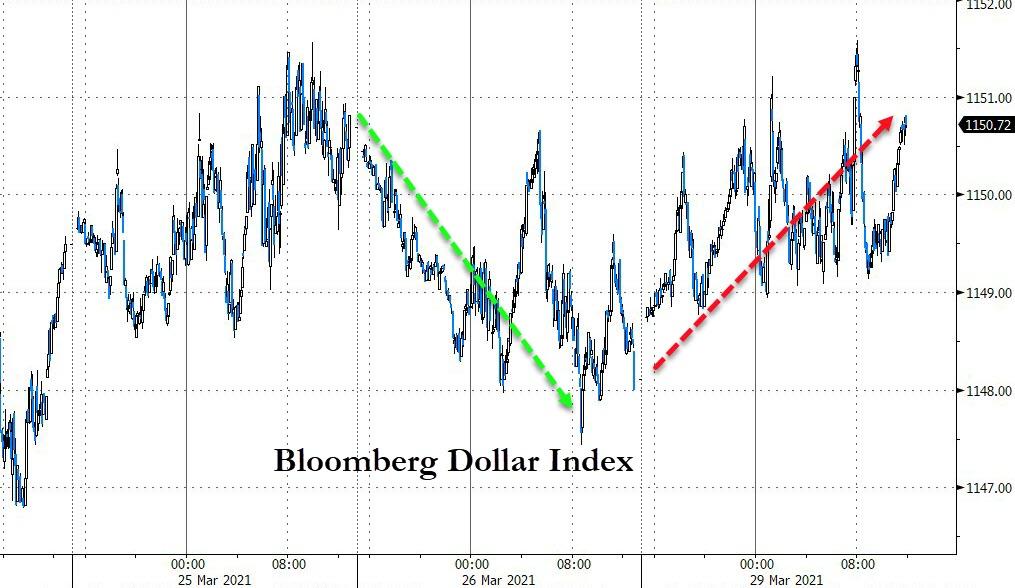
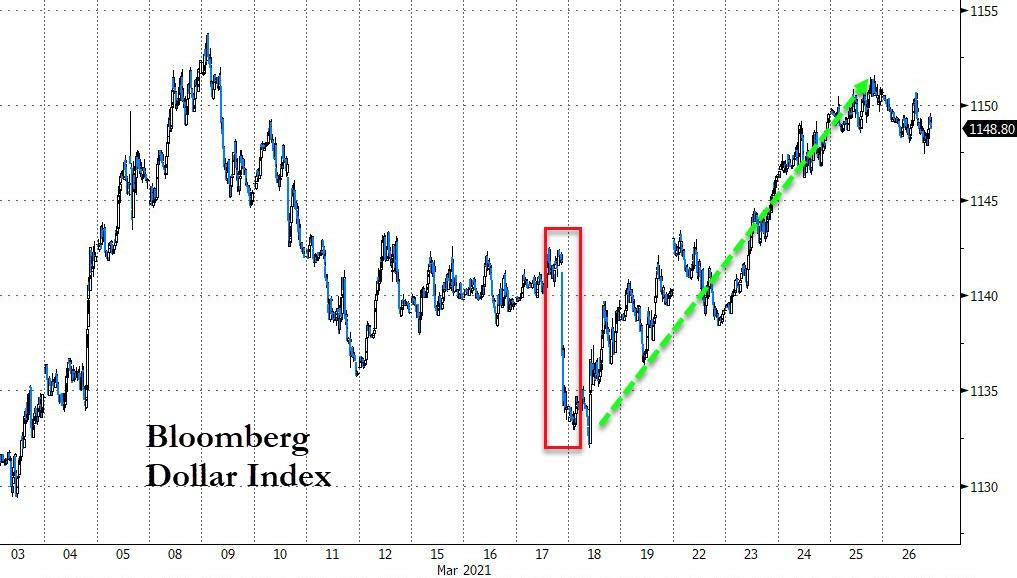
Despite bond yields inching higher, the US Dollar was just about unchanged, which allowed GLD to finally have a decent showing by gaining +1.52%.

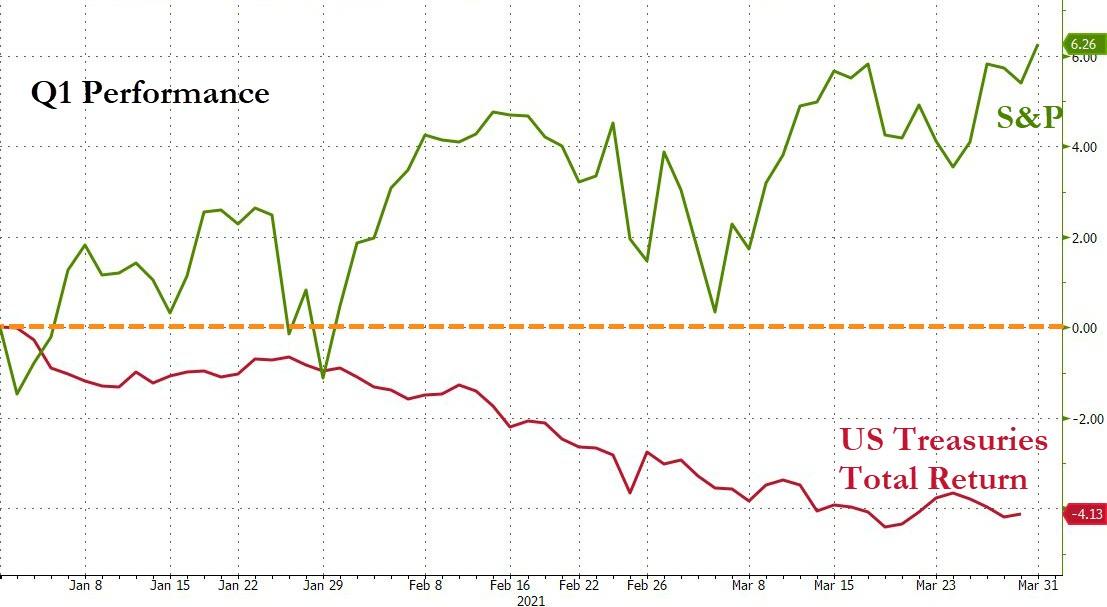
Concerns still abound that volatility might pick up over the next week due to large 60/40 funds having to adjust their holdings back to model on a massive scale, according to JPM. The reason is that US stocks have dramatically outperformed US Treasuries, as Bloomberg shows here.

So far, none of this forced month-end selling has materialized.

Read More

Rising Bond Yields Keep Equities In Check

Ulli Market Commentary Contact

[Chart courtesy of MarketWatch.com]

  1. Moving the markets

An early rise in bond yields, with the 10-year touching its highest level since January 2020, sent the major indexes on a southerly path and into another hole. That seemed to have been the theme as of late, with equities scrambling to get back to their respective unchanged lines.

Today was no different, and the roller coaster ride continued unabated, but all attempts to reach green numbers failed, however, the losses were moderate.

These rising bond yields were accompanied by a surging US Dollar, both of which combined forces to pummel gold back below the $1,700 level. It seems that despite inflationary concerns, because of the reckless money printing scheme, along with fears of stagflation, should support the precious metal, but so far that has not happened.  

Right now, we seem to be engaged in a tug-of-war, where on one side higher rates are being interpreted as fears of inflation while on the side optimism about the economy reigns supreme. The latter was supported today by a positive reading of Consumer Confidence, which exceeded expectations.

Opinions about market direction are plentiful and some oppose each other.

Here’s Fed Reserve Bank of Dallas President Robert Kaplan:

“I’m concerned about excess risk-taking and if that excess risk-taking goes too far, whether it creates excesses and imbalances, that could ultimately create challenges. Equity market cap, divided by gross domestic product, that’s at a historically elevated level. Credit spreads, in the corporate bond markets, are at, relatively speaking, historically tight levels. There’s no question that financial assets, broadly, are at elevated valuation levels.”

Analysts at Evercore saw it differently:

“The significant tailwinds propelling equities higher and the forces that have driven equities into, during, and now out of the pandemic remain. Investors seem to understand that faster growth, rising earnings growth expectations, still historically low corporate borrowing costs, and pent-up consumer demand will fuel further market gains.”

That leaves it wide open as to where the markets will travel next. In my advisor practice, we continue to follow the major trends and let our trailing sell stops be our guide as to when to exit a questionable position.

Read More

Struggling For Altitude

Ulli Market Commentary Contact

[Chart courtesy of MarketWatch.com]

  1. Moving the markets

Despite the major indexes climbing again out of an initial hole, with the Dow back above its unchanged line, markets were shaken up early on.

The culprit was news about the multibillion-dollar family office of Archegos Capital Management, which was faced with a margin call forcing them to liquidate massive holdings in stocks and causing prices to plunge.

Of course, the immediate question was as to who else might be in trouble, which was left unanswered, at least for the time being. US bond yields shot up and gold was getting hammered, as uncertainty reigned.

Not adding anything positive to the already sour mood was this bon mot from MarketWatch:

Credit Suisse shares tumbled 13% as the bank warned it would face a “significant” hit to its first-quarter results due to the bank having to exit hedge fund positions related to the forced selling. Nomura also warned that it could get hit, sending its shares down nearly 15%.

Translated, that means there is never just one cockroach, and we’ll have to wait and see how this plays out and if other entities, yet to be named, may have been caught in that predicament. Whether the ultimate fallout is contained remains the big unknown.

Despite the effort to pull the major indexes out of the doldrums, the S&P fell slightly short, but the Nasdaq remained in the red.

Taking the brunt of the beating were SmallCaps, which we no longer own, and both varieties, growth, and value, were pummeled with the former sinking some 3%.

So far, in March it’s been a tale of two markets with the tech sector slightly in the red, while the Dow and S&P 500 have risen 6.9% and 4.3% respectively.

The US Dollar was slashing around aimlessly and ended marginally higher, while not contributing any warm and fuzzy feelings to this nutty market environment.

Read More

ETFs On The Cutline – Updated Through 03/26/2021

Ulli ETFs on the Cutline Contact

Below, please find the latest High-Volume ETF Cutline report, which shows how far above or below their respective long-term trend lines (39-week SMA) my currently tracked ETFs are positioned.

This report covers the HV ETF Master List from Thursday’s StatSheet and includes 312 High Volume ETFs, defined as those with an average daily volume of more than $5 million, of which currently 246 (last week 249) are hovering in bullish territory. The yellow line separates those ETFs that are positioned above their trend line (%M/A) from those that have dropped below it.

Take a look:                                                                   

The HV ETF Master Cutline Report

In case you are not familiar with some of the terminology used in the reports, please read the Glossary of Terms. If you missed the original post about the Cutline approach, you can read it here.      

ETF Tracker Newsletter For March 26, 2021

Ulli ETF Tracker Contact

ETF Tracker StatSheet          

You can view the latest version here.

THUNDERING INTO THE CLOSE

[Chart courtesy of MarketWatch.com]

  1. Moving the markets

After meandering sideways for most of the session, the major indexes picked up steam during the last hour and ended a rollercoaster week solidly in the green. The Dow recaptured its 33k level, the Nasdaq jumped back above 13k, and the S&P 5000 is again within striking distance of a new milestone marker, namely the 4k point.

Traders apparently decided to look past the potential supply chain troubles, caused by a stranded container ship in the Suez Canal, and focused optimistically on vaccination targets and economic progress due to re-openings.

Even rising bond yields could not stop this sudden enthusiasm, which also received an assist from the Fed’s announcement that banks could resume buybacks and raise dividends starting at the end of June. That helped the financial sector (XLF) to gain +1.67%.

After being clobbered all week, SmallCaps managed a last hour melt up to close in the green, but it remains to be seen if this can be sustained.  

As ZH reported, it was not just US Tech that suffered, there was a major liquidation in China tech stocks as well, but the losers of the week were media stocks, which were monkey hammered and saw their biggest weekly drop since March 2020.

The US Dollar ramp, which eased a little today, finally allowed gold to score a small gain of +0.37%.

We have three more trading days to close out the quarter with some forecasts calling for increased volatility due to quarter-ending adjustments by mutual funds and other modeled entities.

Read More

Weekly StatSheet For The ETF Tracker Newsletter – Updated Through 03/25/2021

Ulli ETF StatSheet Contact

ETF Data updated through Thursday, March 25, 2021

Methodology/Use of this StatSheet:

1. From the universe of over 1,800 ETFs, I have selected only those with a trading volume of over $5 million per day (HV ETFs), so that liquidity and a small bid/ask spread are assured.

2. Trend Tracking Indexes (TTIs)

Buy or Sell decisions for Domestic and International ETFs (section 1 and 2), are made based on the respective TTI and its position either above or below its long-term M/A (Moving Average). A crossing of the trend line from below accompanied by some staying power above constitutes a “Buy” signal. Conversely, a clear break below the line constitutes a “Sell” signal. Additionally, I use an 8% trailing stop loss on all positions in these categories to control downside risk.

3. All other investment arenas do not have a TTI and should be traded based on the position of the individual ETF relative to its own respective trend line (%M/A). That’s why those signals are referred to as a “Selective Buy.” In other words, if an ETF crosses its own trendline to the upside, a “Buy” signal is generated. Since these areas tend to be more volatile, I recommend a wider trailing sell stop of 8%-10% depending on your risk tolerance.

If you are unfamiliar with some of the terminology, please see Glossary of Terms and new subscriber information in section 9.     

1. DOMESTIC EQUITY ETFs: BUY — since 07/22/2020

Click on chart to enlarge

Our main directional indicator, the Domestic Trend Tracking Index (TTI-green line in the above chart) has now rallied above its long-term trend line (red) by +17.53% and remains in “BUY” mode as posted.

Read More