
- Moving the markets
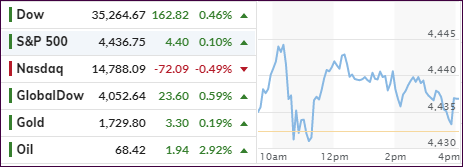
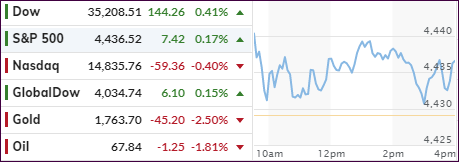
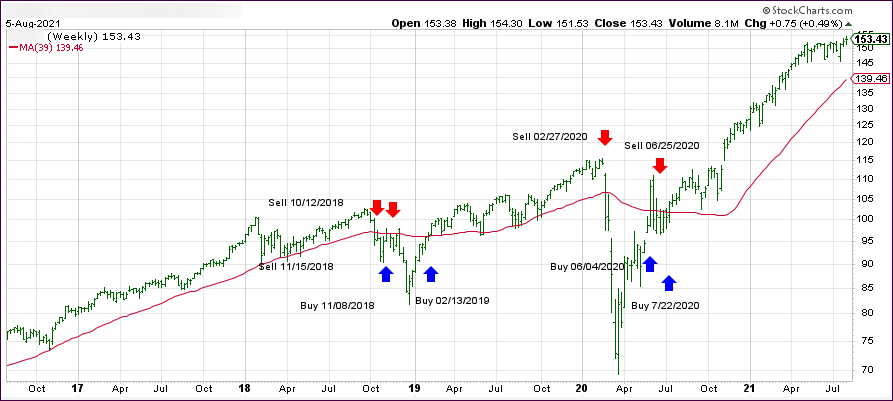
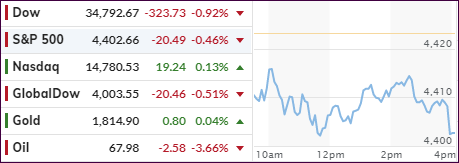
Despite the Dow and S&P 500 climbing into record territory right after the opening, it was only the Dow that maintained its bullish momentum into the close. The S&P 500 floundered and battled with its flatline but managed to close a tad above it, while the Nasdaq stumbled in the red throughout the session.
Supporting the Dow was the Senate’s passage of the $1 trillion infrastructure package, which traders assume to assist those stocks benefiting from economic growth. At least that’s the theory, but as I have pointed out before, the economy needs a boost, as peak growth has decelerated.
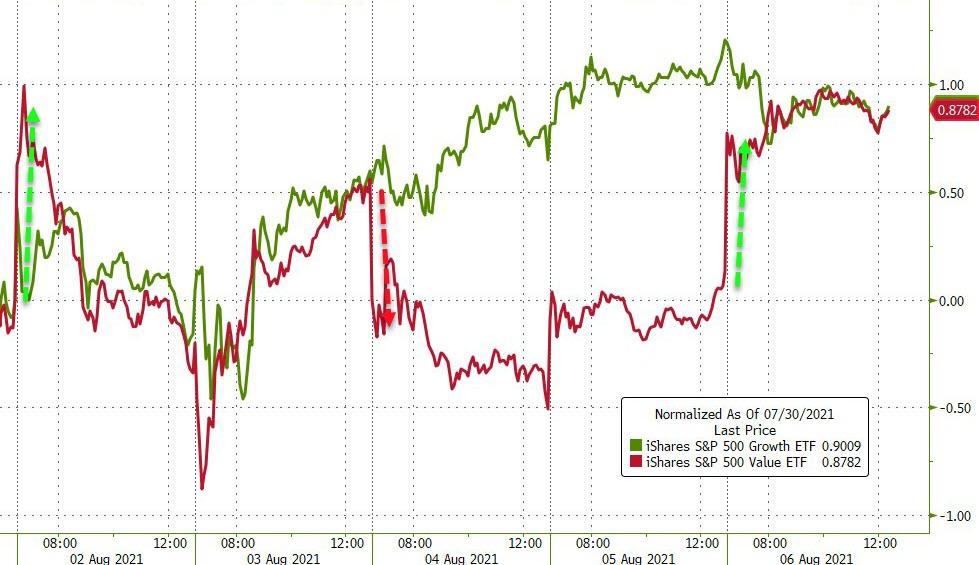
Overall, markets were mixed with Small Caps (VBK) taking a hit of -0.78%, while “value,” as represented by RPV, added a solid +1.32%. That performance was outdone by the Commodities Index (DBC) with +1.81%, as inflation persists and creeps through that sector.
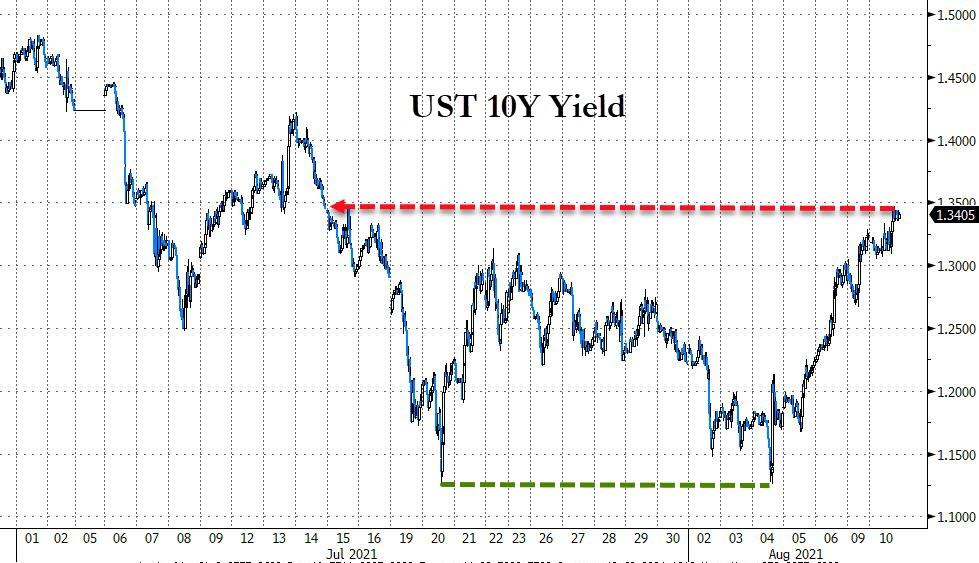
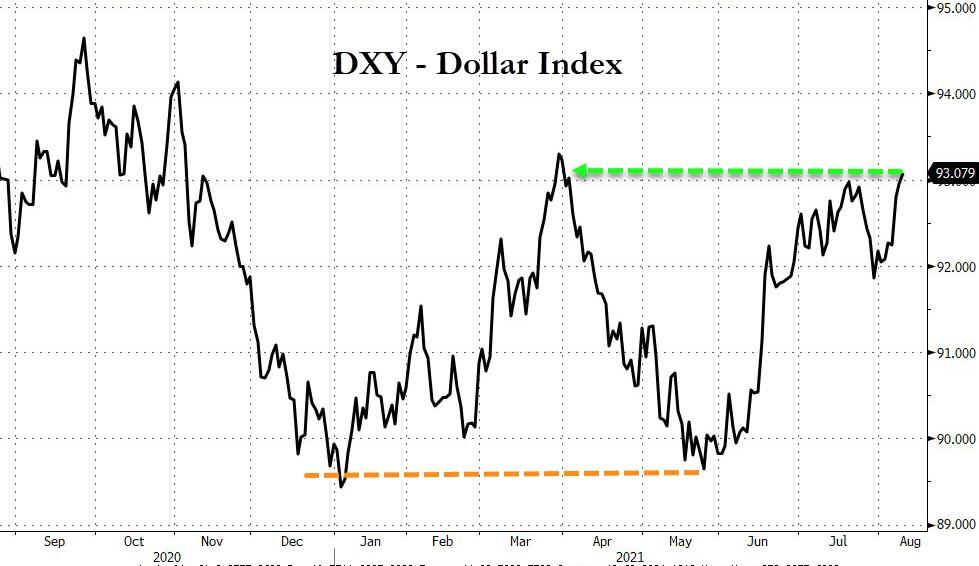
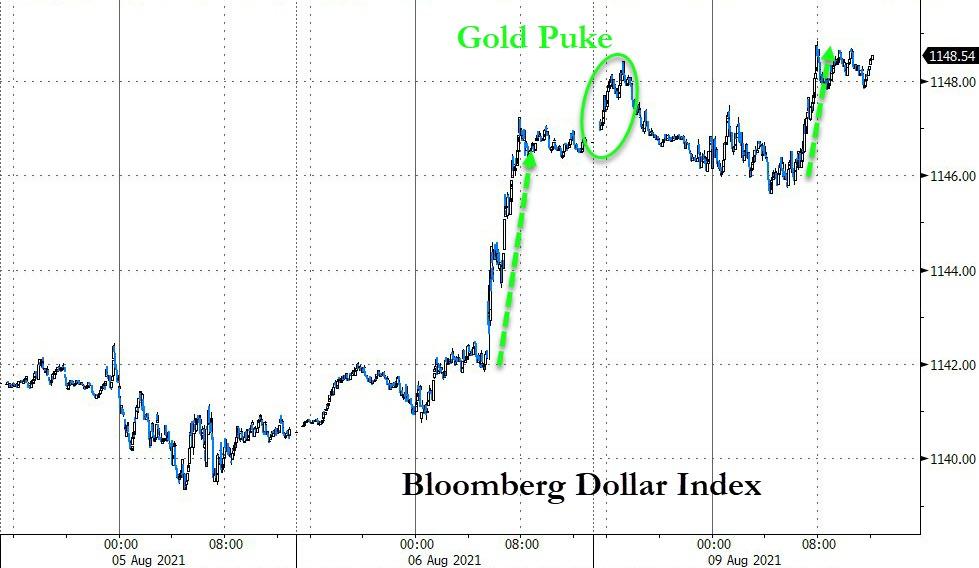
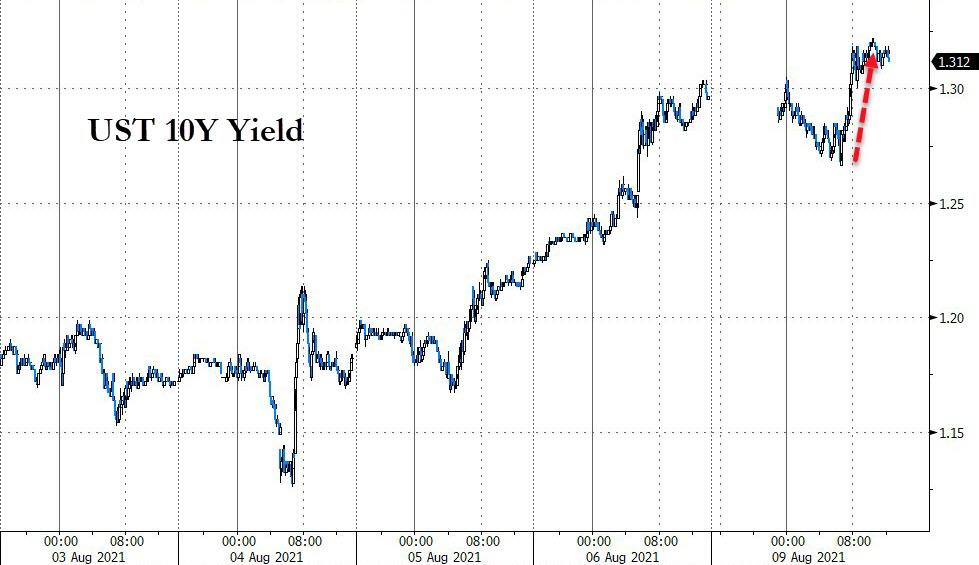
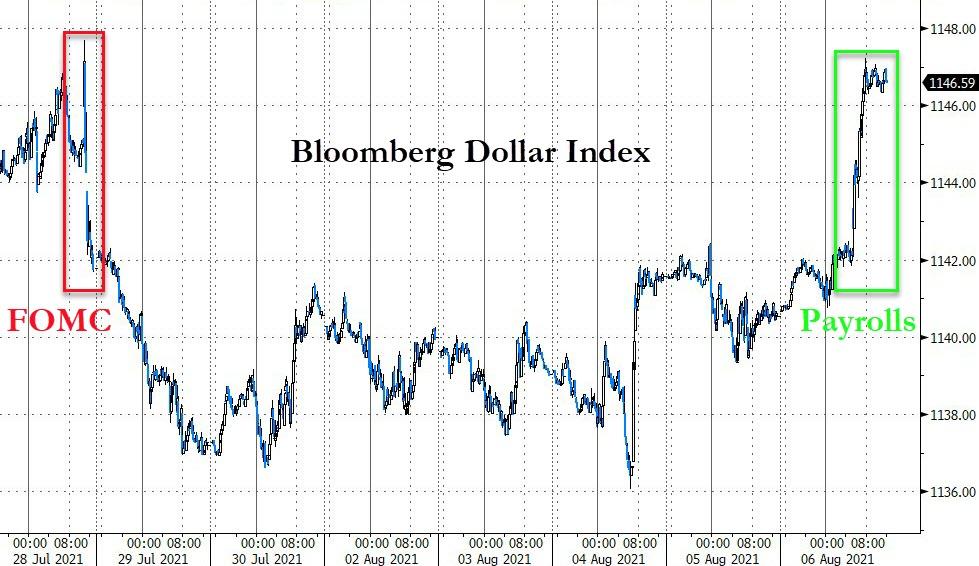
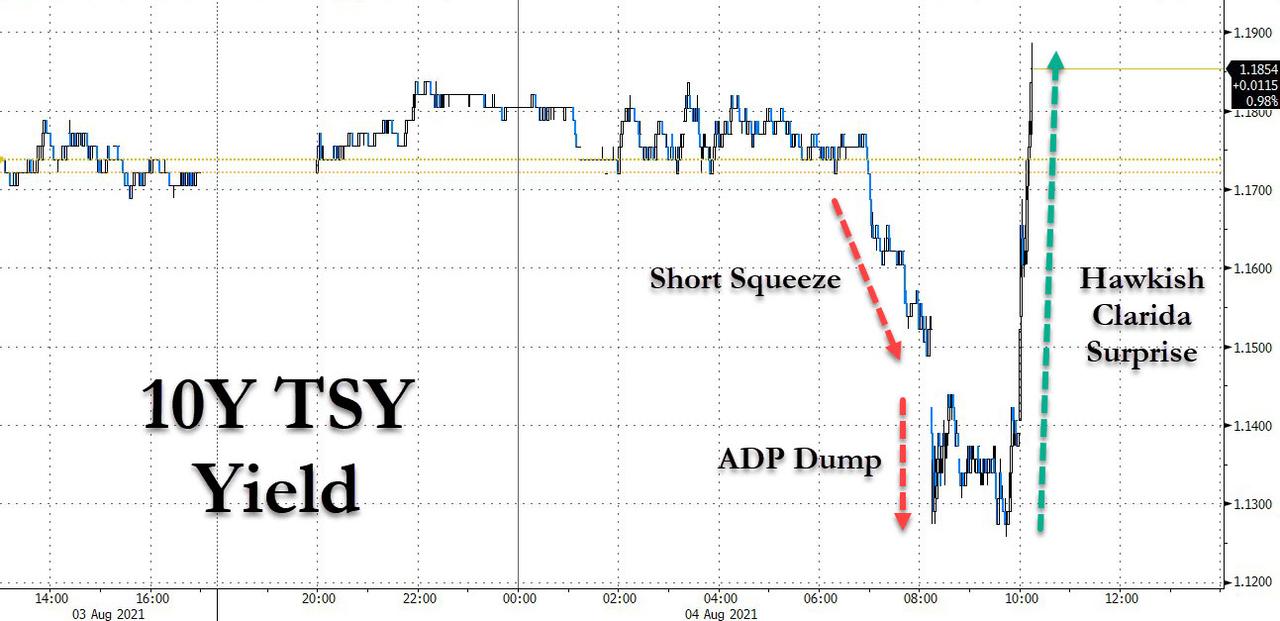
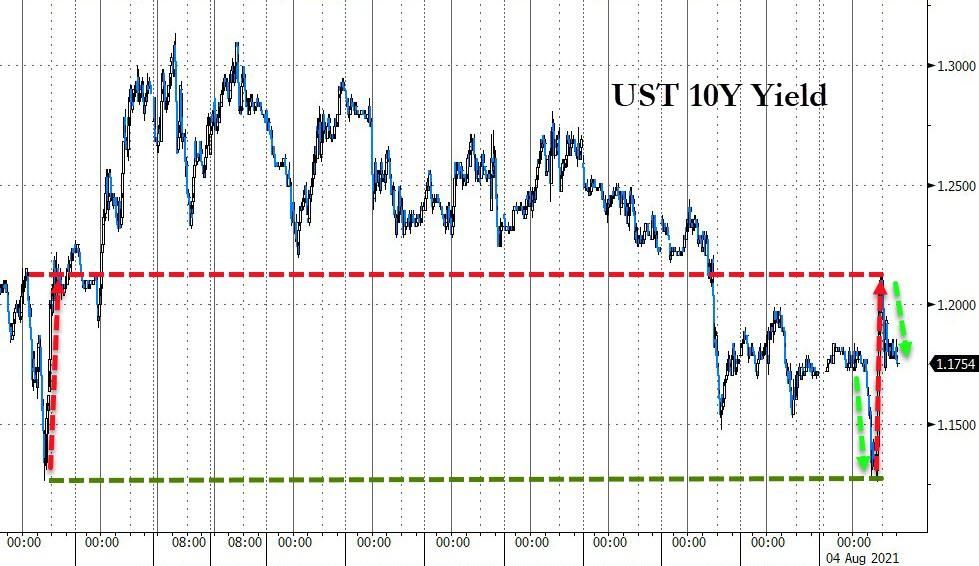
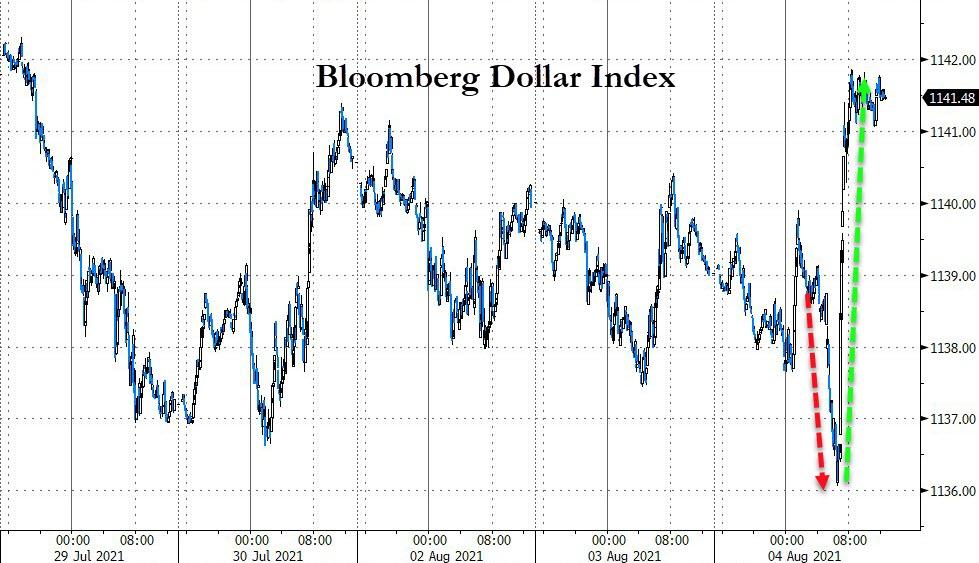
Bond yields continued their charge higher with the 10-year reaching almost 1.35%, which is a massive rebound from the lows of 1.12% just a few days ago. Given higher yields, it’s no surprise that the US Dollar ramped higher and has now reached a point that is close to its March highs.
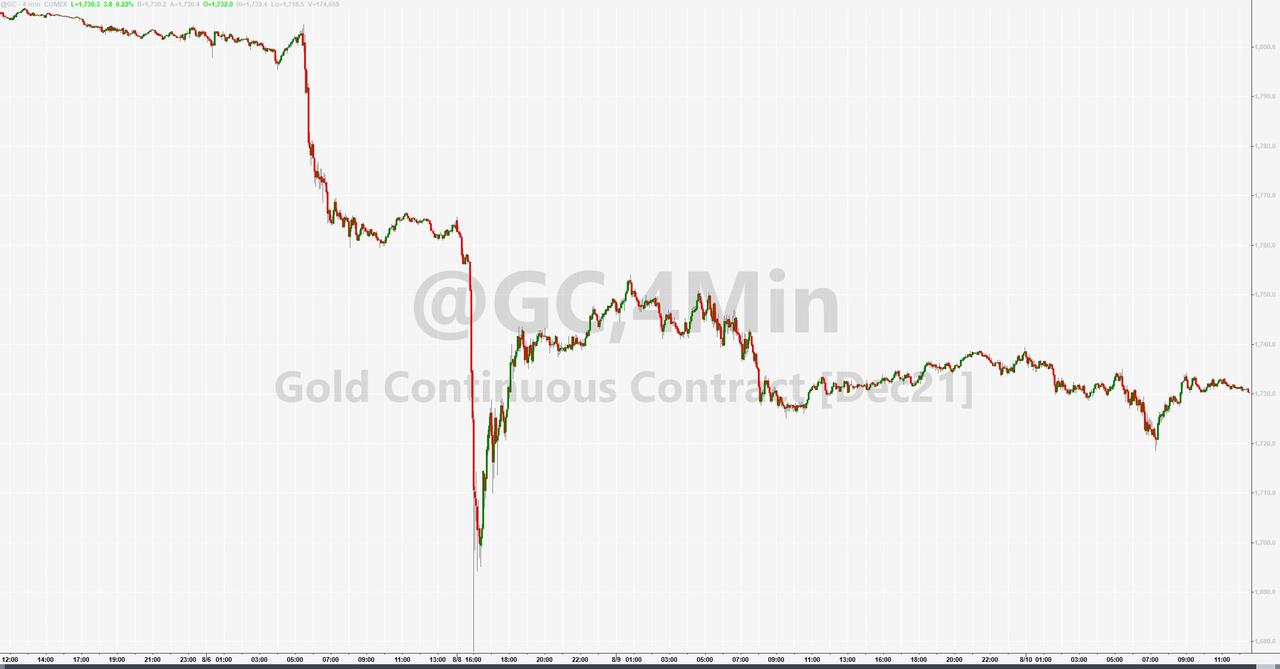
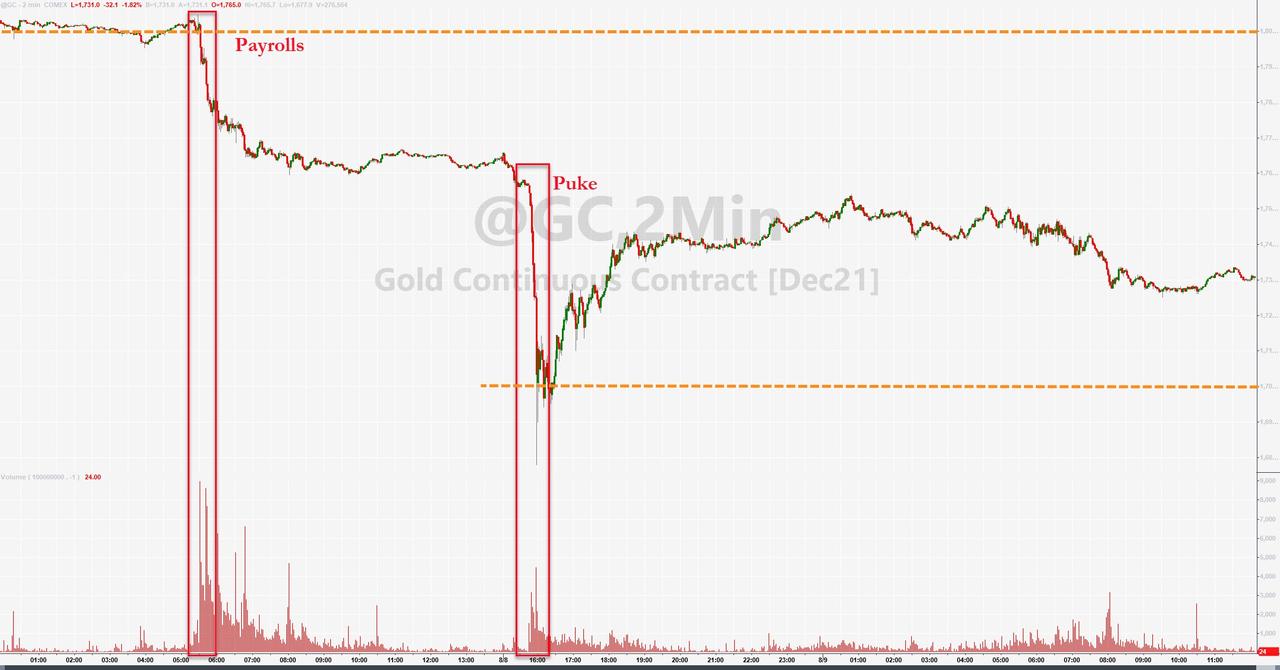
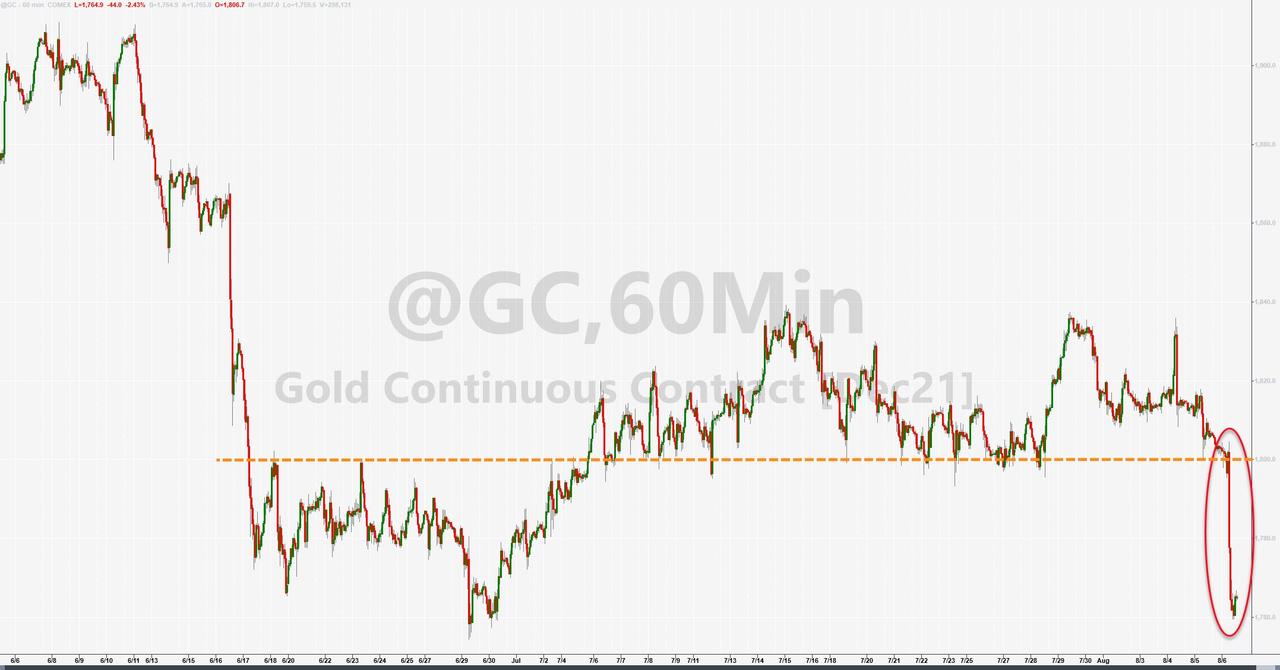
Gold managed to break even and is trying to find some base from which to launch a new attack at its recently lost $1,800 level.
Leave it up to ZeroHedge to come up with another historical trend analysis, this time comparing the current S&P 500 performance with that of 1987:
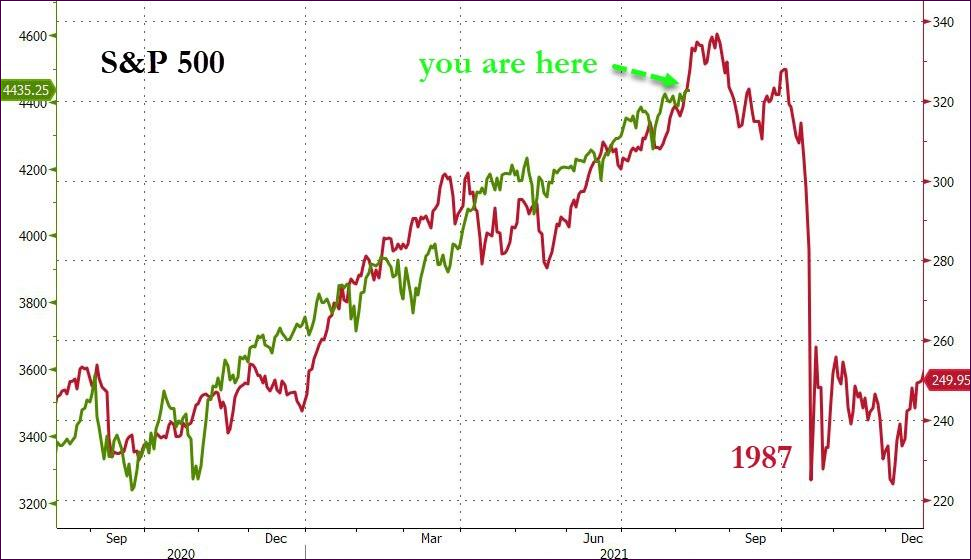
I for one can’t wait to see if history repeats itself.
Read More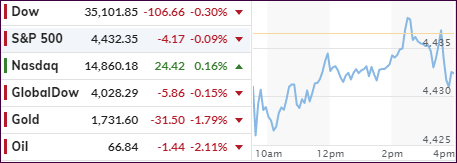
