
ETF Tracker StatSheet
You can view the latest version here.
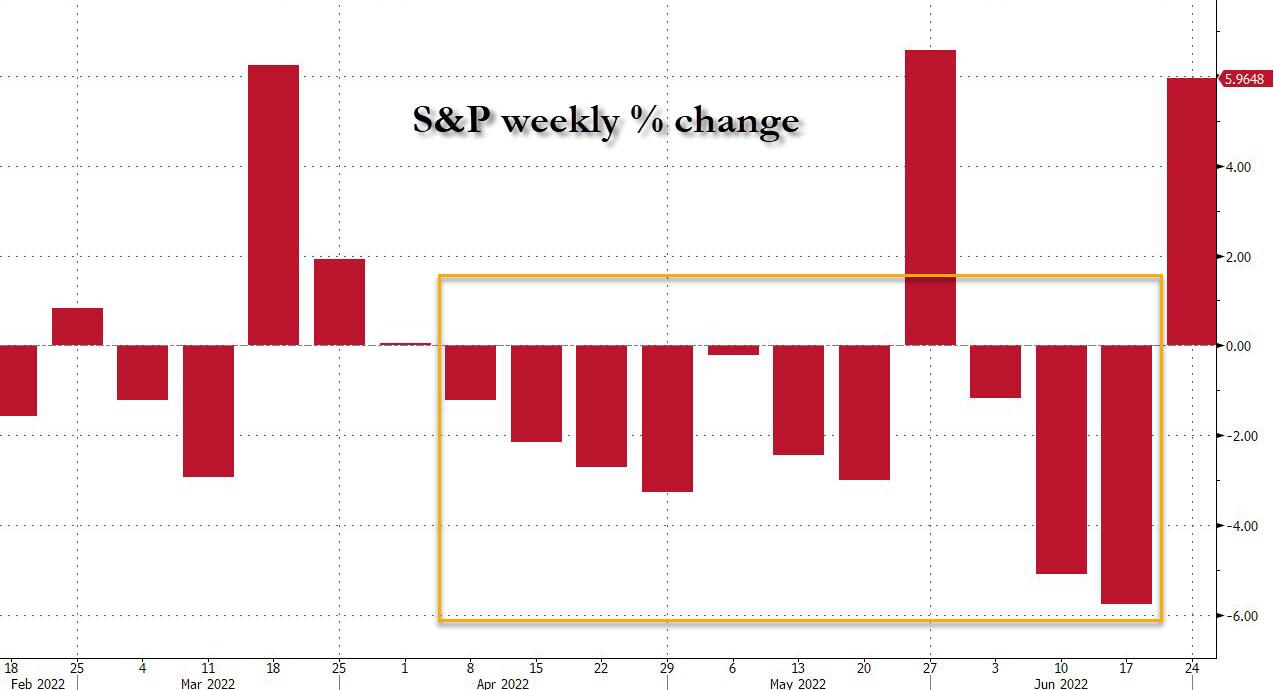
BREAKING A 3-WEEK SKID
- Moving the markets
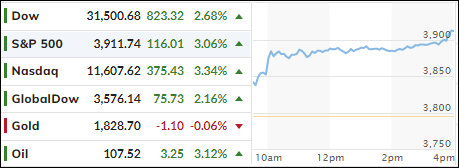
After the recent thrashing, the major indexes finally managed to close the first week out of the last four with a win. Gains were broad, as the markets seemed to have found some stability and strung together a nice relief rally.
Given the oversold conditions, after a rough first half of the year, during which all indexes plunged into bear market territory, a rebound comes as no surprise. Especially during the end of this quarter when the Russell and some $30 billion in pension funds finalize their rebalancing acts. This period is often marked by extreme volatility and heavy trading volume, neither one of which is indicative of future market direction.
The odd thing is that the positive sentiment of the past couple of days is the result of growing concerns with global economic growth, which increases hope that the Fed will have to end its interest rate hiking process sooner than later and start lowering rates.
Bloomberg called it this way:
US equities are rallying on Friday, putting them on pace to wipe out the losses from last week, as recession fears calm, and a key economic data suggest inflation may be cooling.
ZeroHedge argued against that conclusion:
It’s a good headline, unfortunately it’s dead wrong, because while stocks did in fact snap a three-week losing streak and also averted being down for a record 11 out of 12 weeks…
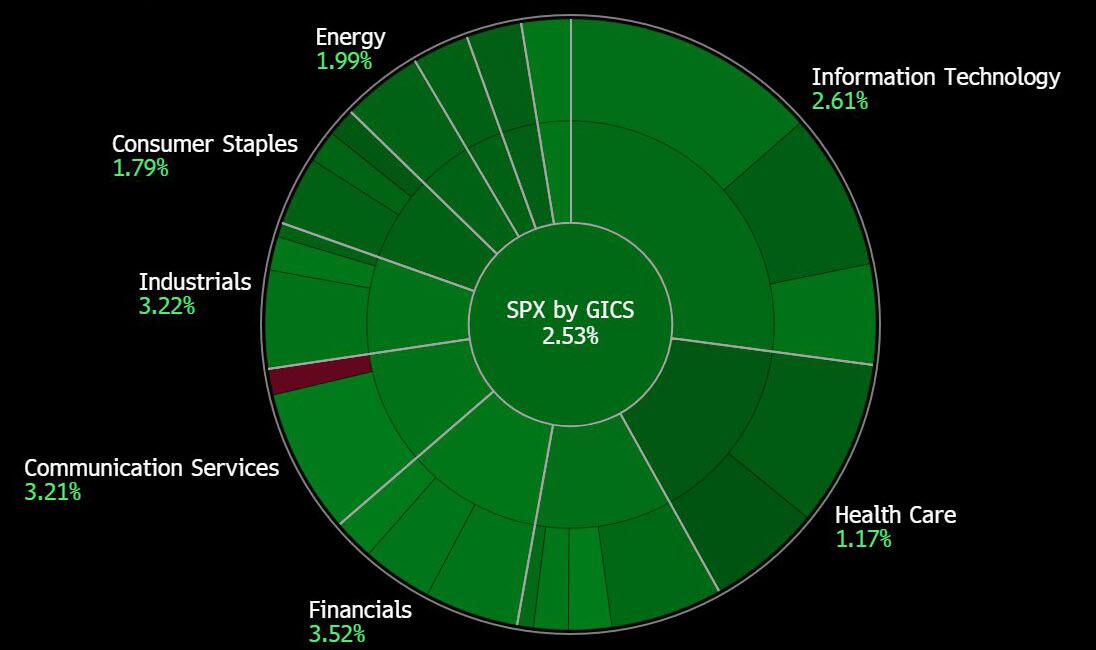
… with every single sector closing solidly green…
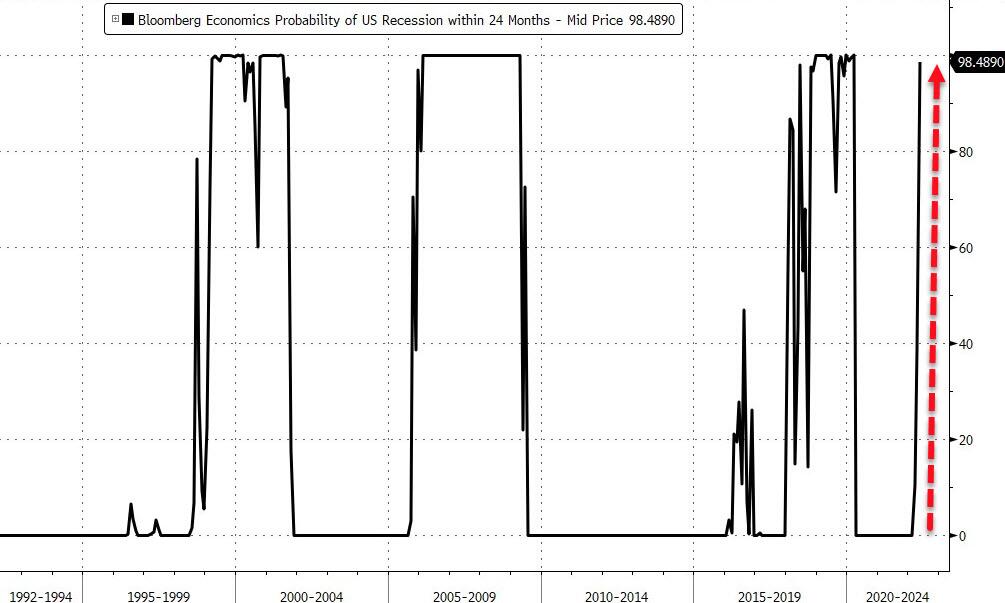
… the reason for said snapping was just the opposite of optimism because with a recession now assured…
… what prompted today’s furious short squeeze, because that’s what it was – a short squeeze of the most shorted names…
… was the market’s realization – helped by our explanation yesterday – that a recession means the Fed will end its hiking cycle much sooner than previously expected, most likely sometime around the mid-term election…
Just that potential of rates possibly having peaked was cause for the bulls to celebrate by ramping up stocks but forgetting that a recession will affect corporate earnings negatively and therefore stump stock prices.
However, in the era of “bad news is good news” everything is possible, even the remote chance that Fed head Powell might stick to his guns and seriously hike rates to battle inflation—recession be damned. Because if the folds, and lowers rates again as markets expect, hyperinflation will be our steady companion, along with a constantly devaluating dollar.
Next week, I expect some more quarter-end buying to support the indexes, with the S&P 500 possibly recouping its 4k level, but after we enter July, all bets are off.
2. ETFs in the Spotlight
In case you missed the announcement and description of this section, you can read it here again.
It features some of the 10 broadly diversified domestic and sector ETFs from my HighVolume list as posted every Saturday. Furthermore, they are screened for the lowest MaxDD% number meaning they have been showing better resistance to temporary sell offs than all others over the past year.
The below table simply demonstrates the magnitude with which these ETFs are fluctuating above or below their respective individual trend lines (%+/-M/A). A break below, represented by a negative number, shows weakness, while a break above, represented by a positive percentage, shows strength.
For hundreds of ETF choices, be sure to reference Thursday’s StatSheet.
For this closed-out domestic “Buy” cycle (2/24/2022), here’s how some of our candidates have fared:

Click image to enlarge.
Again, the %+/-M/A column above shows the position of the various ETFs in relation to their respective long-term trend lines, while the trailing sell stops are being tracked in the “Off High” column. The “Action” column will signal a “Sell” once the -12% point has been taken out in the “Off High” column, which has replaced the prior -8% to -10% limits.
3. Trend Tracking Indexes (TTIs)
Our TTIs improved greatly but remain stuck on the bearish side of their respective trend lines.
This is how we closed 06/24/2022:
Domestic TTI: -9.30% below its M/A (prior close -12.83%)—Sell signal effective 02/24/2022.
International TTI: -10.61% below its M/A (prior close -12.82%)—Sell signal effective 03/08/2022.
Disclosure: I am obliged to inform you that I, as well as my advisory clients, own some of the ETFs listed in the above table. Furthermore, they do not represent a specific investment recommendation for you, they merely show which ETFs from the universe I track are falling within the specified guidelines.
All linked charts above are courtesy of Bloomberg via ZeroHedge.
———————————————————-
WOULD YOU LIKE TO HAVE YOUR INVESTMENTS PROFESSIONALLY MANAGED?
Do you have the time to follow our investment plans yourself? If you are a busy professional who would like to have his portfolio managed using our methodology, please contact me directly to get more details.
Contact Ulli