
- Moving the markets
Despite a negative news environment, traders ignored most of the headlines and the fact that US factory orders tumbled in February and scored their biggest drop since April 2020.
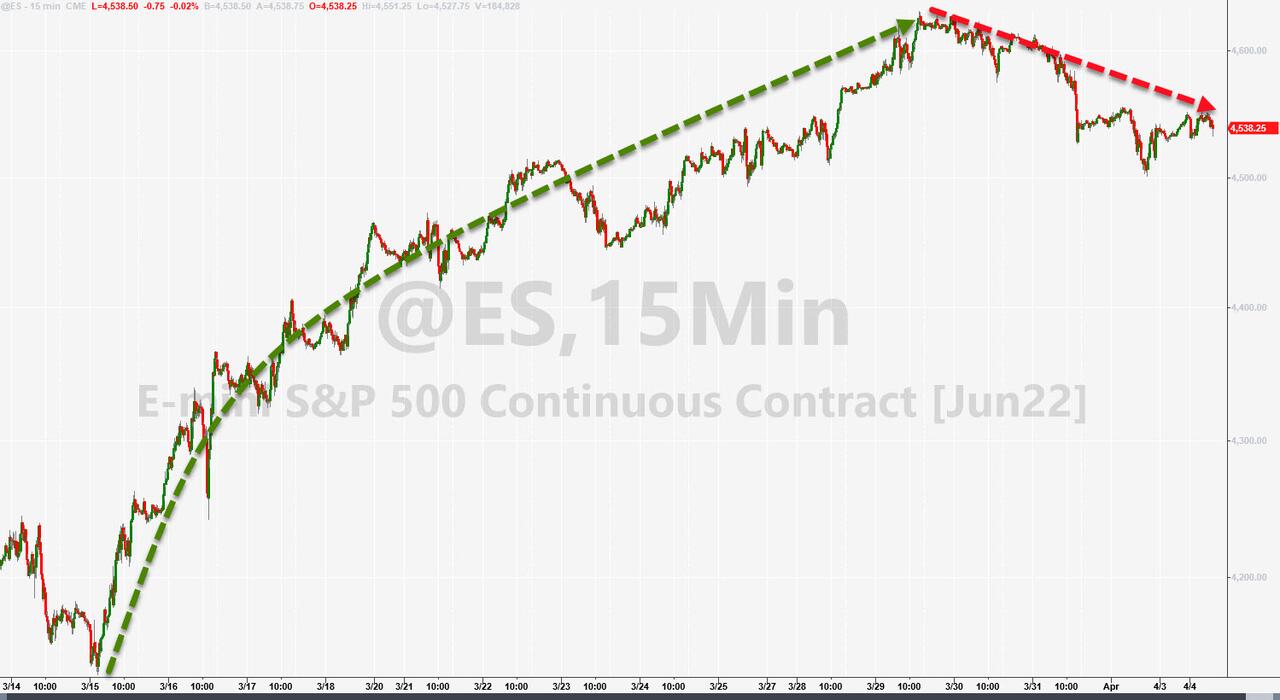
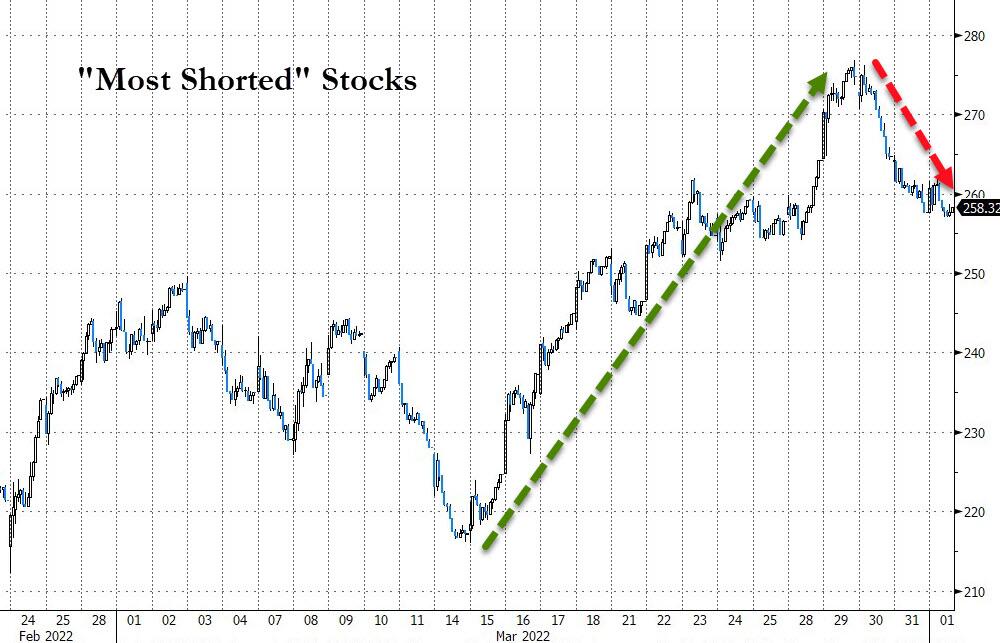
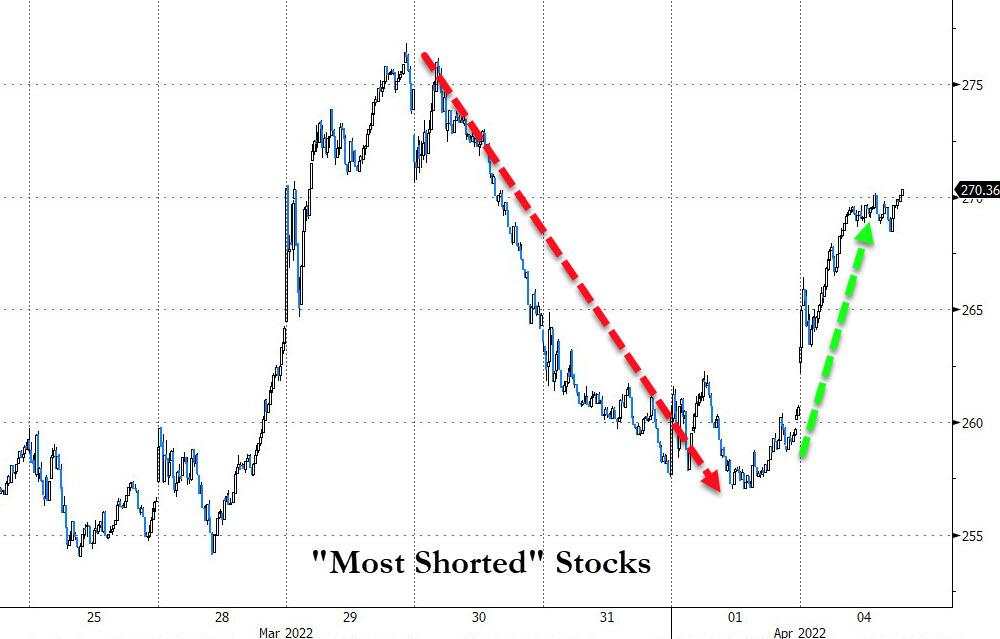
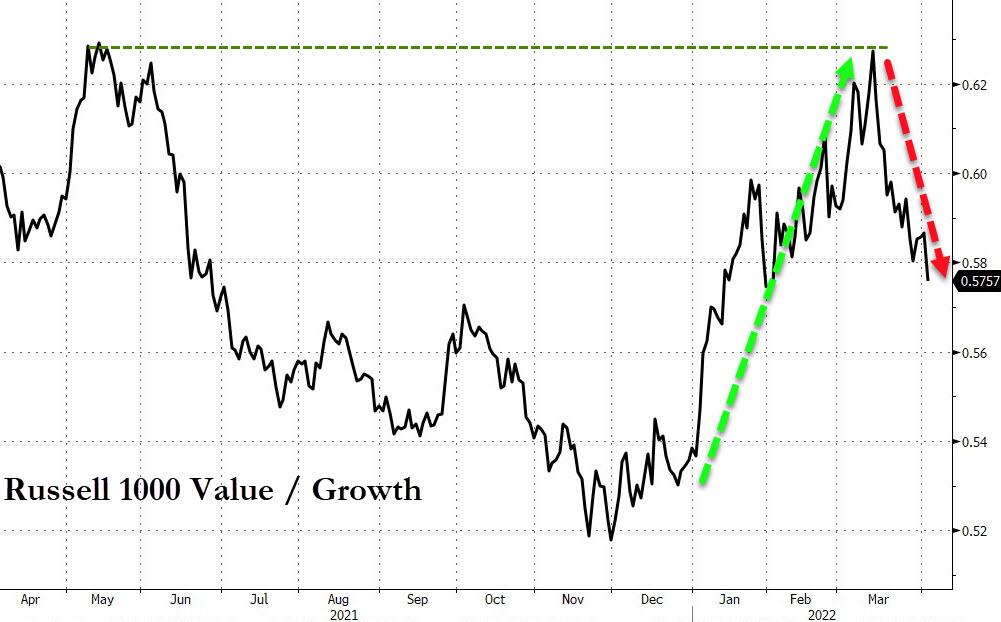
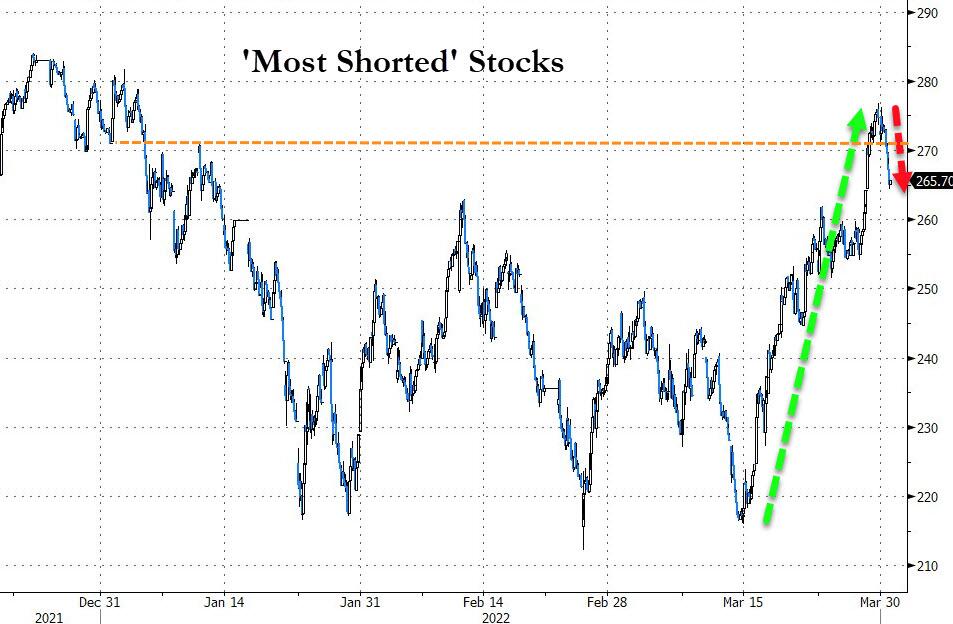
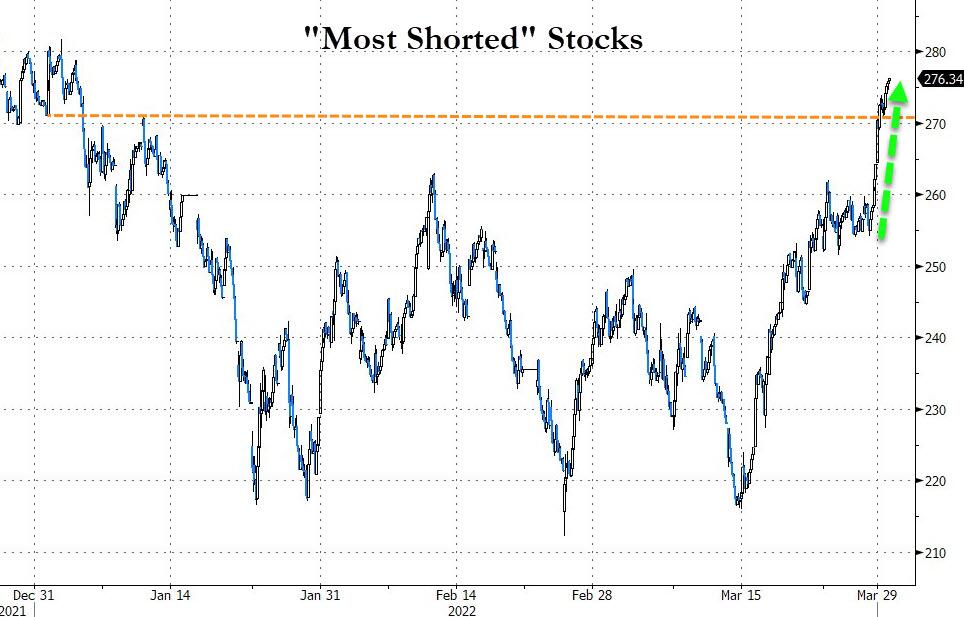
Also sounding a word of caution was this chart (hat tip to ZH) suggesting that the March melt up, AKA a short-cover rally, may be showing some momentum fatigue and nearing its end with most shorts now fully covered thereby eliminating them as a future driving force—except today, when they suddenly came to life again.
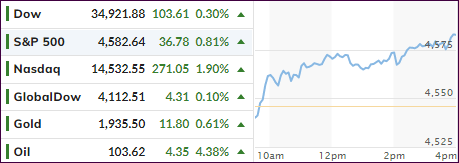
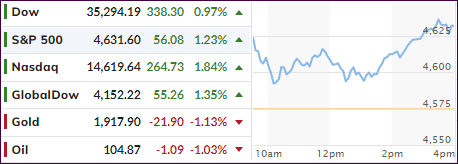
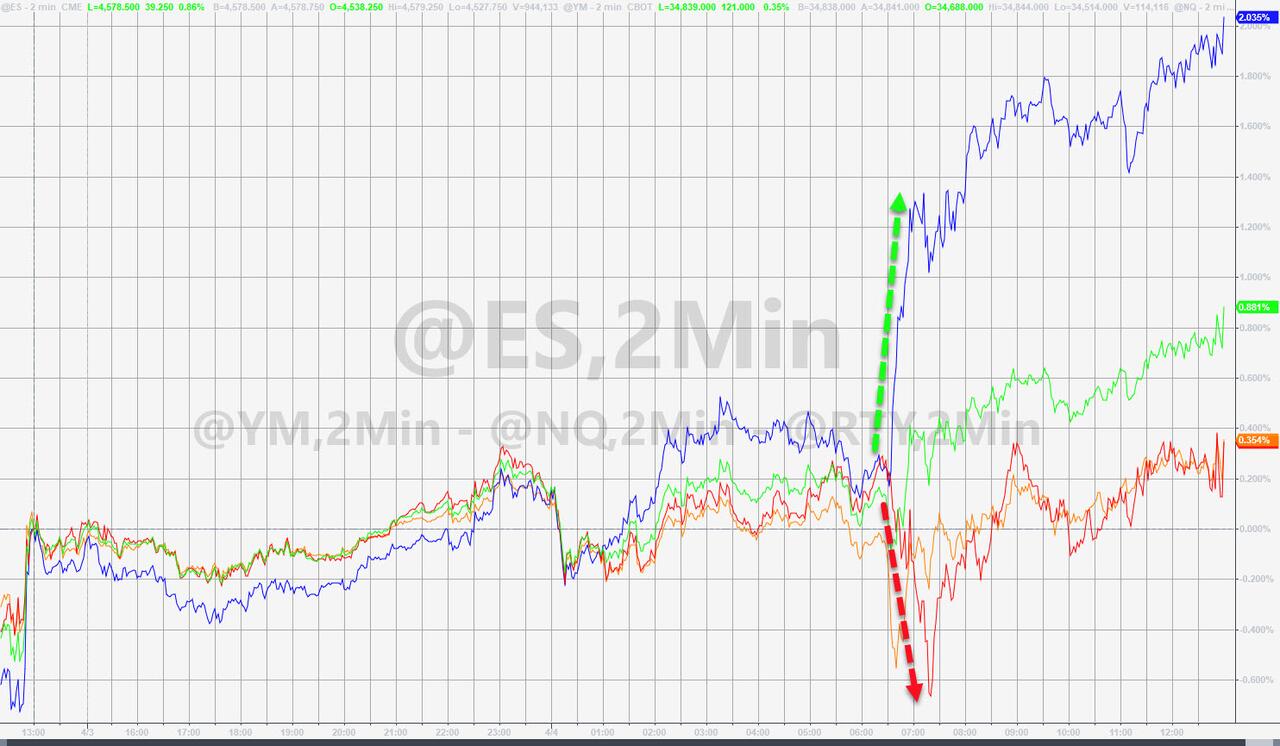
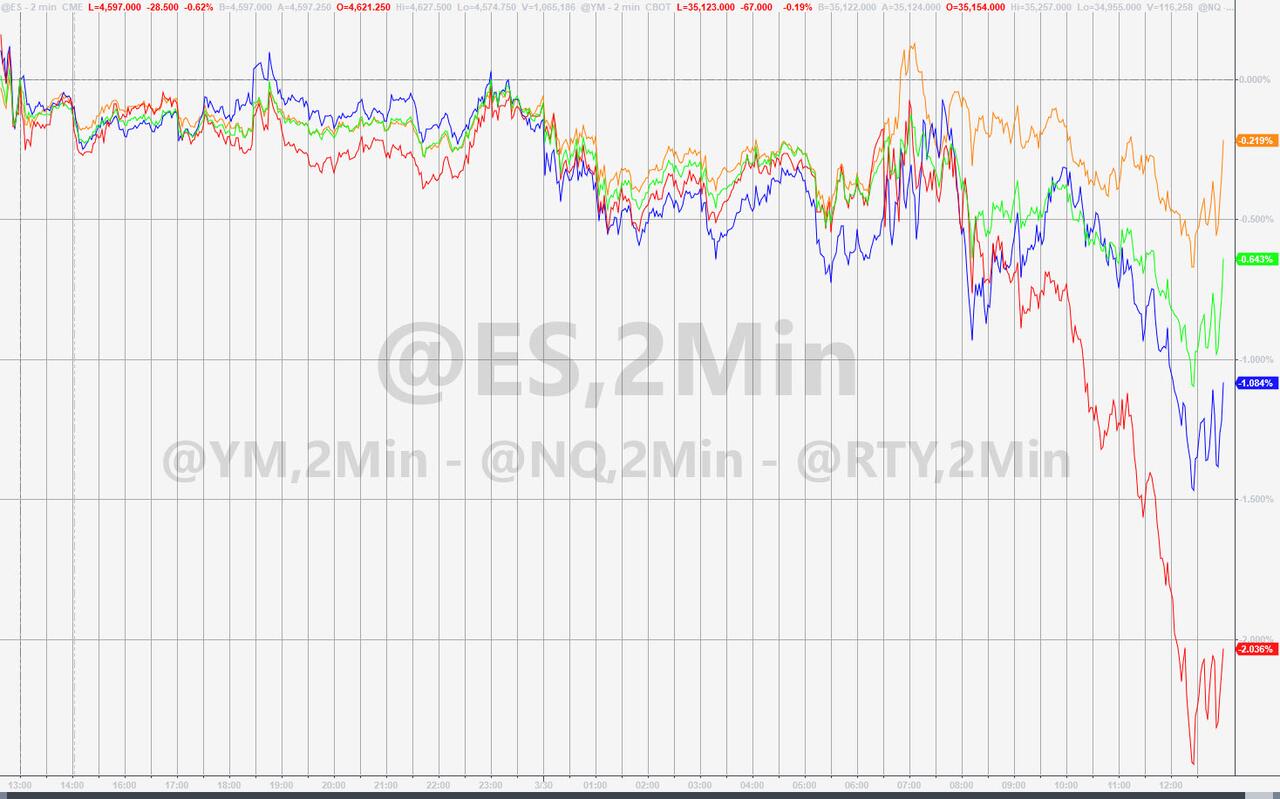
None of the above mattered, as the major indexes seemed to climb a wall of worry by ending the session with solid gains led by the much beaten-up tech sector, sort of a relief rally.
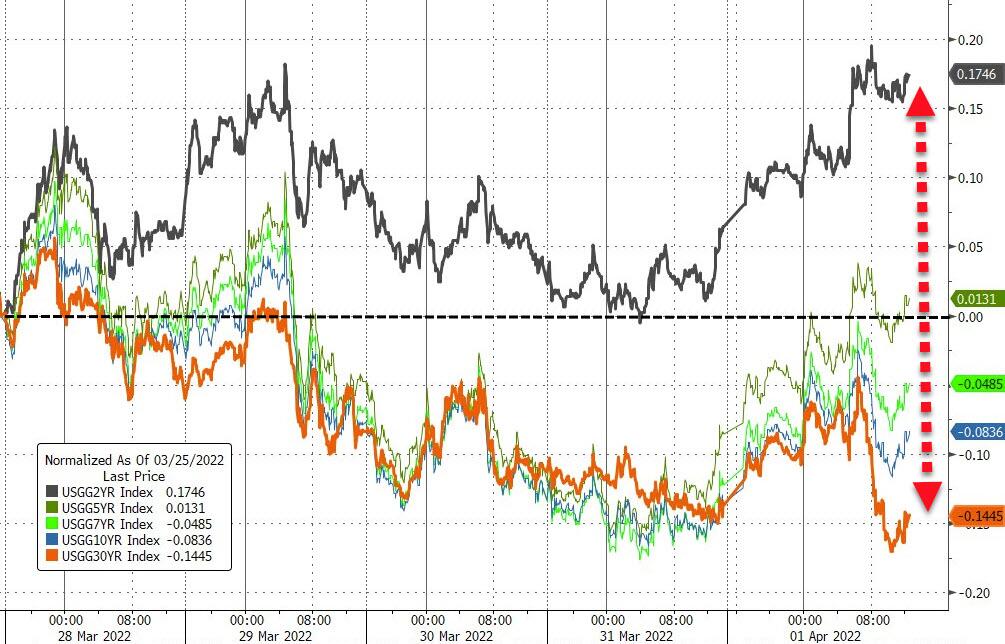
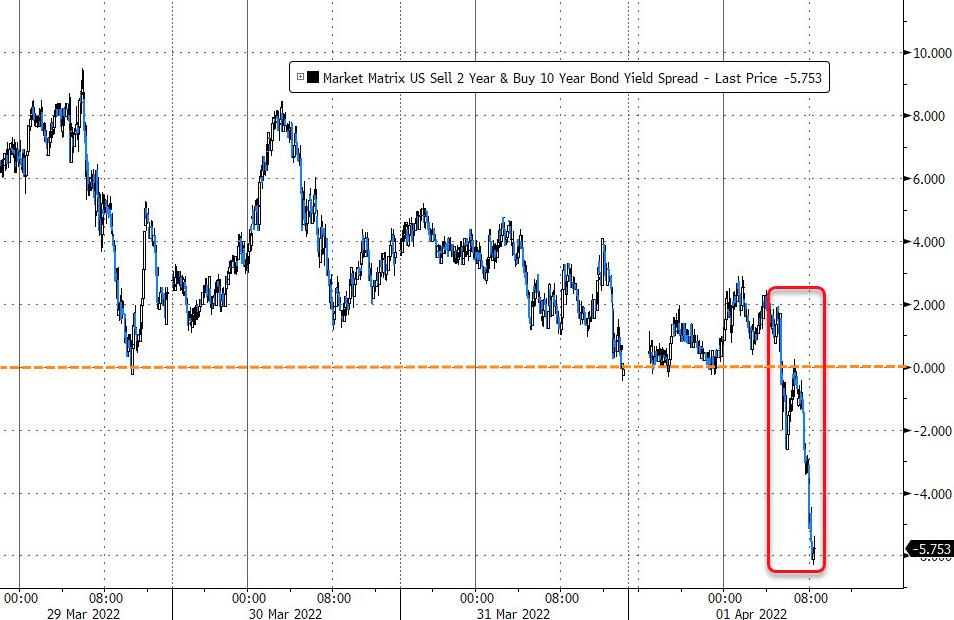
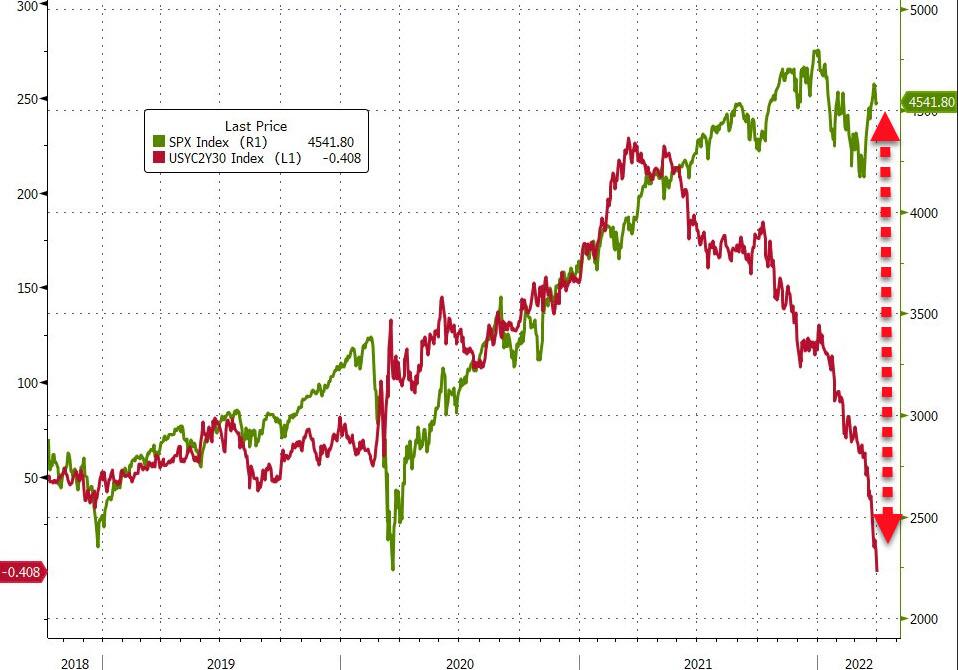
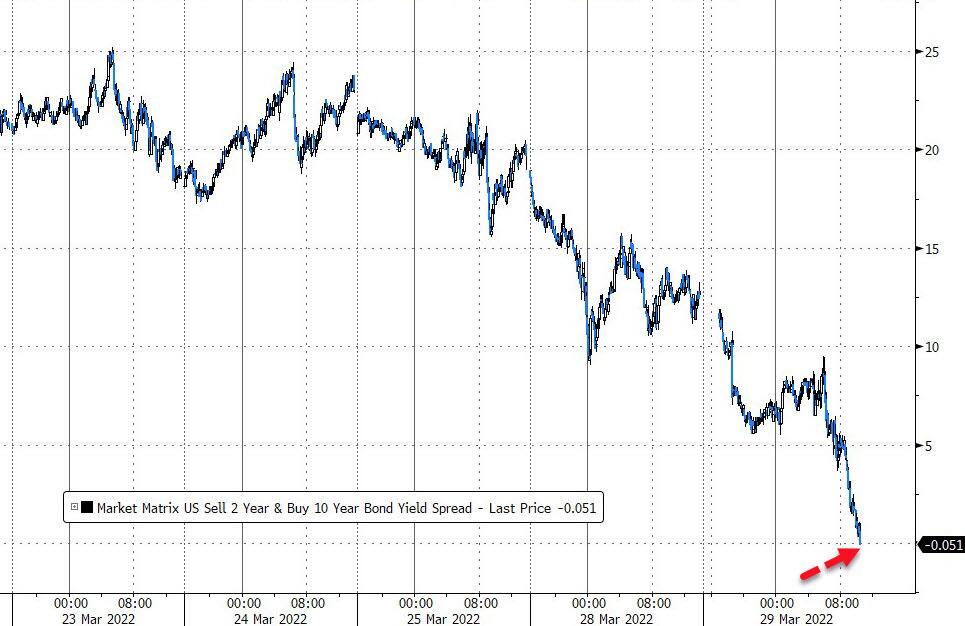
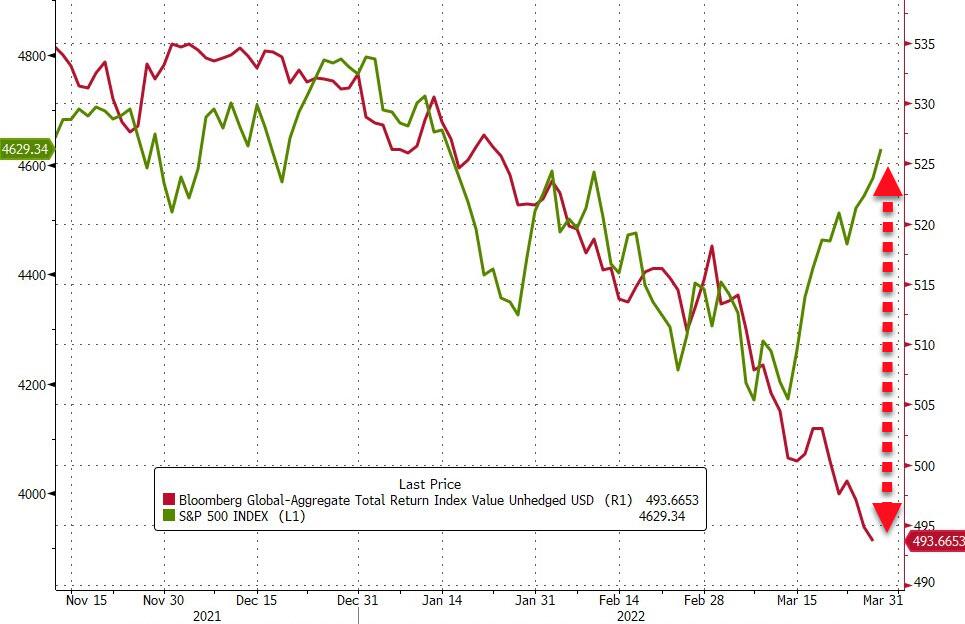
Equities and bonds are still sending diverging indications about the economy, which look to be depending on the headline news of the day, as yield curve inversions are pointing towards a recession, while cease-fire talks in Ukraine appear to change by the moment. Both are contributing to market- and economic uncertainties, but they should not be over-analyzed on a day-to-day basis.
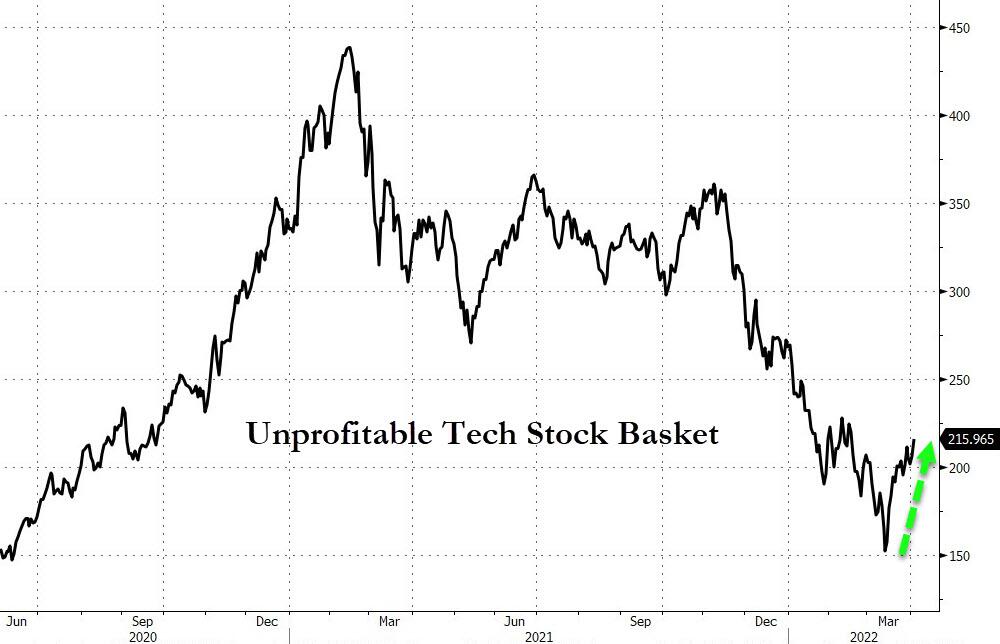
With “value” having had the upper hand YTD over “growth”, today was opposite day, with the latter outperforming the former, which allowed the Nasdaq to be the top dog for this session. Even the “unprofitable tech stock basket” managed a long overdue rebound.
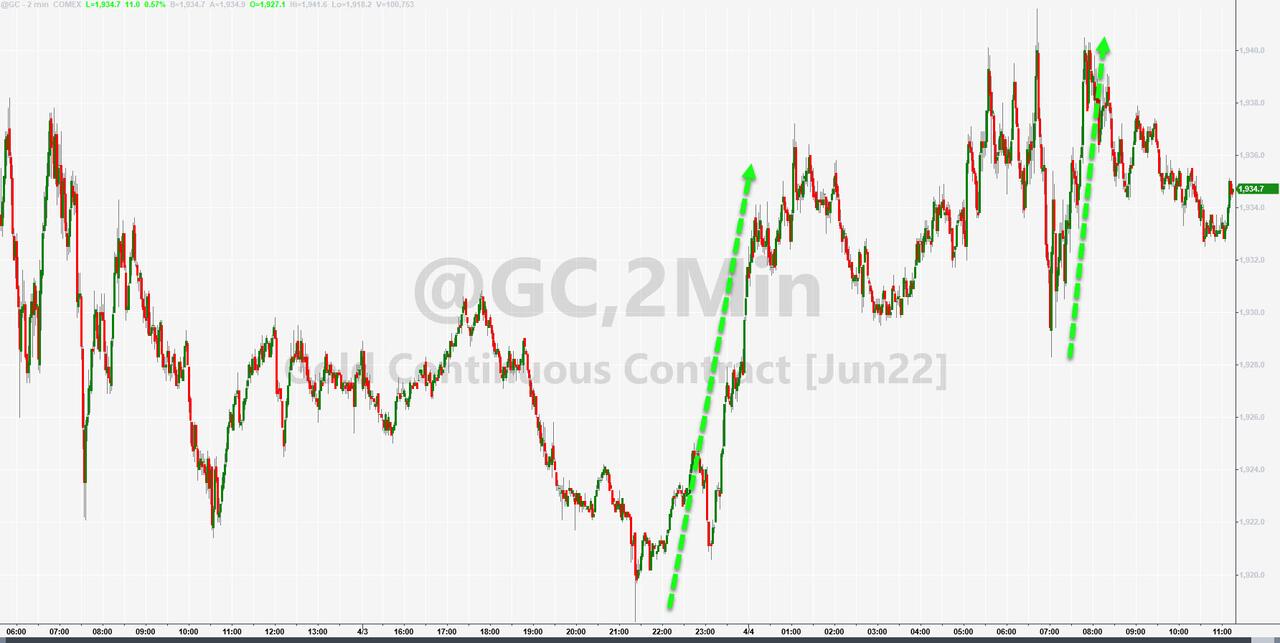
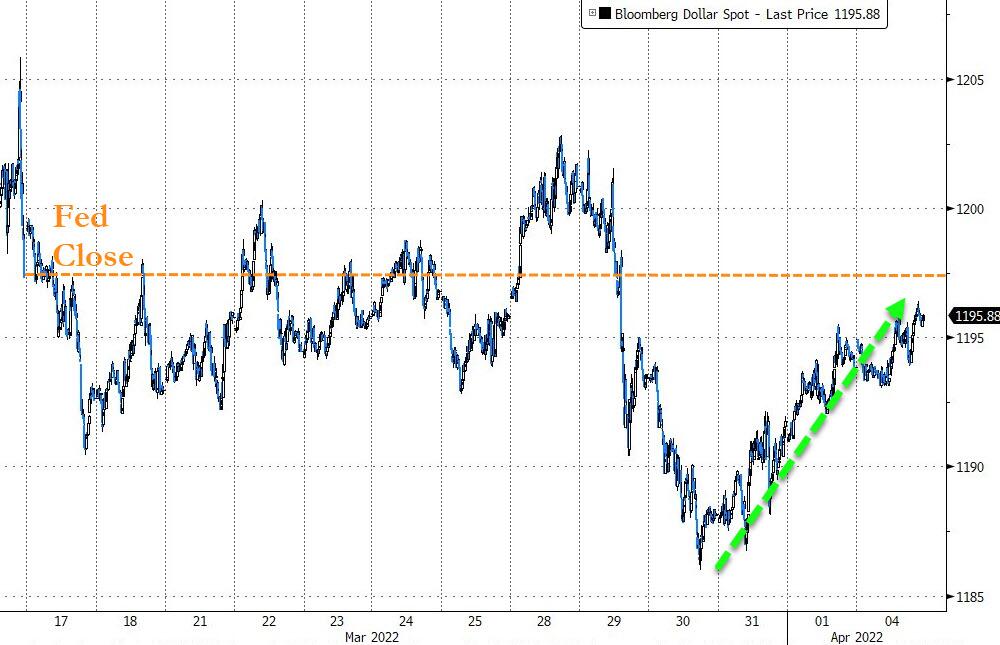
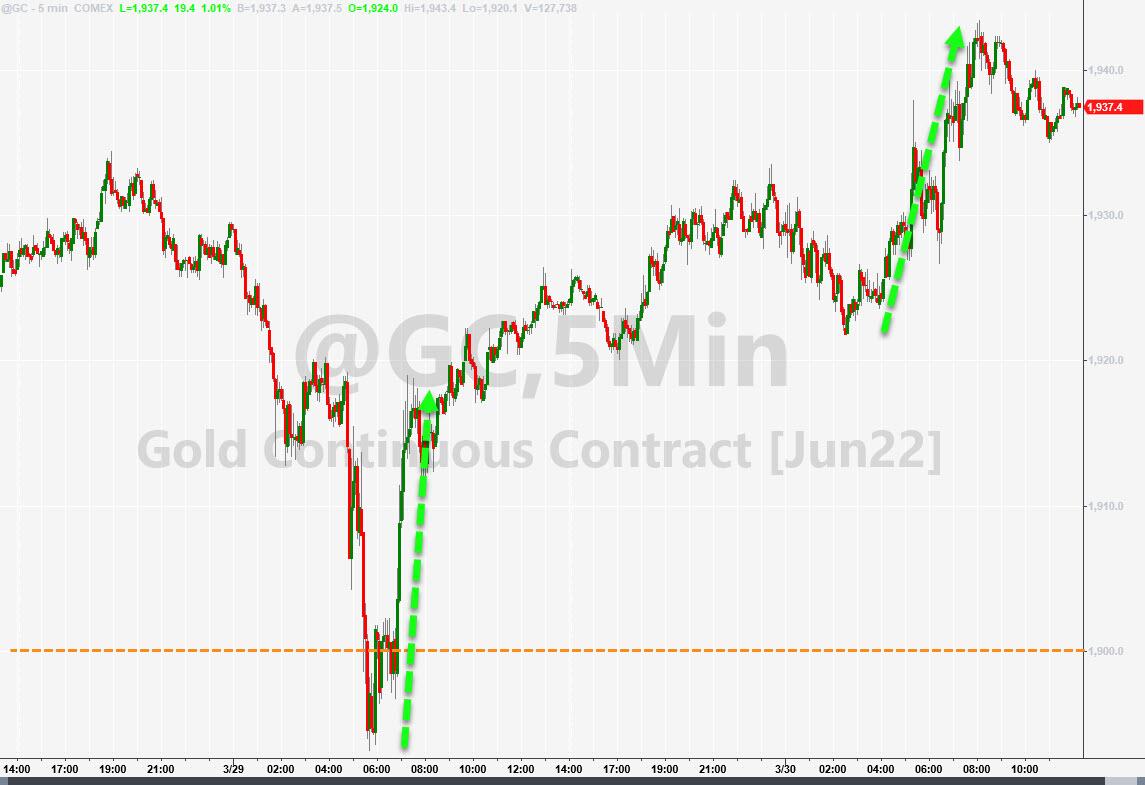
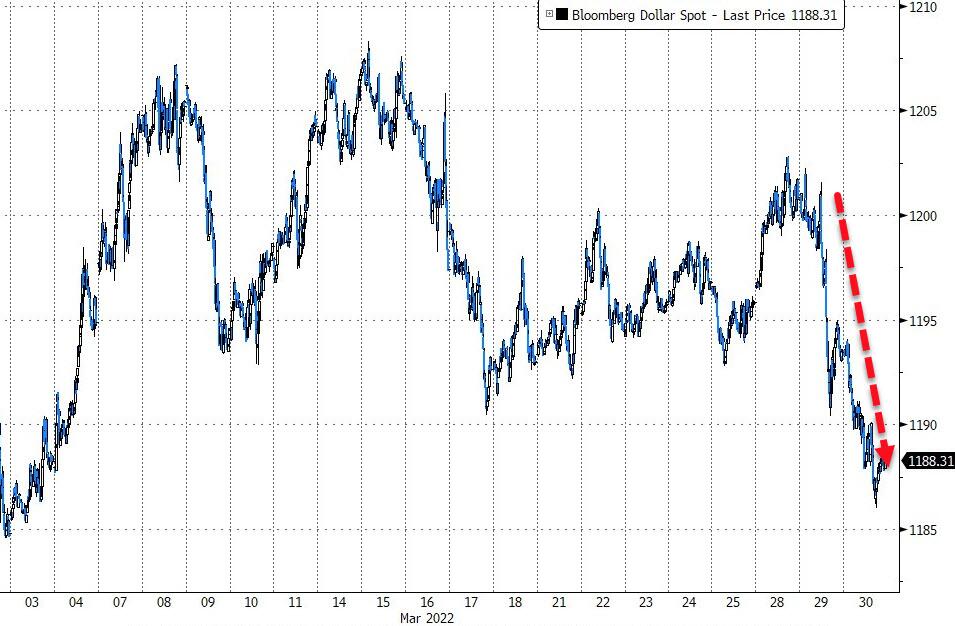
Gold had a positive session, as did the US Dollar, which continued its upward swing for the 3rd day in a row.
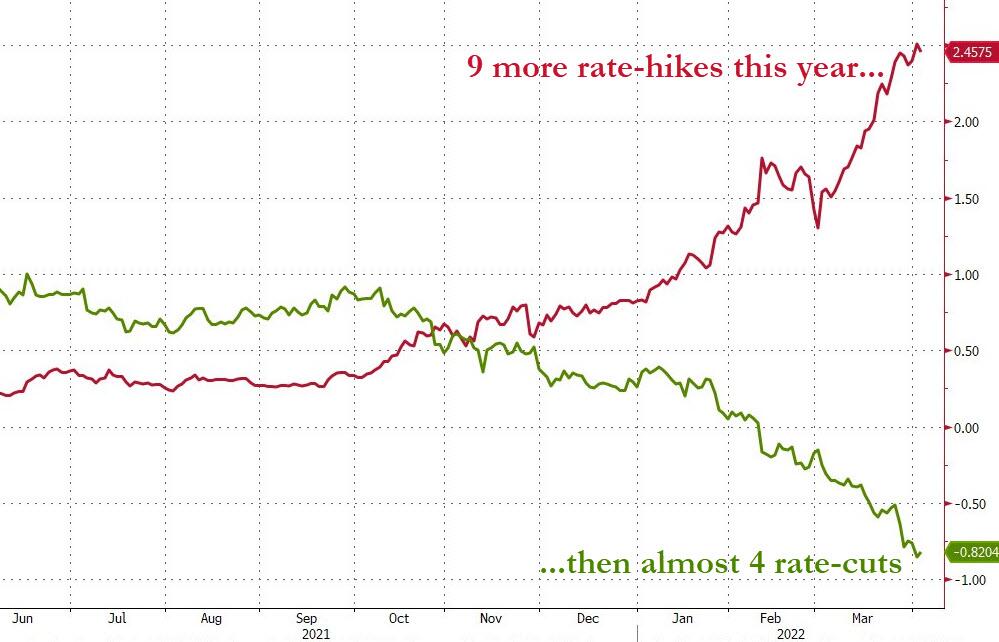
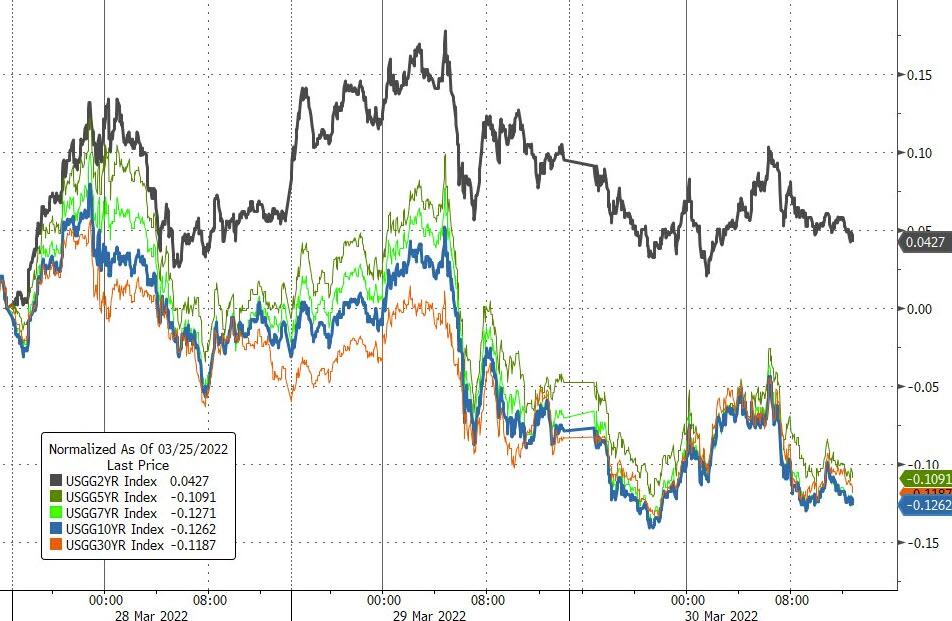
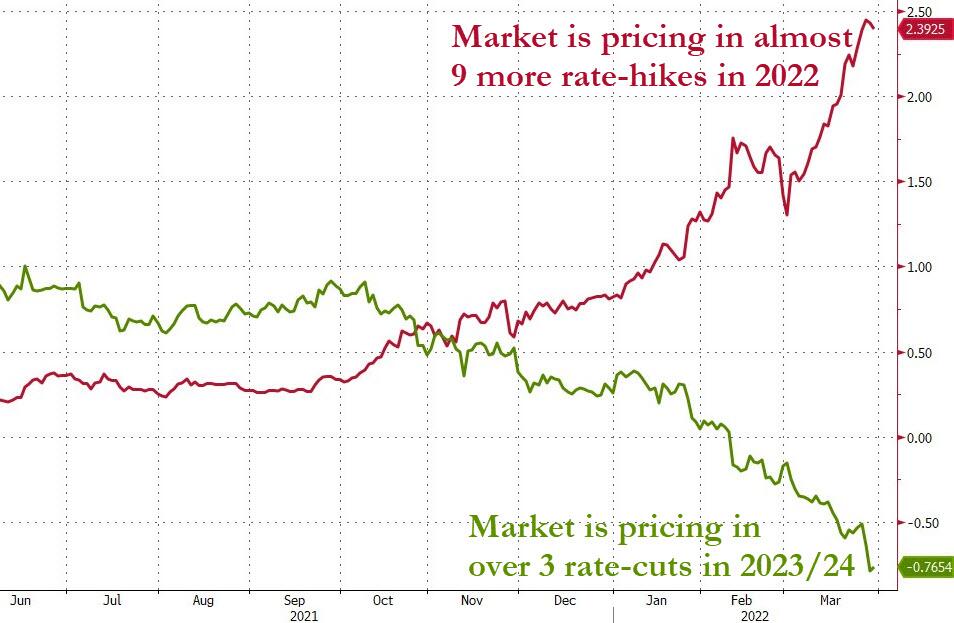
In the end, it’s all about market expectations of rate hikes and future rate cuts, as this chart demonstrates.
Read More
