
- Moving the markets
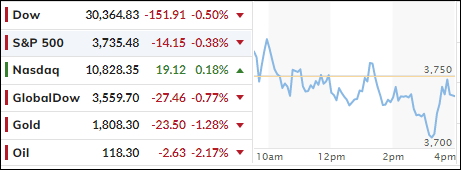
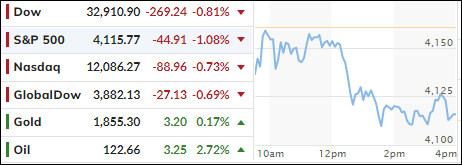
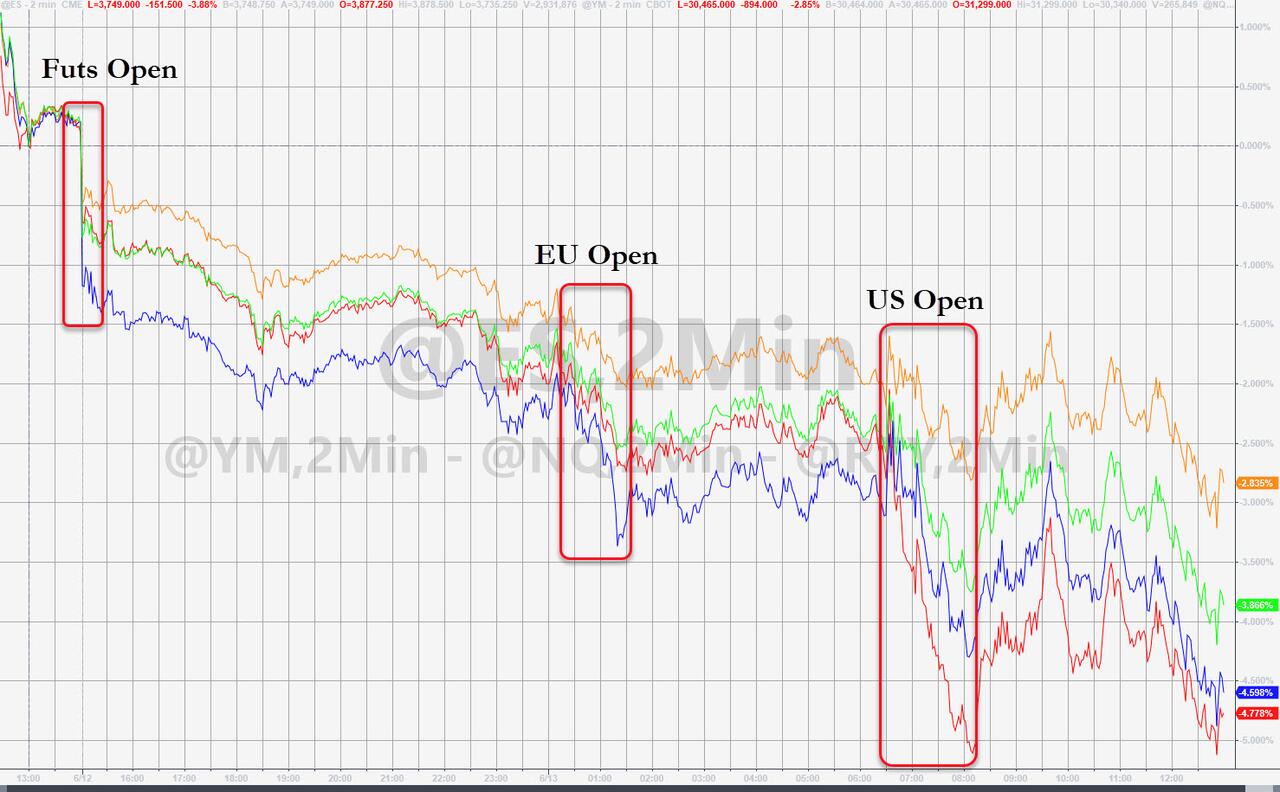
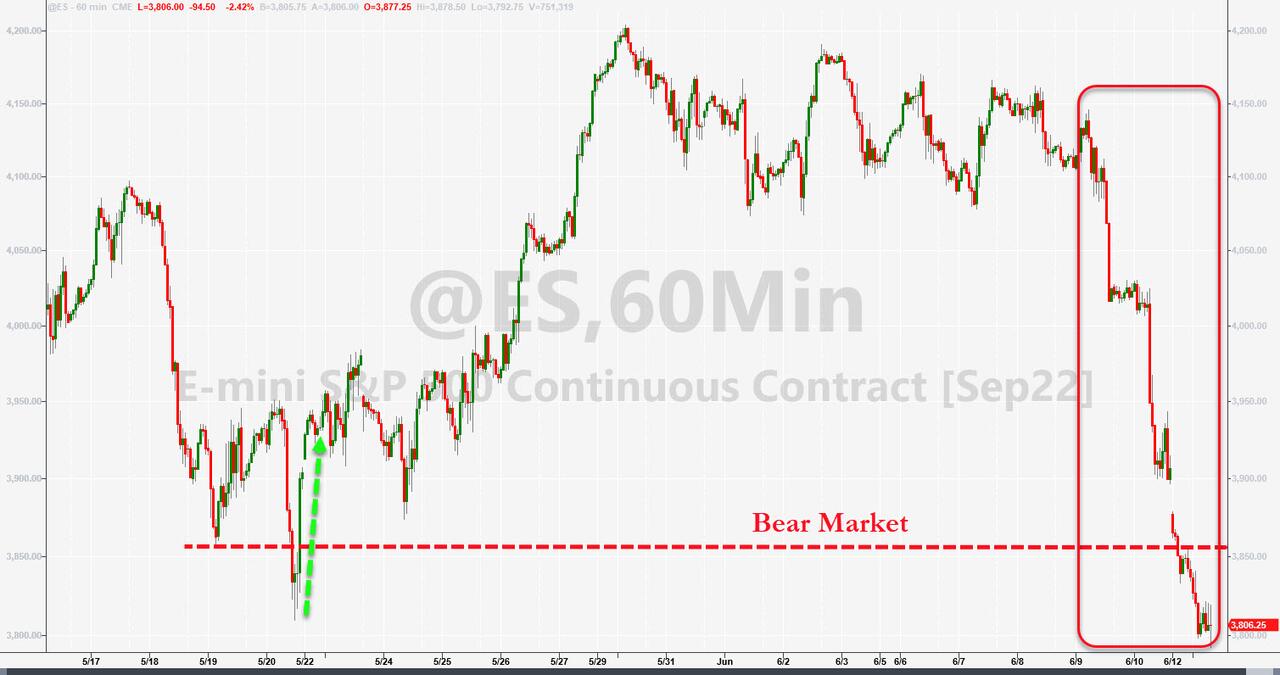
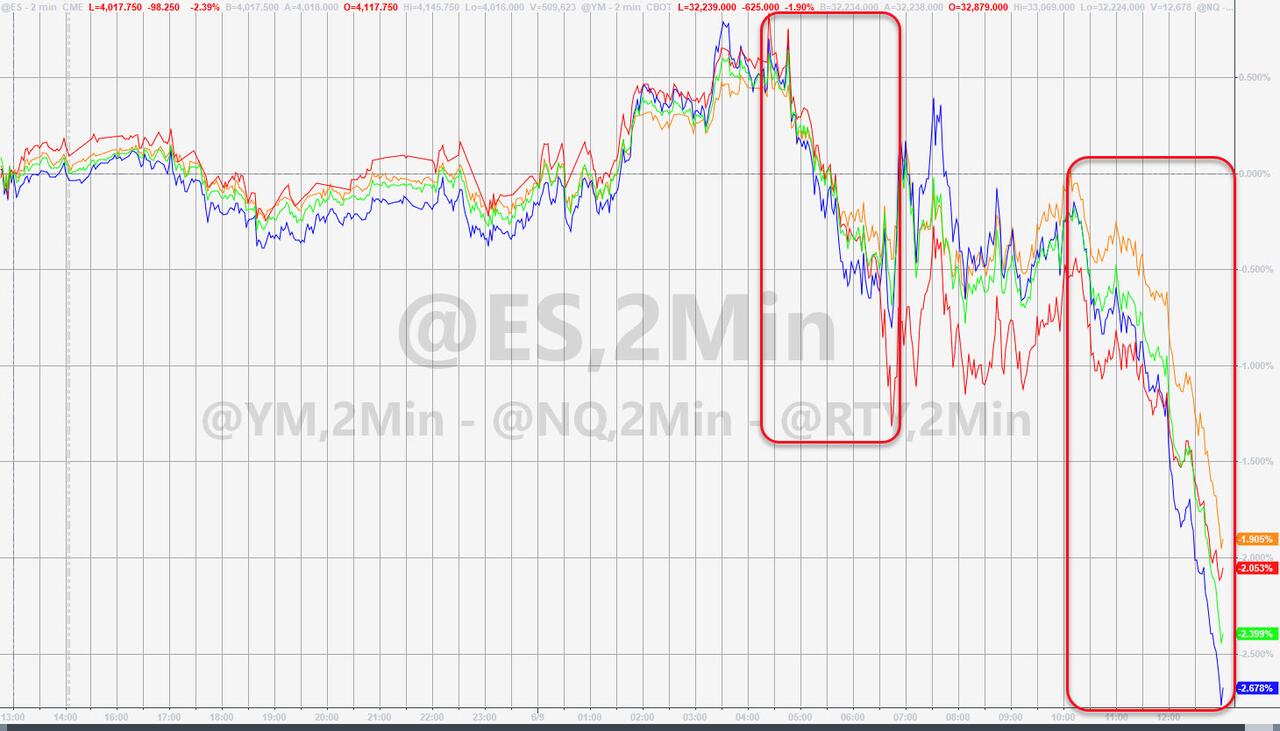
After an early pump, which faded in a hurry, the major indexes dug themselves another hole, but a late session bounce helped avoid a much worse outcome. Still, the Dow and S&P 500 scored another loss, with the Nasdaq clinging to its unchanged line and closing in the green by a tiny margin.
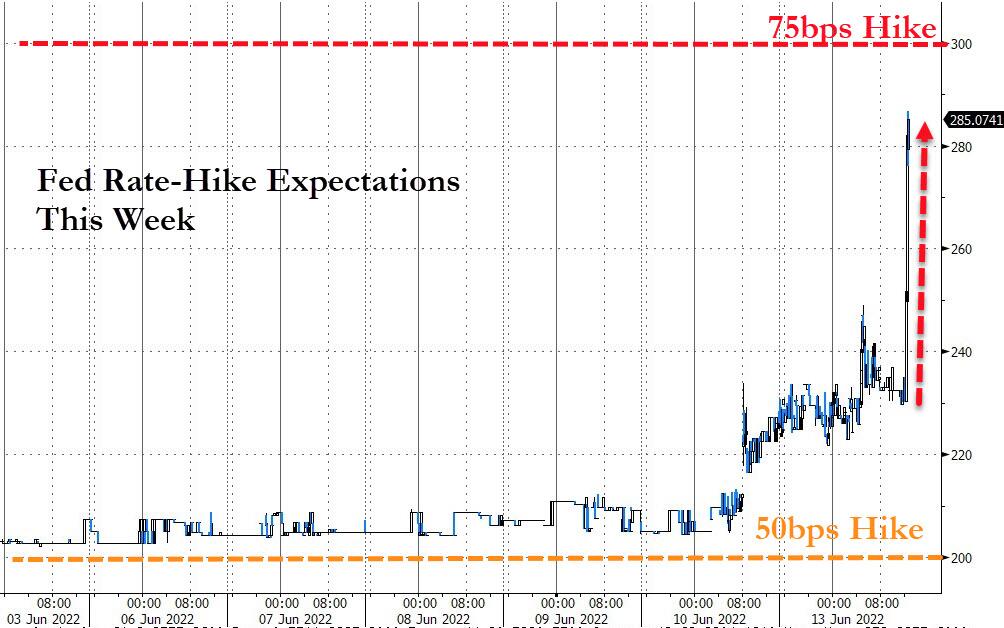
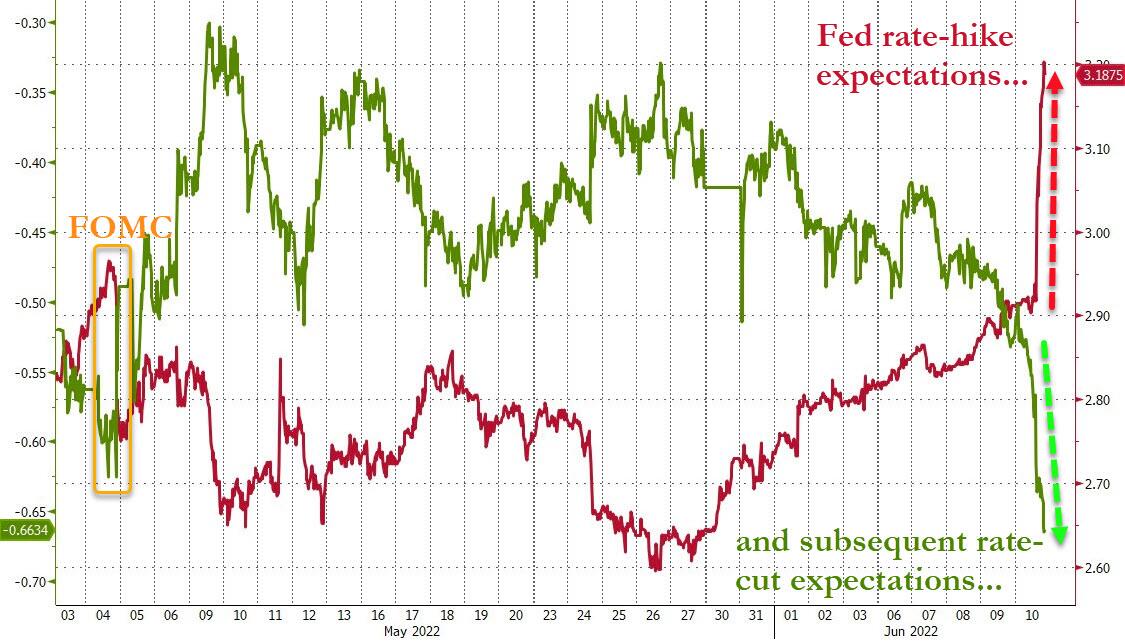
Of course, there was not much bullishness to be found anywhere due to traders’ anxiety ahead of the Fed’s announcement on interest rates tomorrow. The much anticipated 50 bps increase has now been replaced by expectations of 75 bps with an outside possibility of 100 bps. The latter would sure cause havoc with the markets.
Much confidence in the Fed has been lost, as they wasted almost an entire year referring to inflation as being transitory and therefore letting the monster get out of control. As I always said, trying to contain inflation, once it has charted its course, is like putting the tooth paste back in the tube.
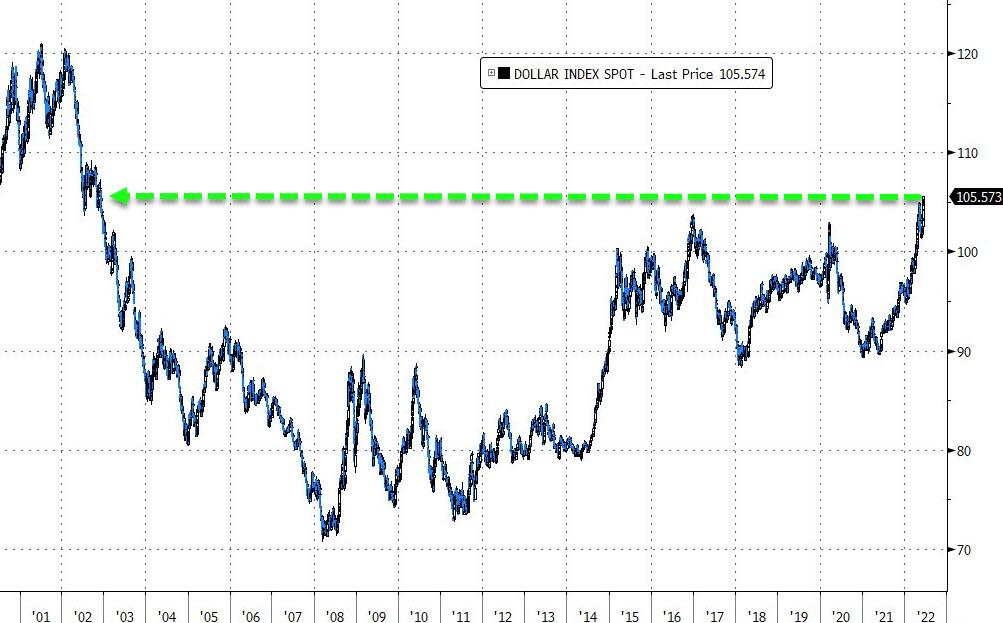
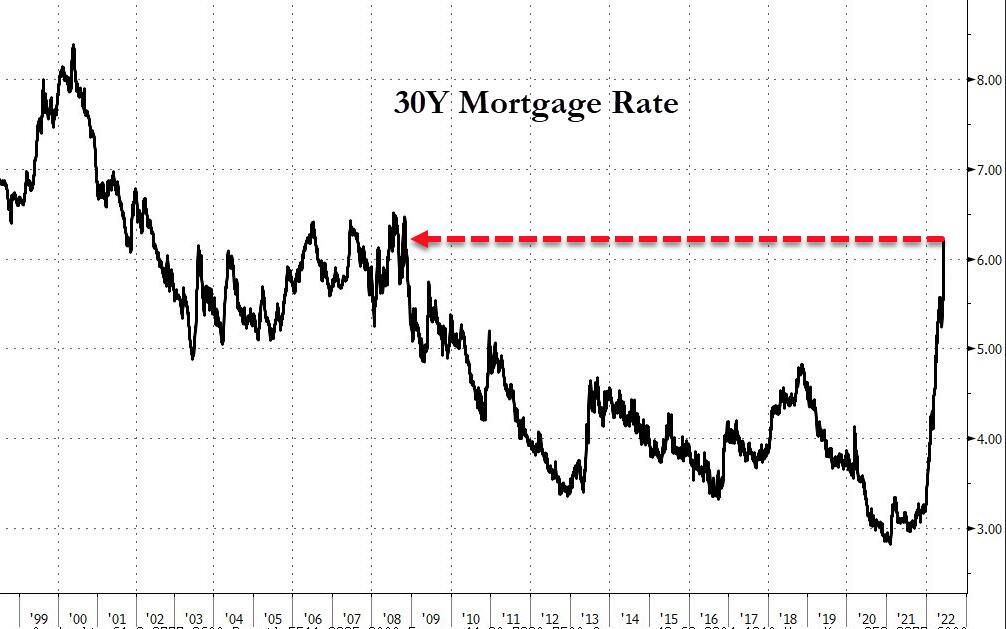
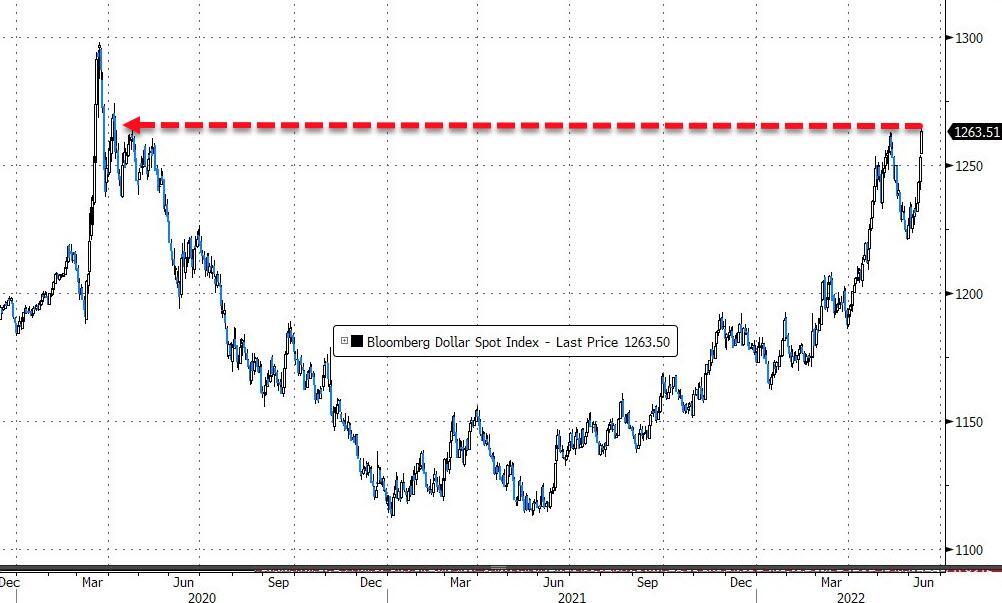
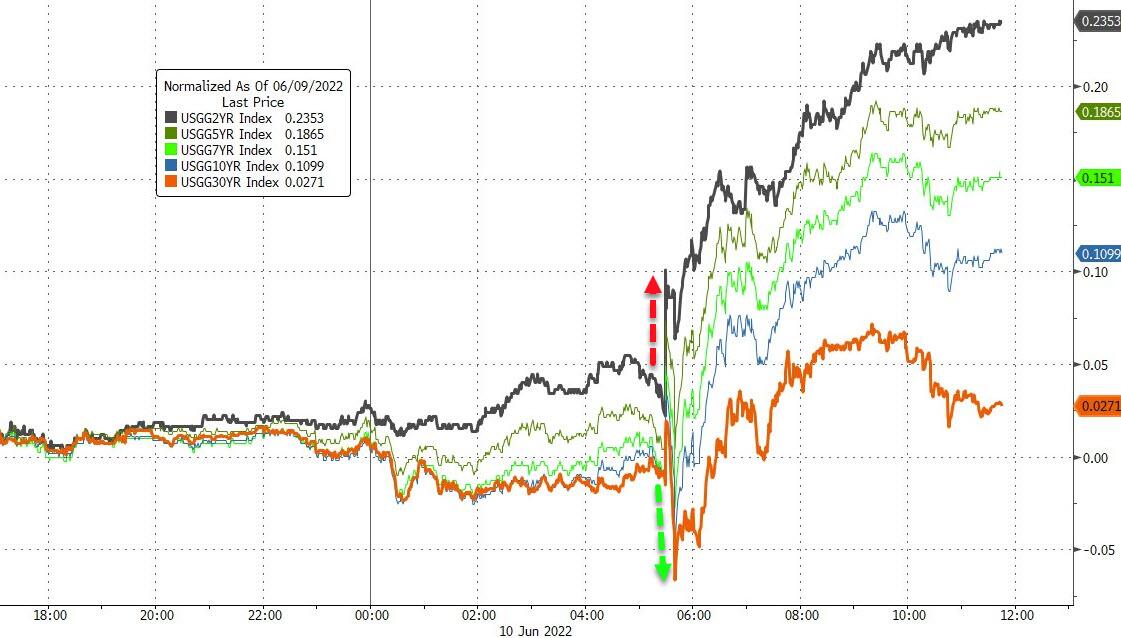
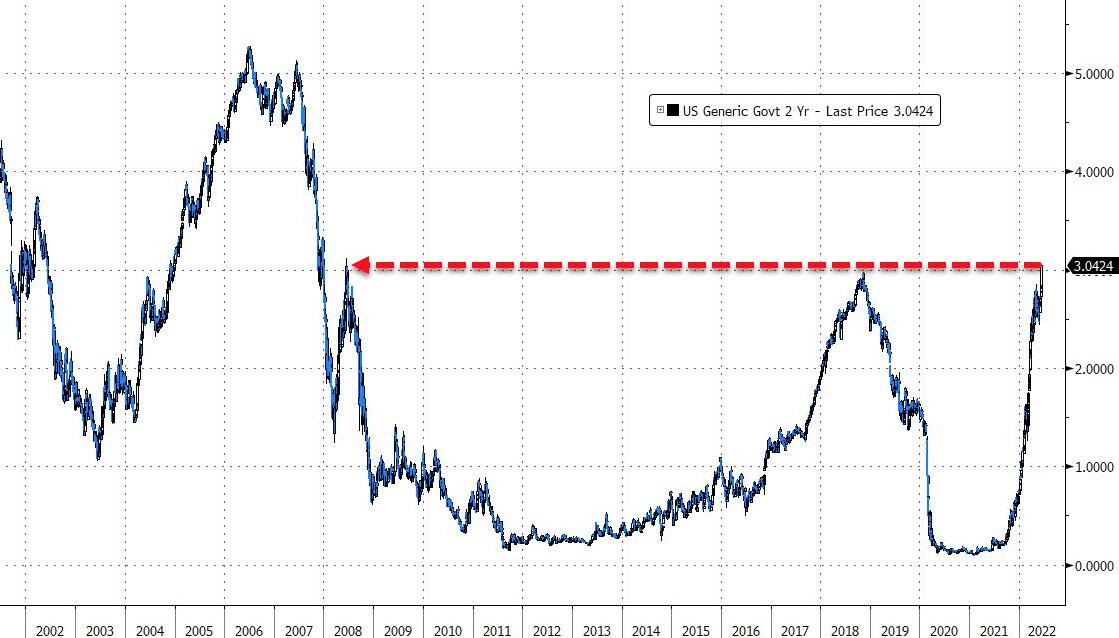
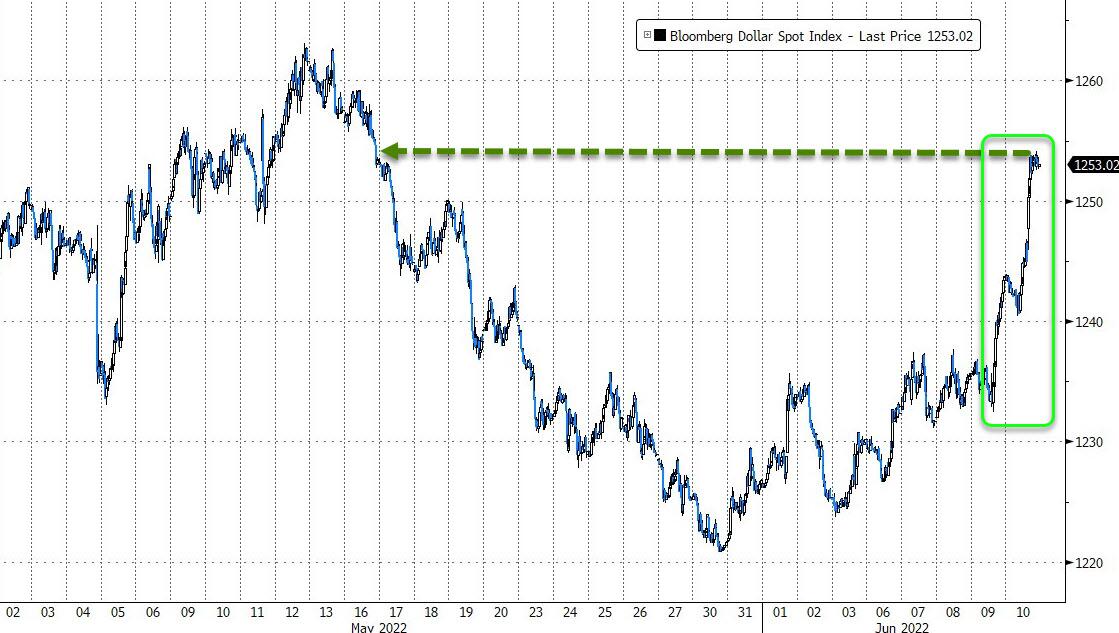
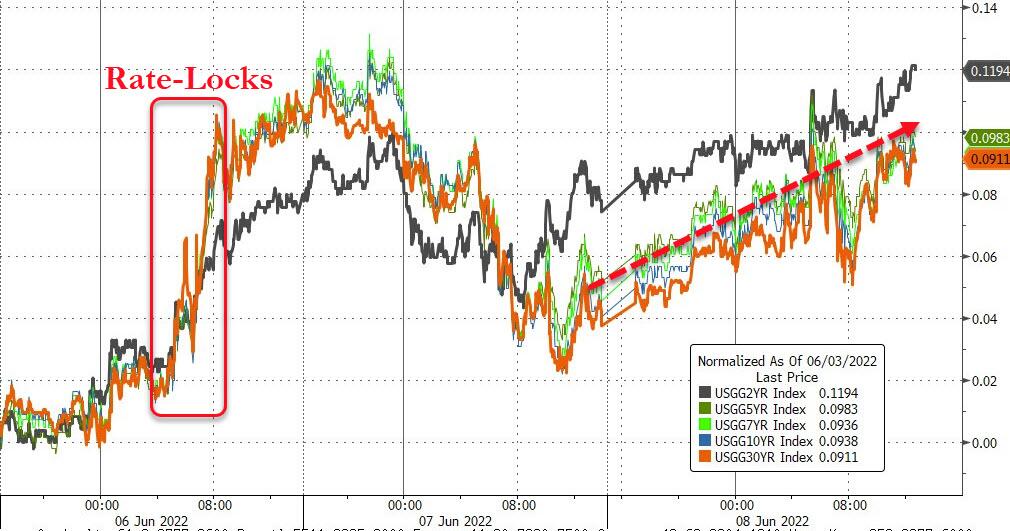
Bond yields were in rally mode with seemingly nothing being able to stop their advances. The 10-year surged above 3.47%, its highest level since 2011, according to ZH. That helped the US Dollar to add 0.37% for the day and reach a high last seen in late 2002.
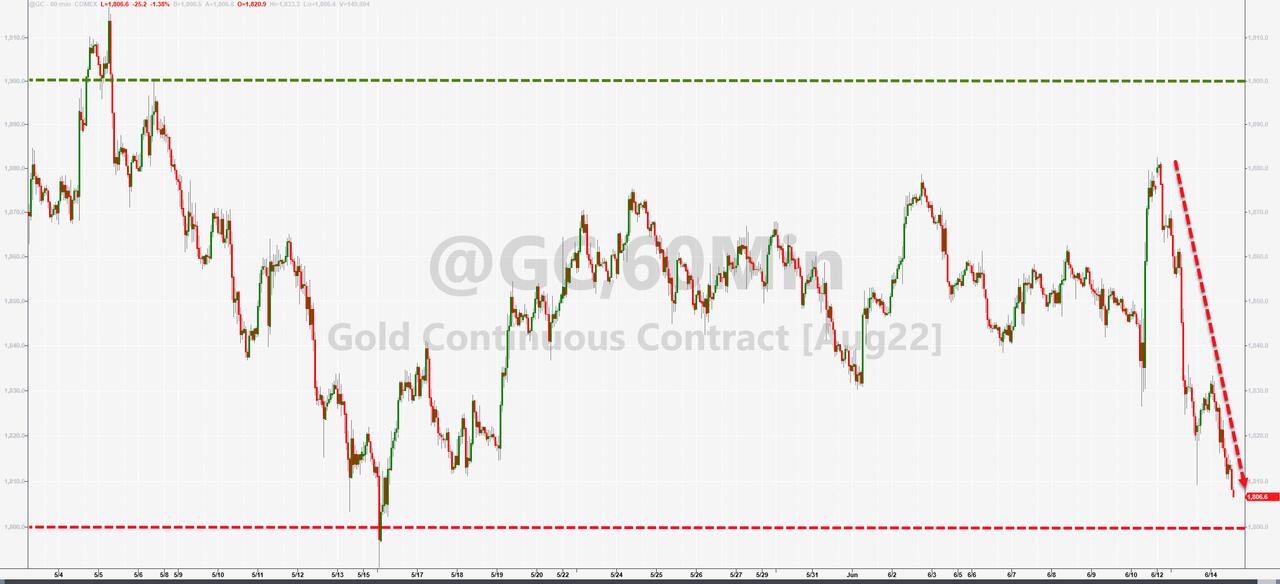
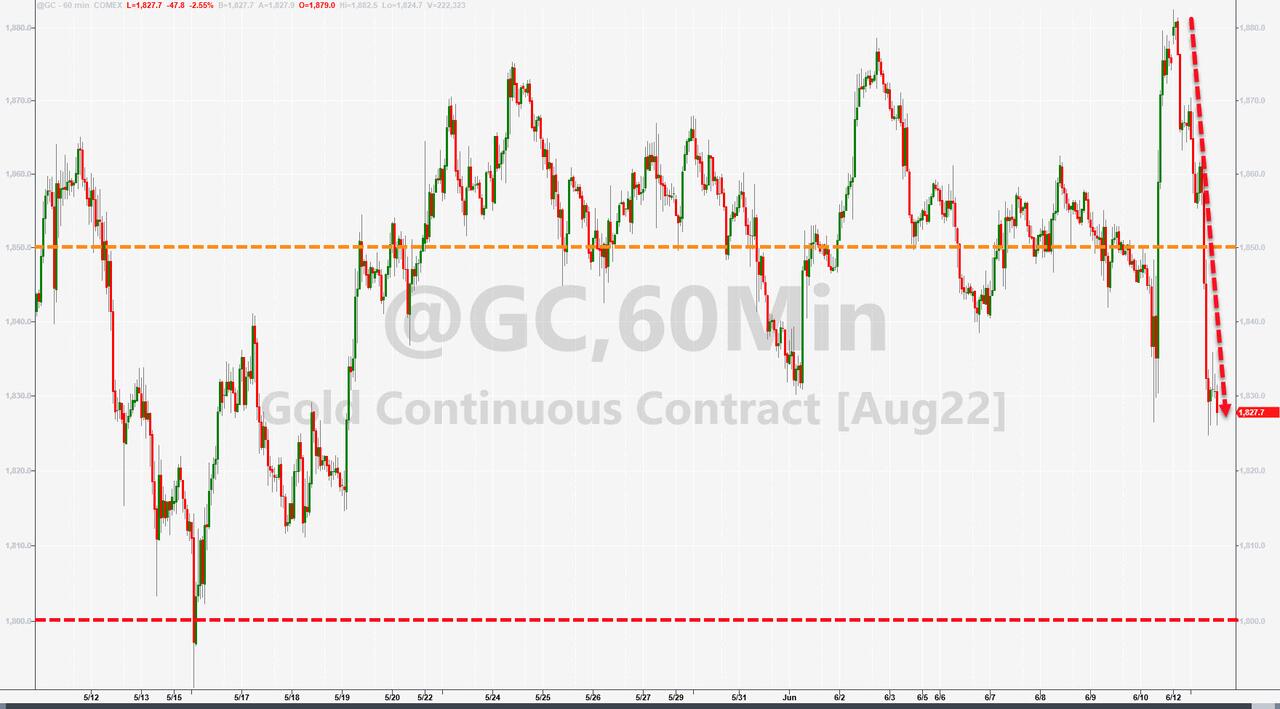
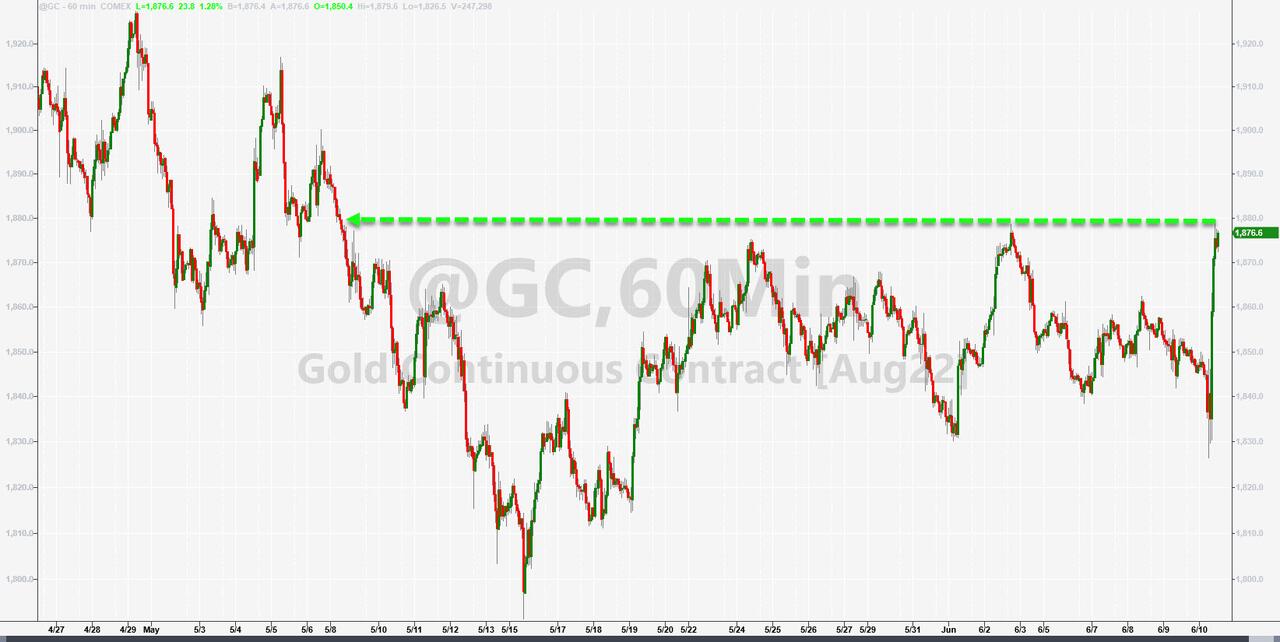
As is the case when the dollar rallies, gold suffers, and today was no exception, as the precious metal headed back down towards its $1,800 level.
All eyes are now on the Fed.
Read More
