
ETF Tracker StatSheet
You can view the latest version here.
EXPLODING INTO THE WEEKEND
- Moving the markets
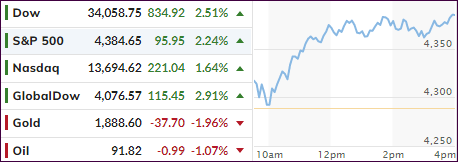
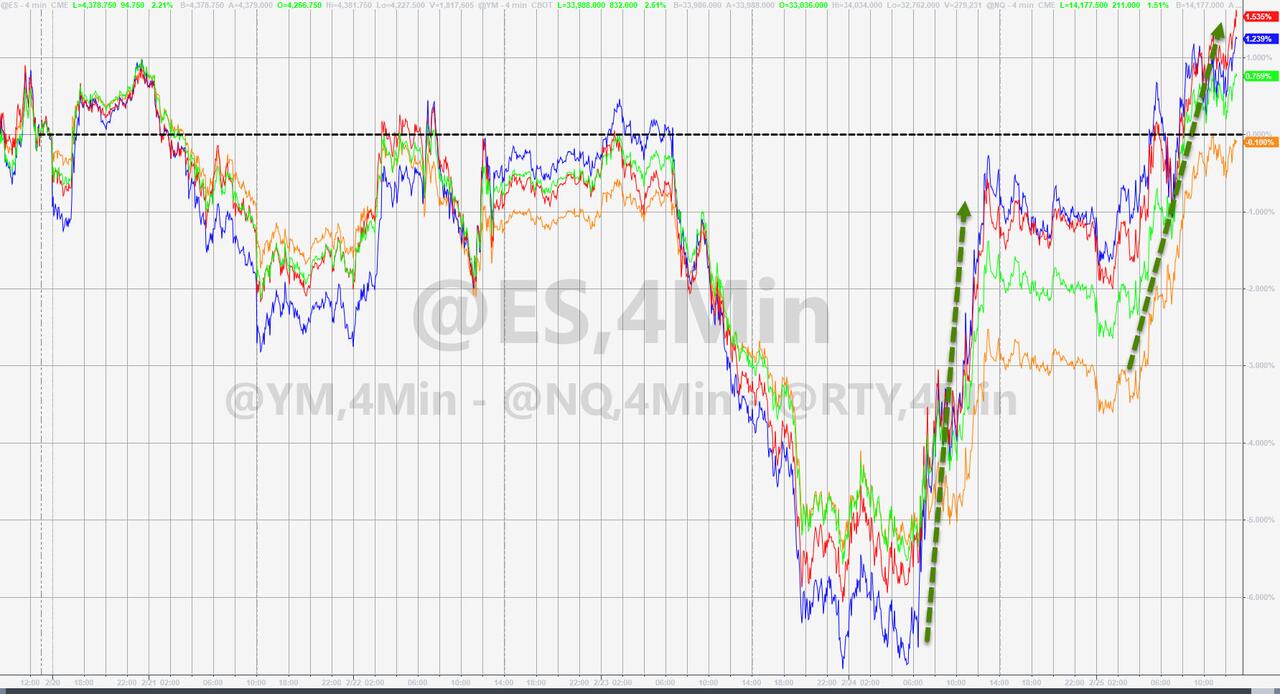
The markets continued their upward explosion from a low of -850 points yesterday, which was entirely wiped out, with the index adding another 800-point for a comeback range of almost 1,700 Dow points—in 2 days.
It now appears that there was an overreaction to the downside with the financial risks being perceived as less than was anticipated. Helping today’s ramp was an announcement by the Kremlin that Putin had agreed to organize negotiations with Ukraine’s Zelensky to discuss Ukraine’s “neutral status.”
ZeroHedge reported the timeline:
- KREMLIN SAYS PUTIN HAS AGREED TO ORGANISE NEGOTIATIONS AFTER ZELENSKIY SAID HE WAS READY TO DISCUSS UKRAINIAN NEUTRALITY
- KREMLIN SAYS WE HAVE NOTIFIED THE UKRAINIANS OF PROPOSAL TO HOLD TALKS IN MINSK
- KREMLIN SAYS PUTIN HAS CALLED BELARUS’S LUKASHENKO TO ORGANISE MINSK TALKS WITH UKRAINE
- KREMLIN SAYS PUTIN HAS AGREED TO ORGANISE NEGOTIATIONS AFTER ZELENSKIY SAID HE WAS READY TO DISCUSS UKRAINIAN NEUTRALITY
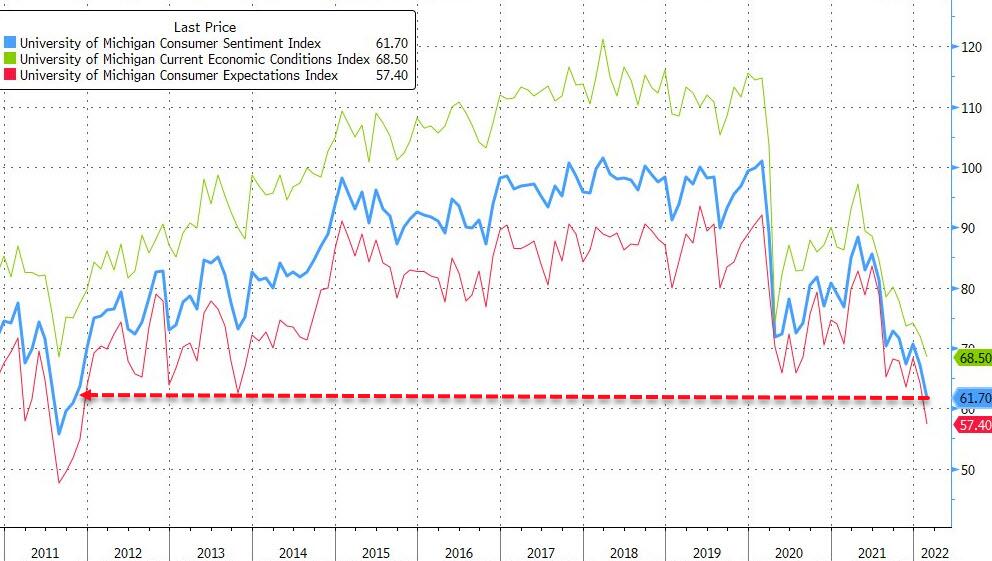
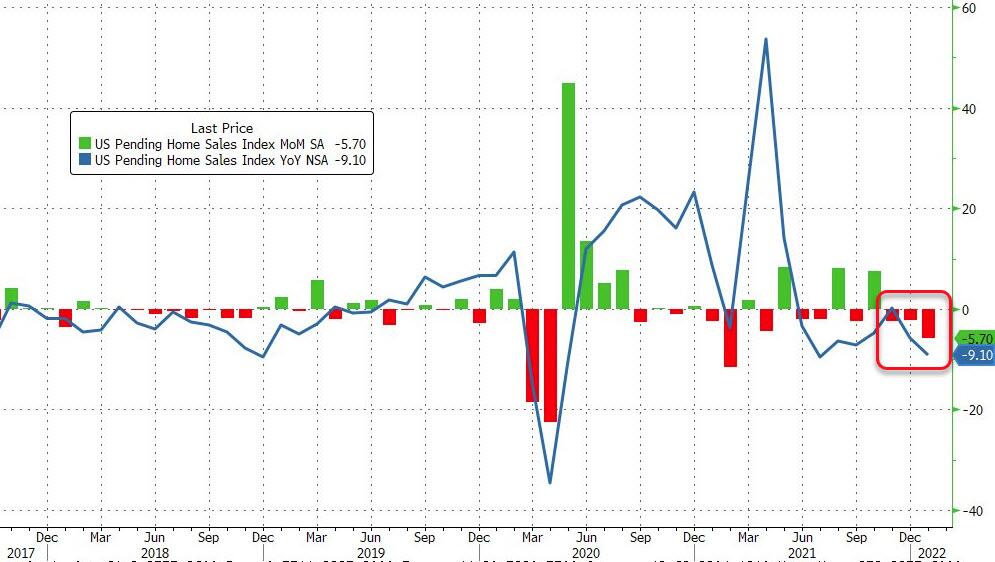
That was sufficient news to keep the bullish mood going, with economic news, global and domestic, being pushed aside or simply being neglected. Nobody cared that Consumer Sentiment remained at an 11-year low, or that US Pending Home Sales plunged in January due to soaring mortgage rates.
Adding insult to injury was the news that the Fed’s favorite inflation indicator came in hotter than expected, as ZH reported, and reached 40-year highs. Personal income experienced its biggest YoY drop since November 2009.
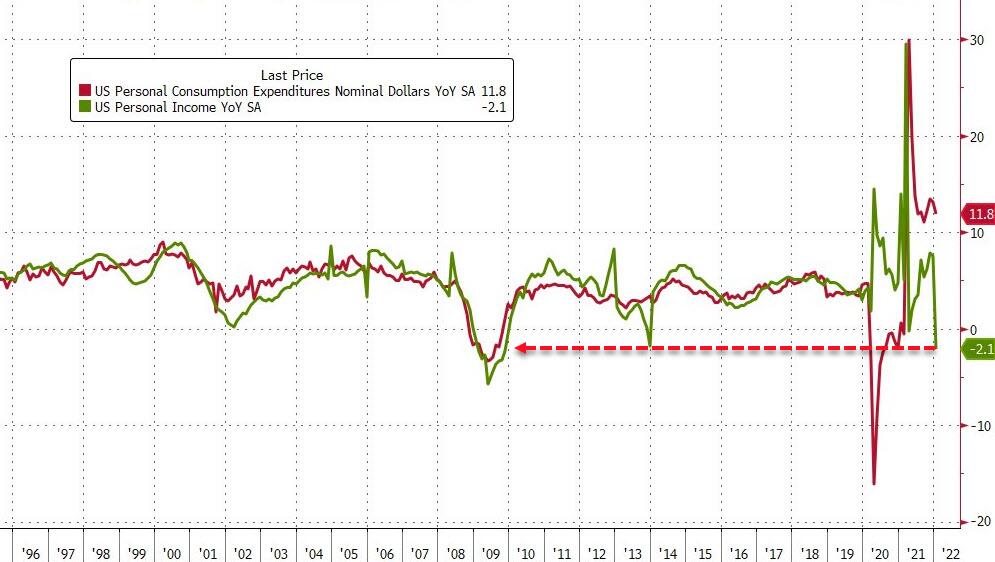
None of this mattered during this Holiday shortened week, which ZH summed up like this:
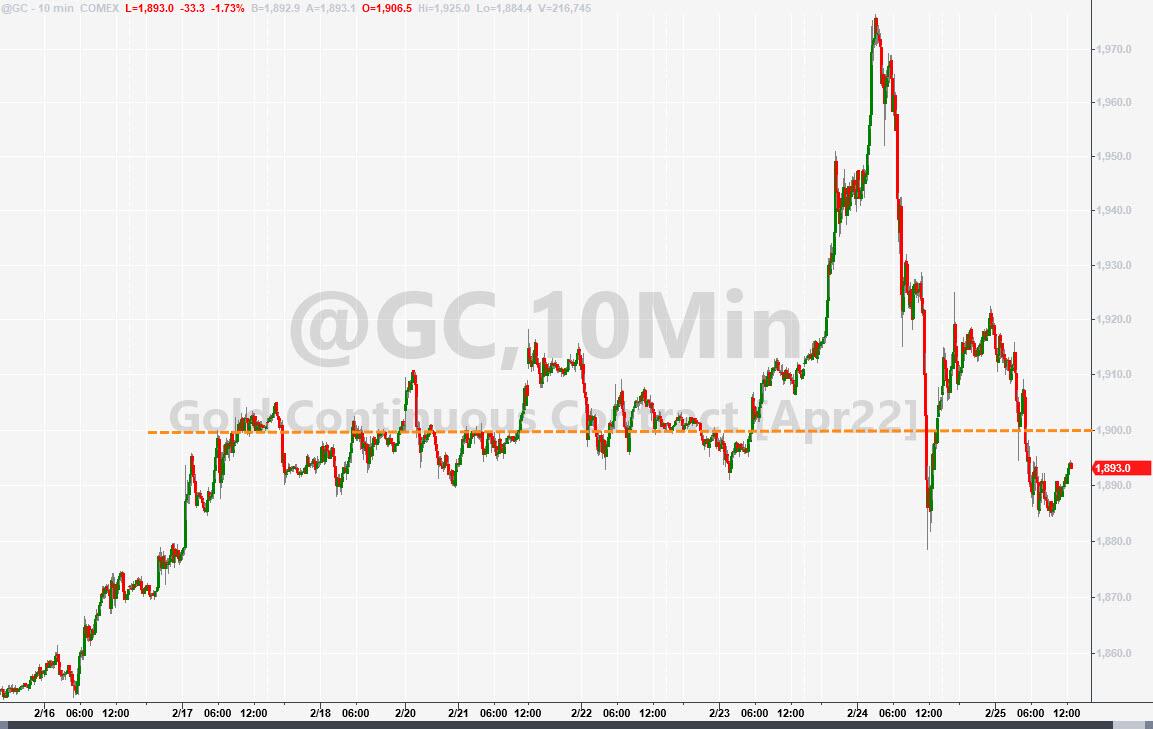
But by the end of the week (during which many bloviated that Putin was potentially starting WW3), stocks were higher, Fed rate-hike trajectory had shifted hawkishly, oil was unchanged, gold was flat, safe-haven Treasuries were sold, cryptos were lower, and Biden approval ratings were higher.
Bond yields closed higher, the US Dollar rallied while oil, crude and precious metals were essentially unchanged over the past 4 trading days.
It sure looked like the ultimate outcome when it comes to “bad news is good news,” and it influenced our trend tracking status, whose southerly direction has suddenly become questionable, that is if this rebound indeed has legs.
Right now, it looks like we’ve experienced one of the biggest head fakes I have seen in decades with the bearish trend reversing within 2 days and pushing our main directional indicator, the Domestic TTI, back into bullish territory—although by only a fraction, as you can see in section 3 below.
Whether that will potentially turn into a new “Buy” signal or simply be a hiccup in an ongoing bear market, is the unanswered question. I am sure, we may get some hints next week as to whether economic realty will take center stage again.
2. ETFs in the Spotlight
In case you missed the announcement and description of this section, you can read it here again.
It features some of the 10 broadly diversified domestic and sector ETFs from my HighVolume list as posted every Saturday. Furthermore, they are screened for the lowest MaxDD% number meaning they have been showing better resistance to temporary sell offs than all others over the past year.
The below table simply demonstrates the magnitude with which these ETFs are fluctuating above or below their respective individual trend lines (%+/-M/A). A break below, represented by a negative number, shows weakness, while a break above, represented by a positive percentage, shows strength.
For hundreds of ETF choices, be sure to reference Thursday’s StatSheet.
For this just closed out domestic “Buy” cycle, here’s how some of our candidates have fared:
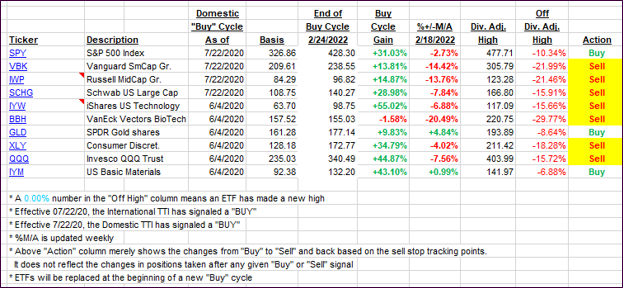
Click image to enlarge.
Again, the %+/-M/A column above shows the position of the various ETFs in relation to their respective long-term trend lines, while the trailing sell stops are being tracked in the “Off High” column. The “Action” column will signal a “Sell” once the -12% point has been taken out in the “Off High” column, which has replaced the prior -8% to -10% limits.
3. Trend Tracking Indexes (TTIs)
In what only can be considered an outlier move, our TTIs both reversed and closed the week slightly in bullish territory. We’ll have to wait and see if this indeed signals a turnaround or merely represents a bear market bounce.
This is how we closed 02/25/2022:
Domestic TTI: +0.29% above its M/A (prior close -2.24%)—Sell signal effective 02/24/2022.
International TTI: +0.17% above its M/A (prior close -2.42%)—Buy signal effective 07/22/2020.
Disclosure: I am obliged to inform you that I, as well as my advisory clients, own some of the ETFs listed in the above table. Furthermore, they do not represent a specific investment recommendation for you, they merely show which ETFs from the universe I track are falling within the specified guidelines.
All linked charts above are courtesy of Bloomberg via ZeroHedge.
———————————————————-
WOULD YOU LIKE TO HAVE YOUR INVESTMENTS PROFESSIONALLY MANAGED?
Do you have the time to follow our investment plans yourself? If you are a busy professional who would like to have his portfolio managed using our methodology, please contact me directly or get more details.
Contact Ulli