
ETF Tracker StatSheet
You can view the latest version here.
OPTIONS EXPIRATIONS DAY WHACKS MARKETS
- Moving the markets
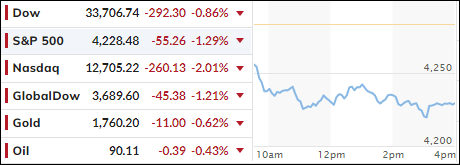
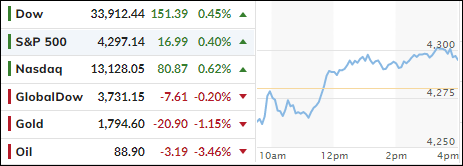
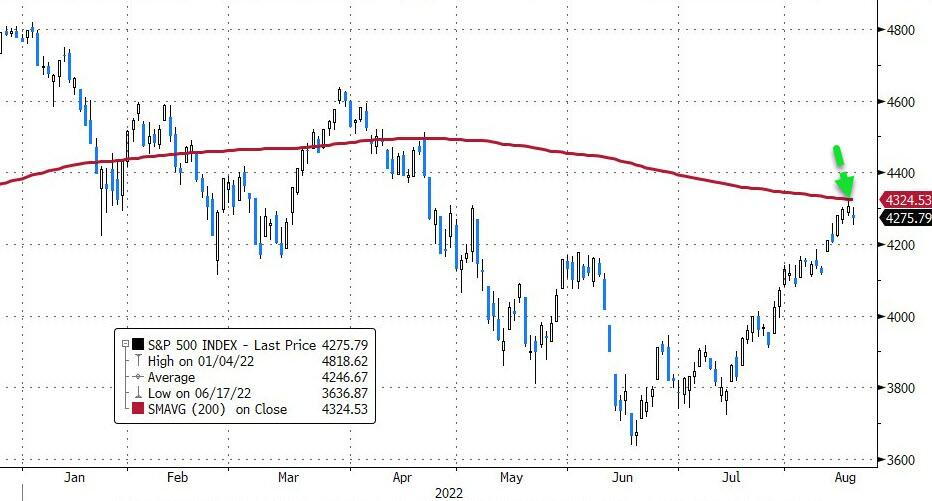
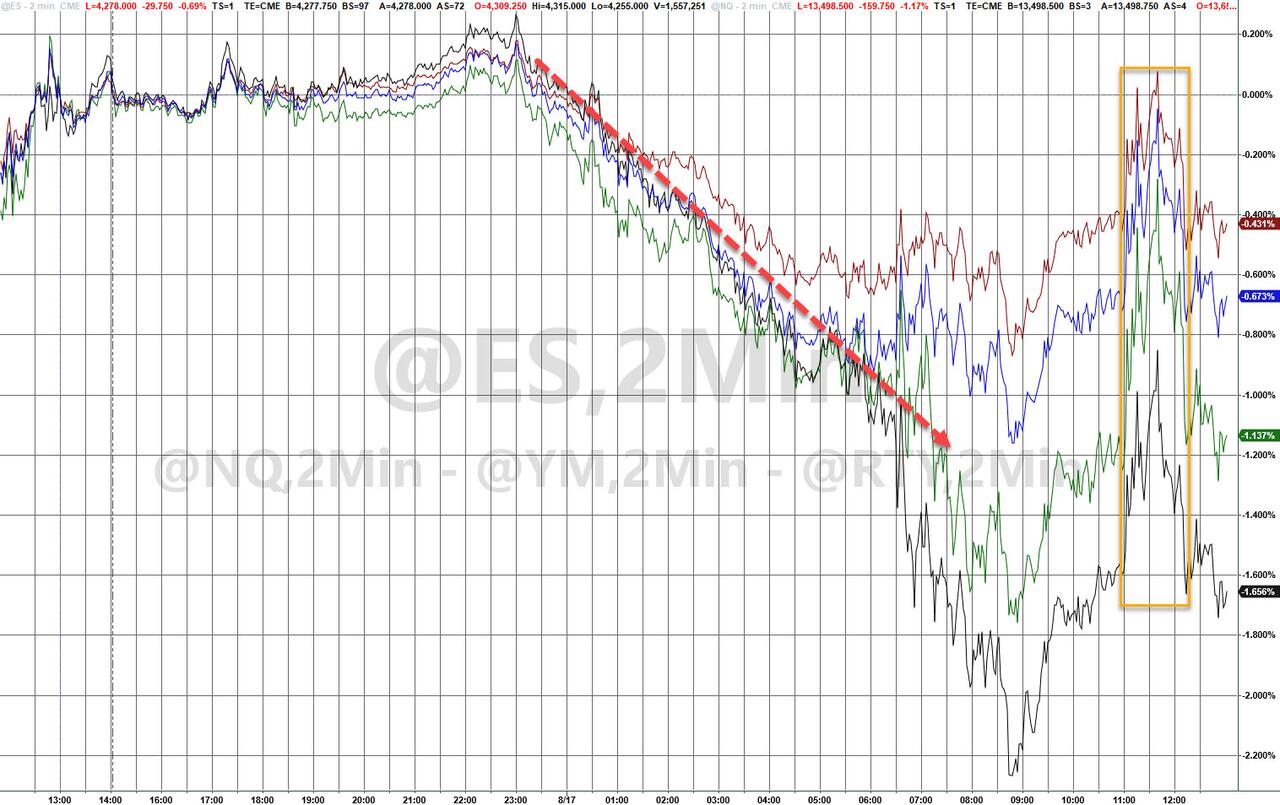
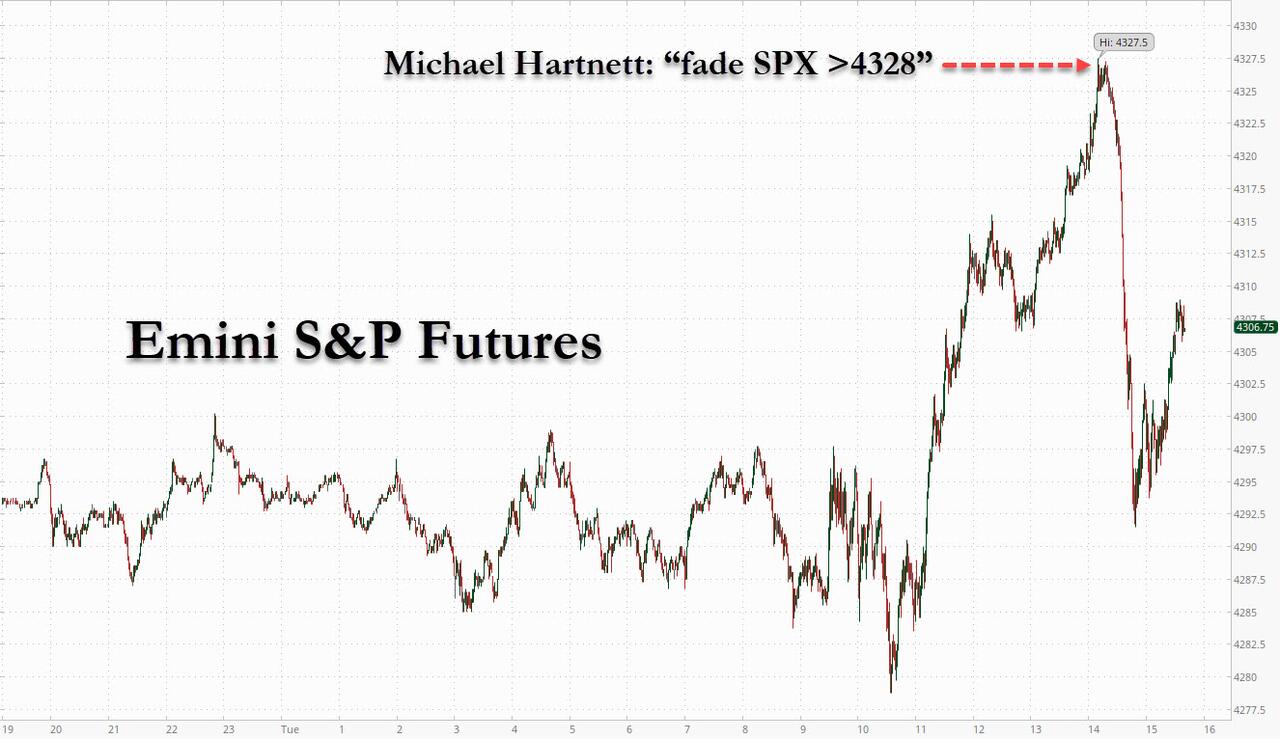
Bulls were nowhere to be found today, as the $2.1 Trillion options expiration day exacted a pound of flesh from the markets, thereby breaking the S&P 500’s 4-week win streak. The summer rally hit the skids and brought thoughts of this being the end of the bear market bounce back into play.
A variety of forces, besides options expirations, contributed to the sour mood on Wall Street. The Fed minutes from the July meeting, as well as Federal Reserve President Bullard’s comments that the Central Bank would likely continue hiking rates in the near term, which again dashed hopes for the infamous “dovish pivot.”
Then Richmond President Barkin pulled that rug out even further with this comment:
“The Fed must curb inflation even if this causes a recession.”
Ouch!
Goldman Sachs laid out this list of items, which added to the sell-off:
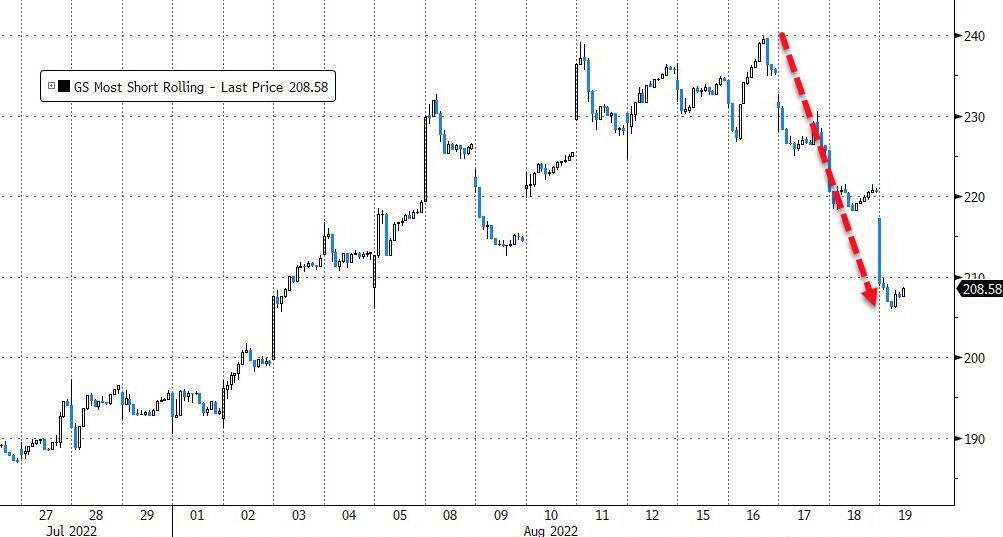
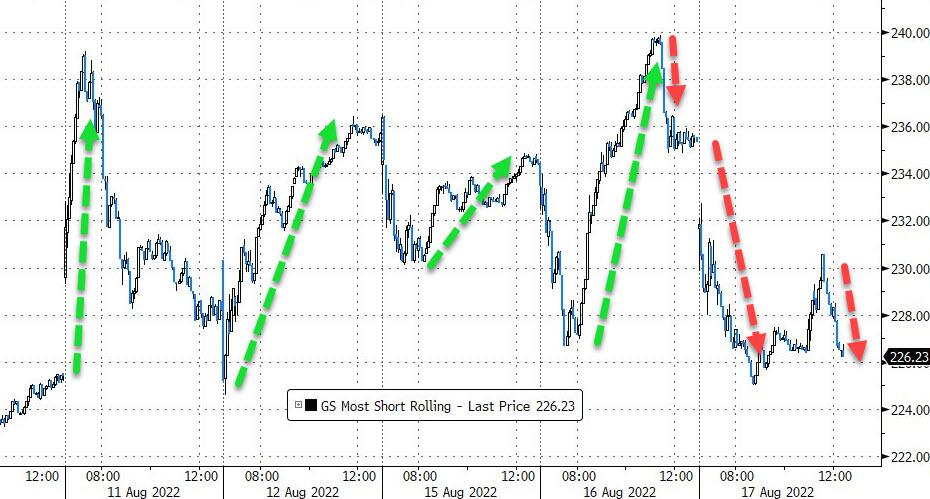
- Retail Meme Stocks Unraveling – BBBY -40%…Imagine shorts will be coming out of the woodwork
- Crypto following suit
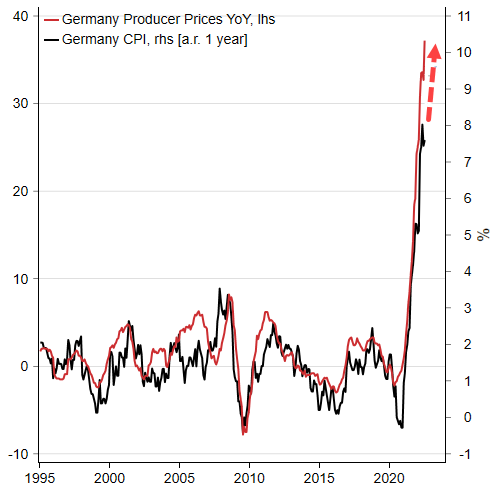
- German PPI Came in at Record Highs – 5.7% MoM rise and 37.2% YoY
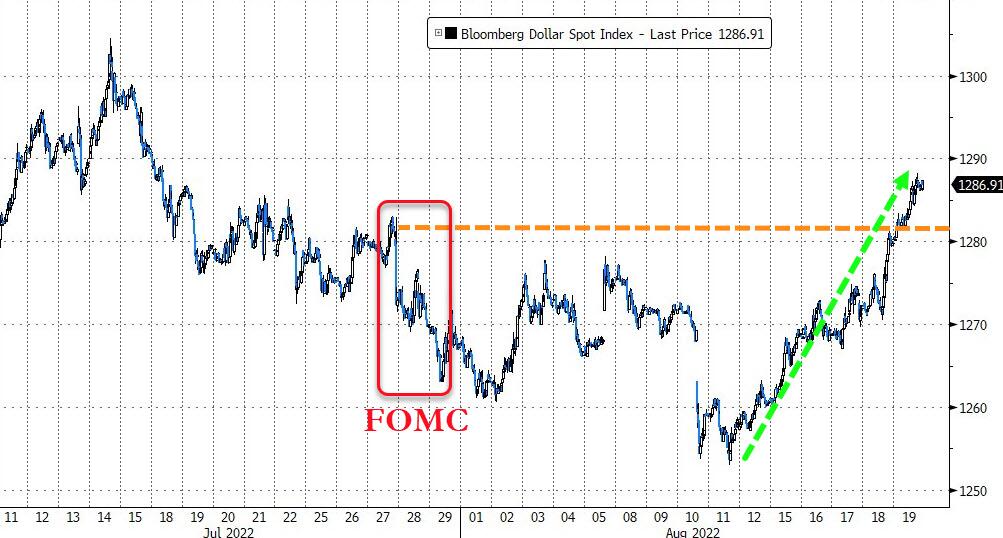
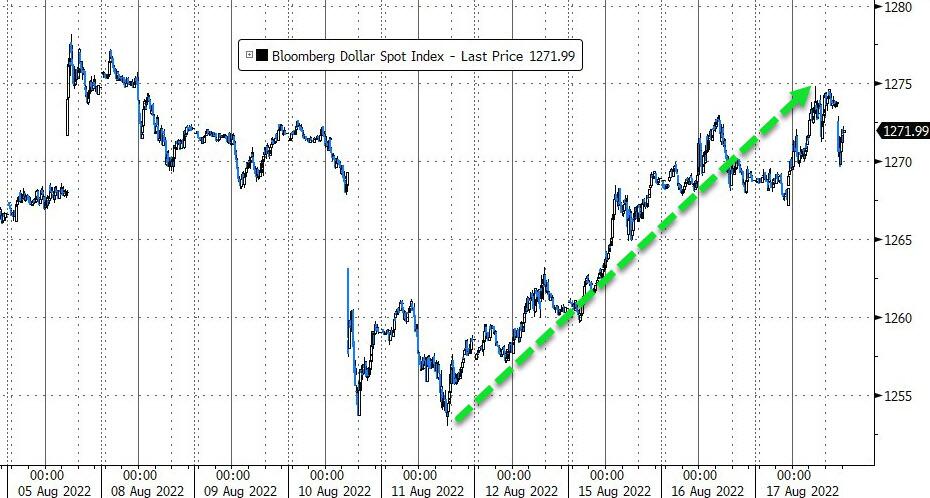
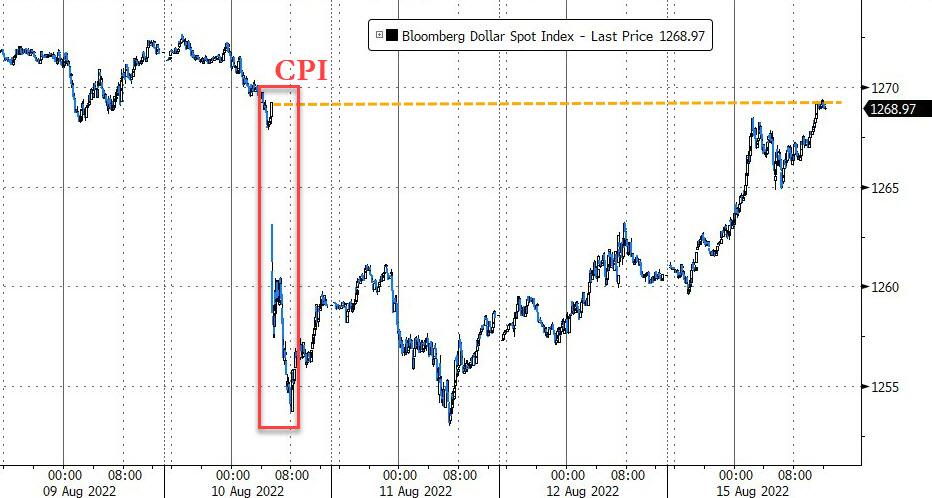
- DXY Strong following suit – EURUSD testing parity…
- Bullard called for 75bps in September – yet mkt still pricing in 50/50 short of a 75bps hike in Sept.
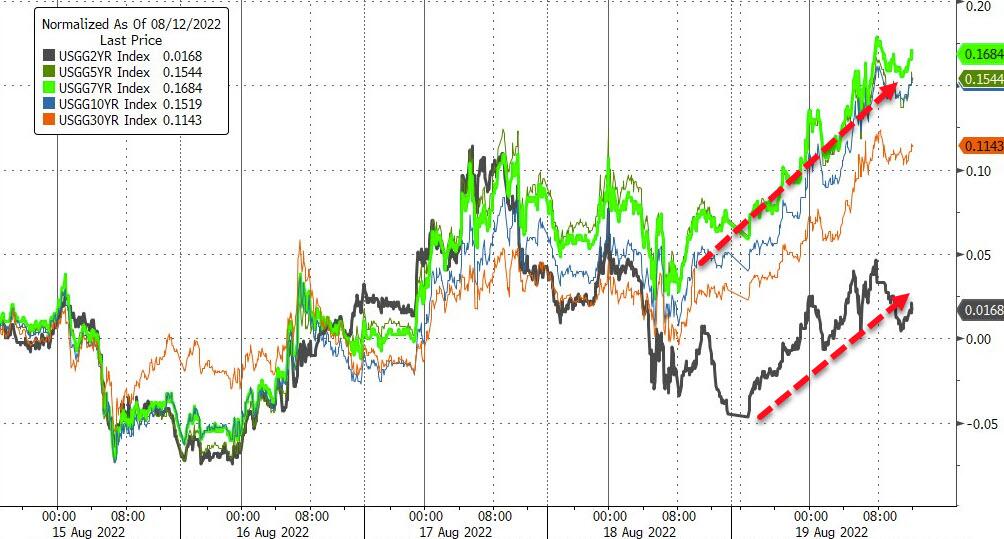
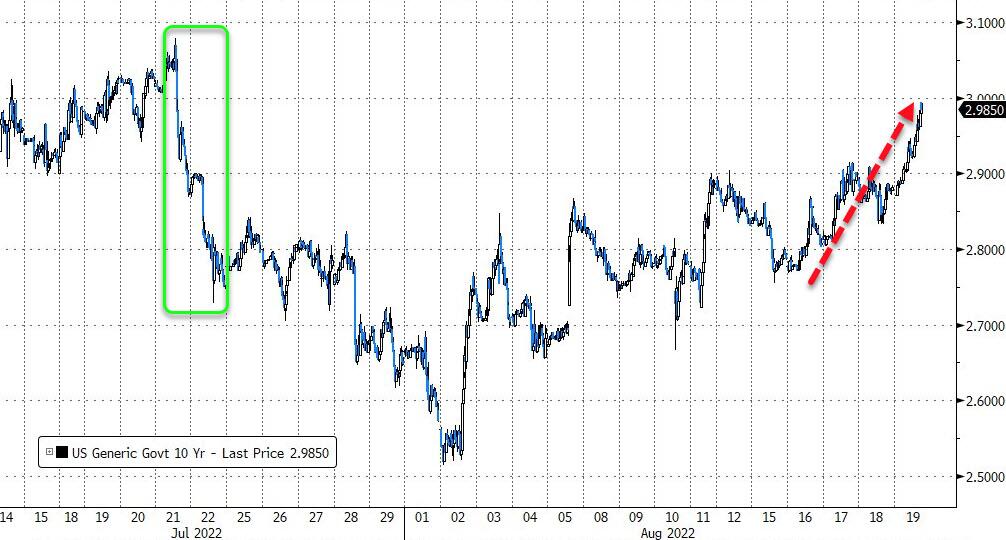
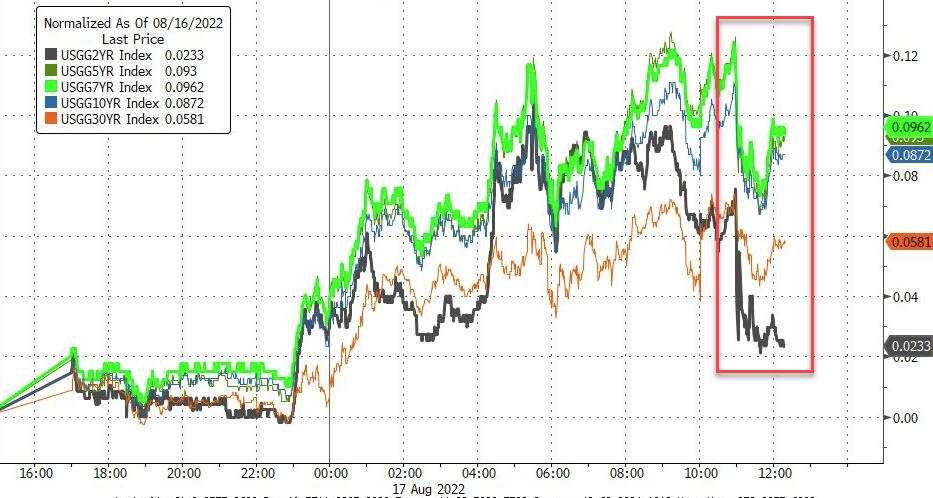
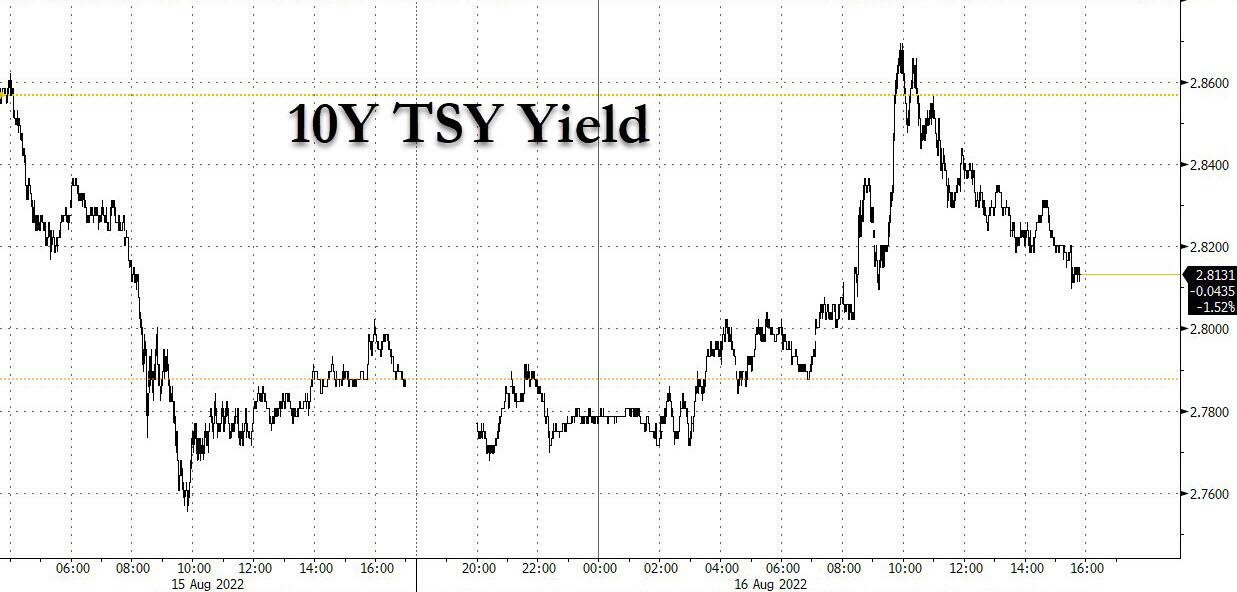
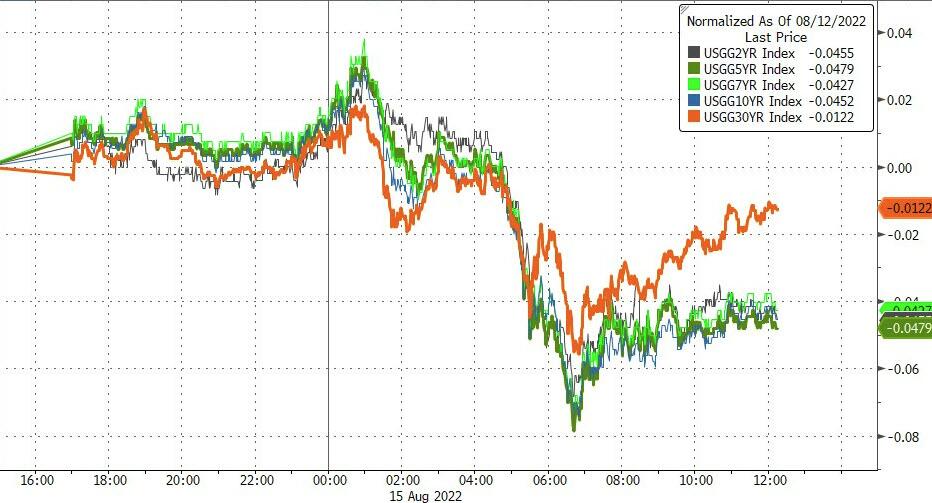
- Yields Higher following suit – 10y at 2.97…
- Large Expiry – $2T in options rolling off
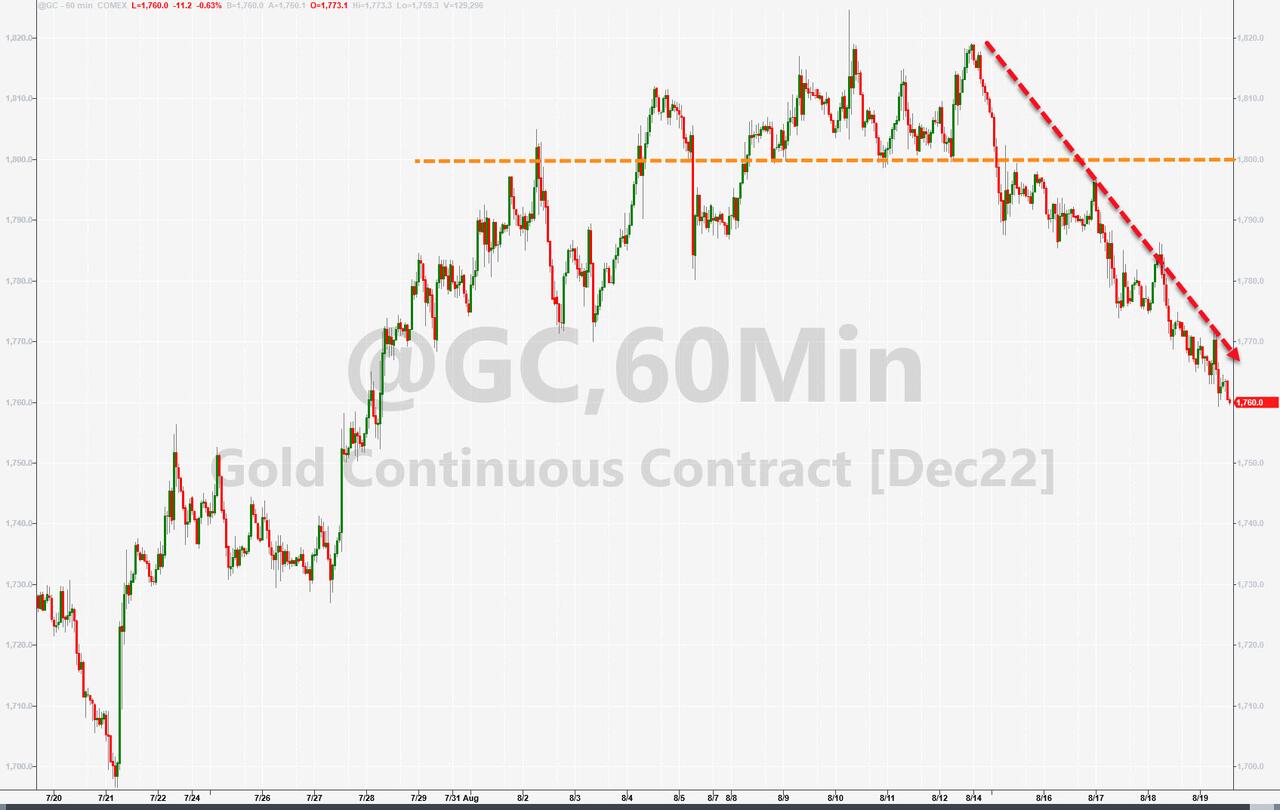
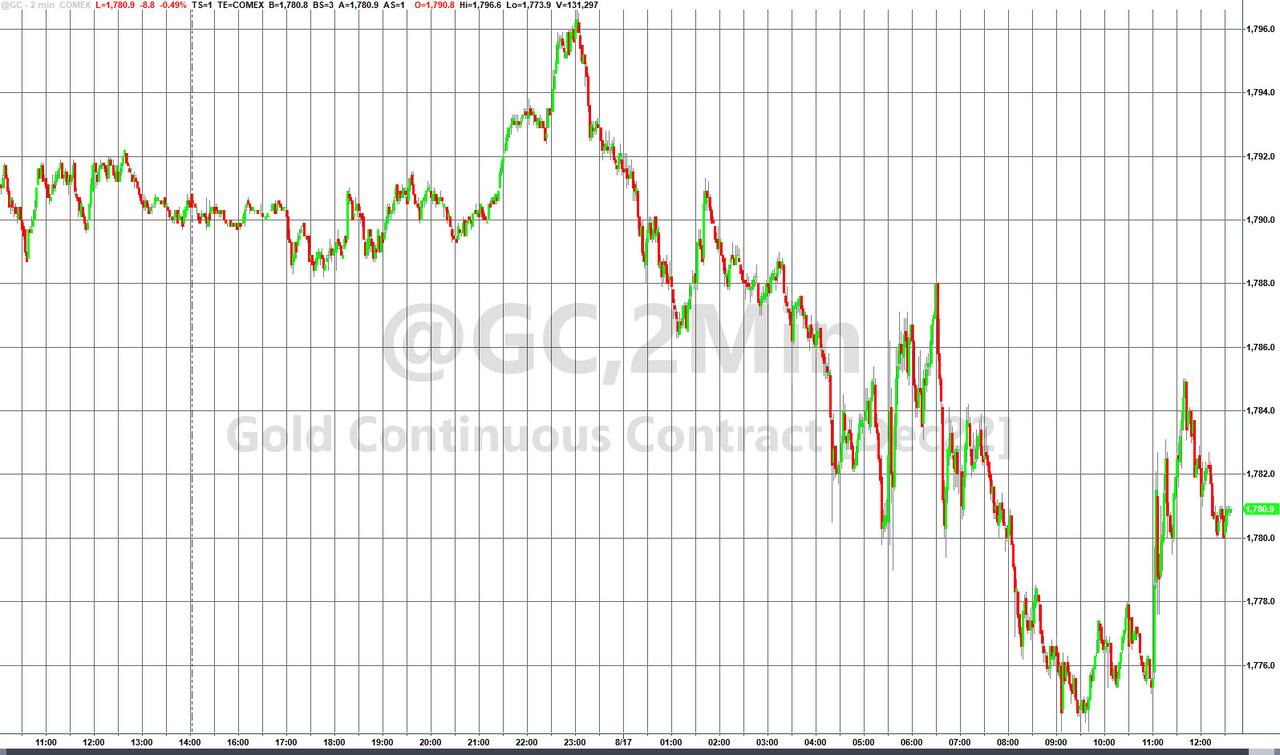
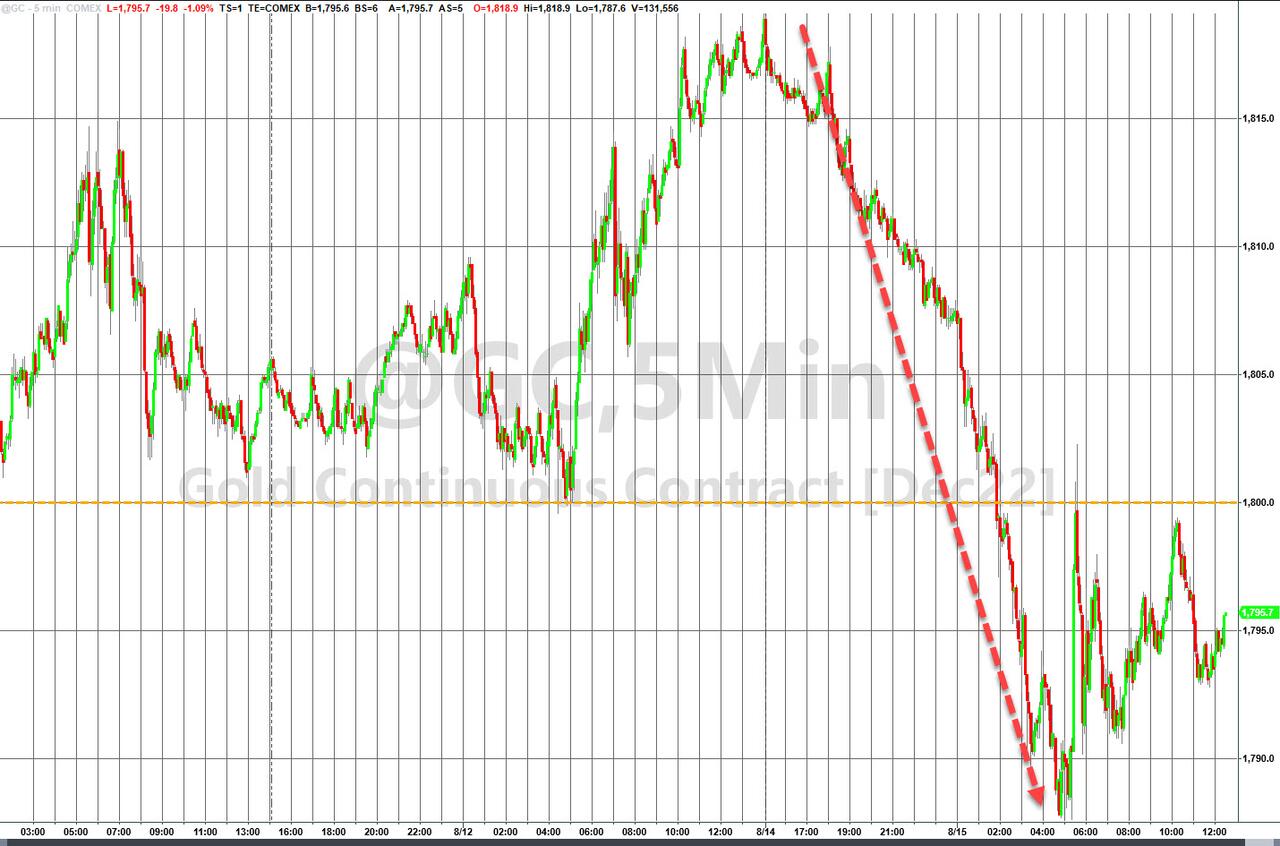
The most shorted stocks fell hard this week, as the squeeze simply evaporated, while bond yields rallied, with the 10-year almost reaching its 3% level. The US Dollar spiked and gained an amazing 2% for the week, as commodities, including gold, lagged.
Headline news pointed to one market indicator with a perfect track record, which says that stocks have bottomed…Another says they are about to plunge again. ZeroHedge summed up the discrepancy like this:
In short, we have reached a perfect quantum state of a market based on flawless backward-looking indicators, where one “100% accurate” market signpost predicts stocks melt up from here (or at worst, suffer a modest drop), while another sees stocks tumbling as much as 2,500 if not lower to a new, and far more painful low.
One of the two will see their perfect predictive track record crushed forever.
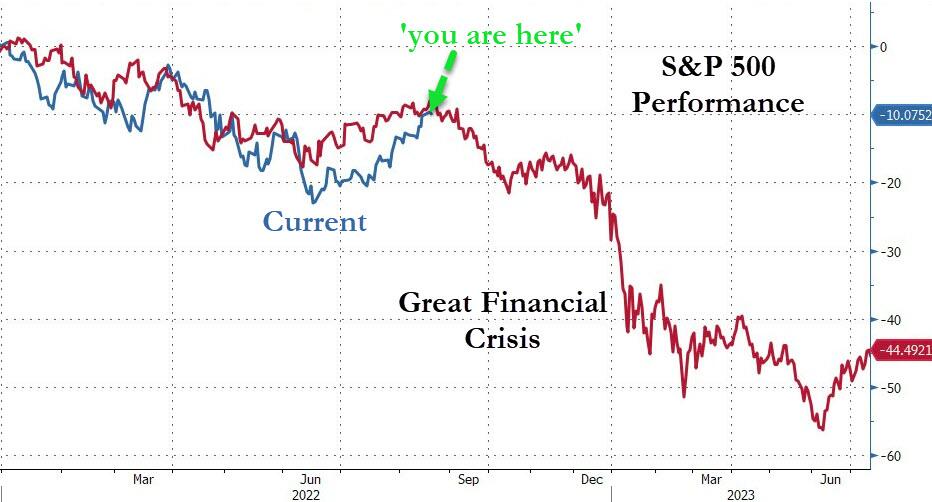
Bloomberg’s updated historic comparison chart casts a picture that clearly shows what it is that we will potentially need to guard against via the use of our exit strategy.
Read More