
ETF Tracker StatSheet
You can view the latest version here.
FedEx WHACKS MARKETS
- Moving the markets
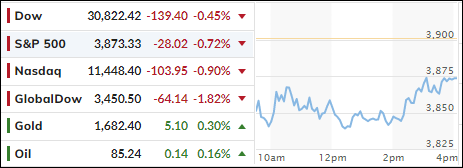
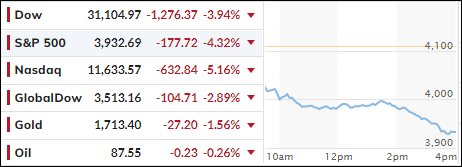
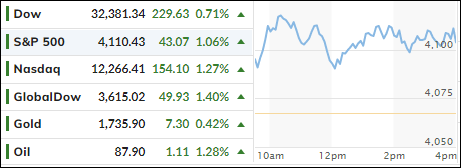
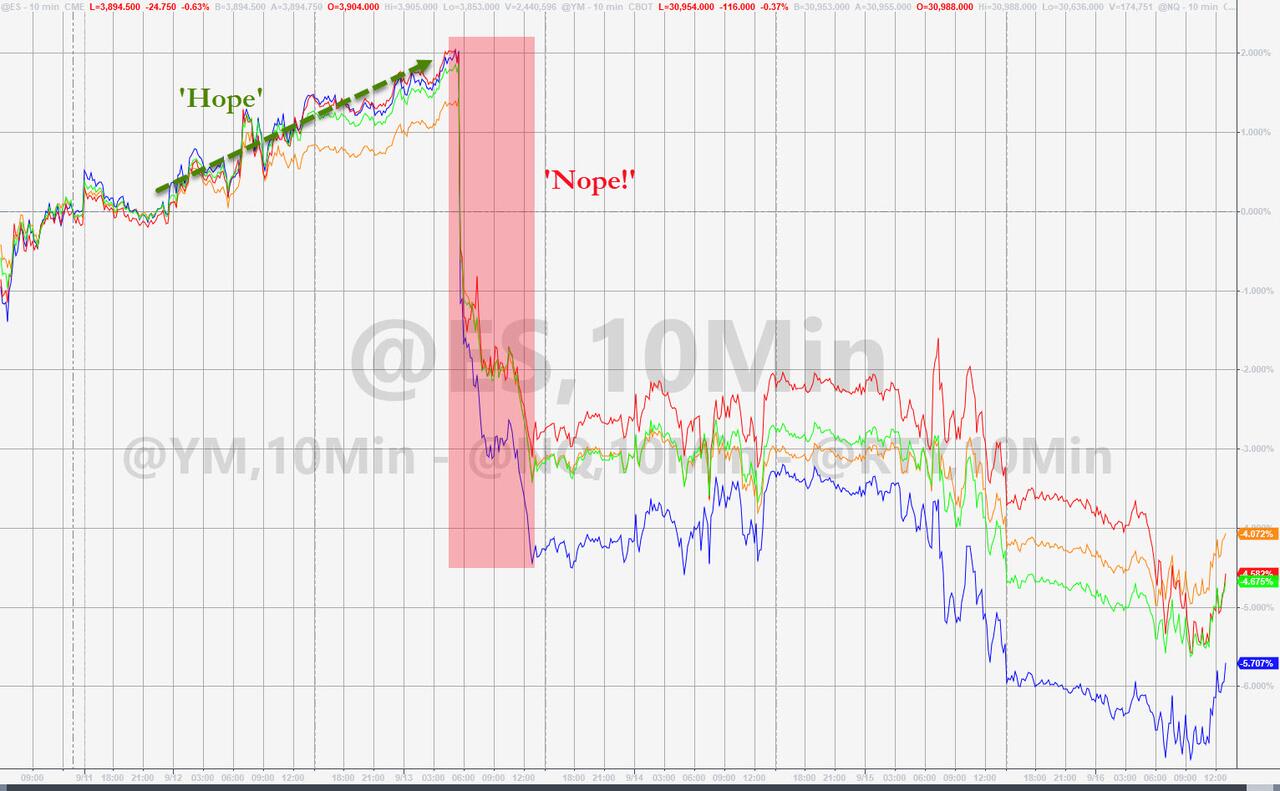
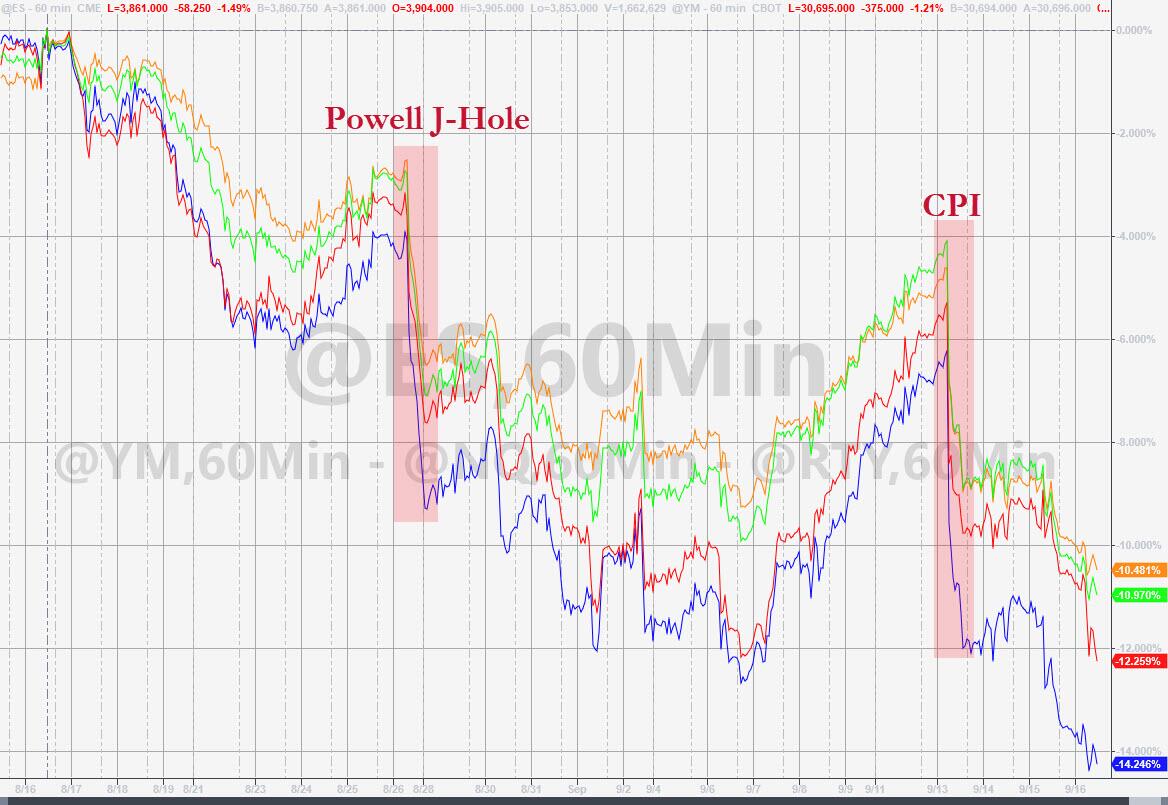
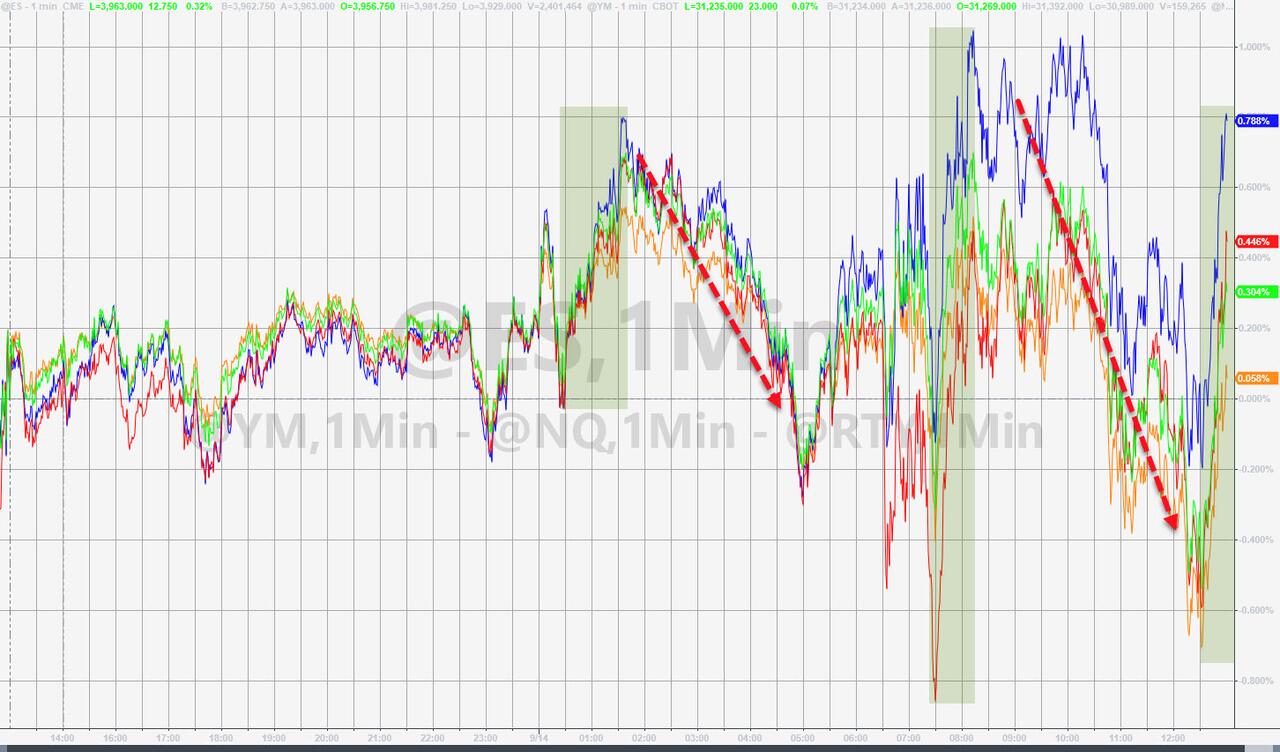
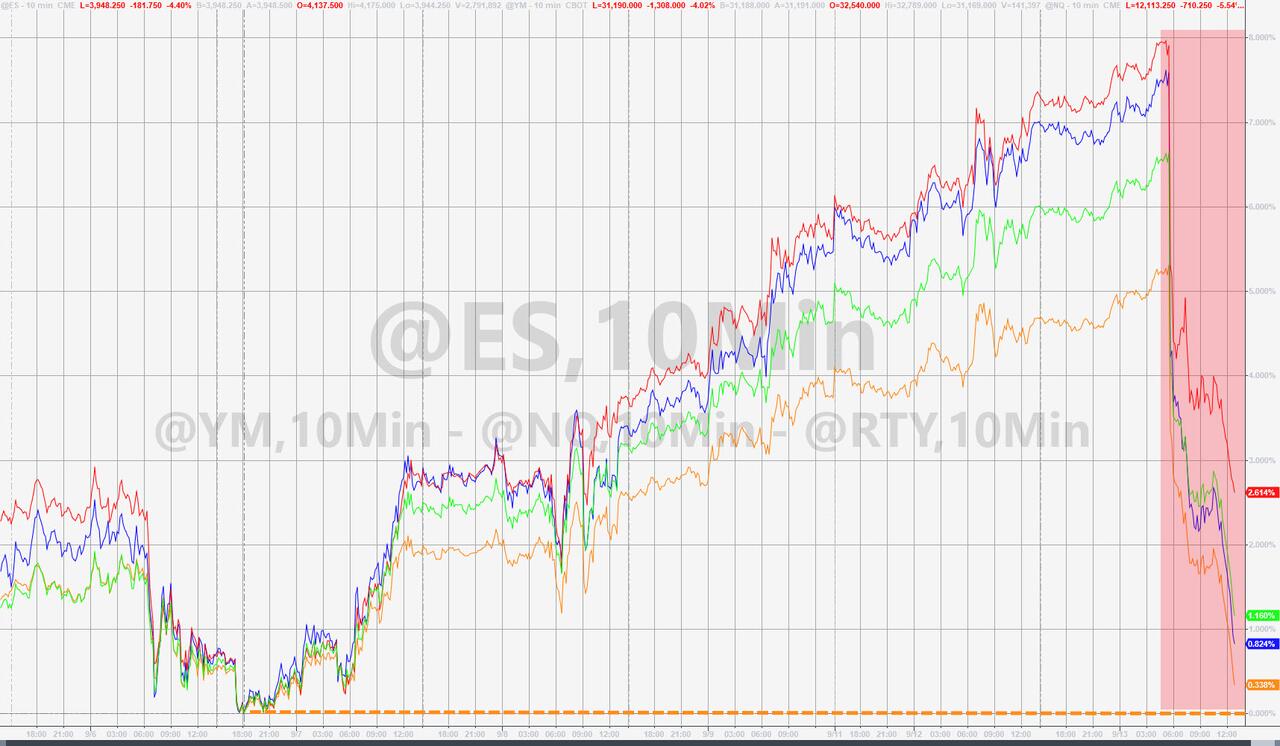
After yesterday’s thrashing, the markets continued to vacillate in red territory throughout the entire session, but the major indexes managed to rebound a bit to close off the lows for the day. Still, it was a week that most traders were relieved to see come to an end, as the losses were broad with the S&P 500 dropping 4.8%. Ouch!
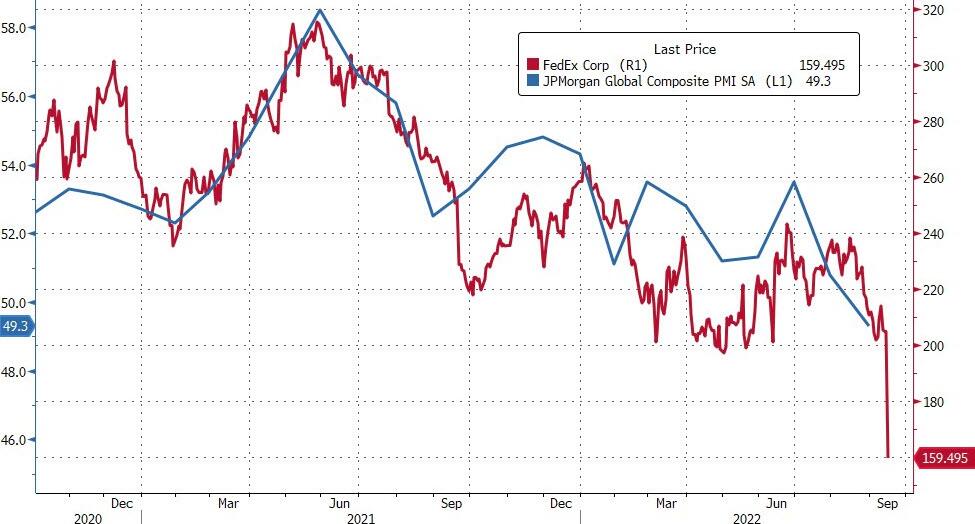
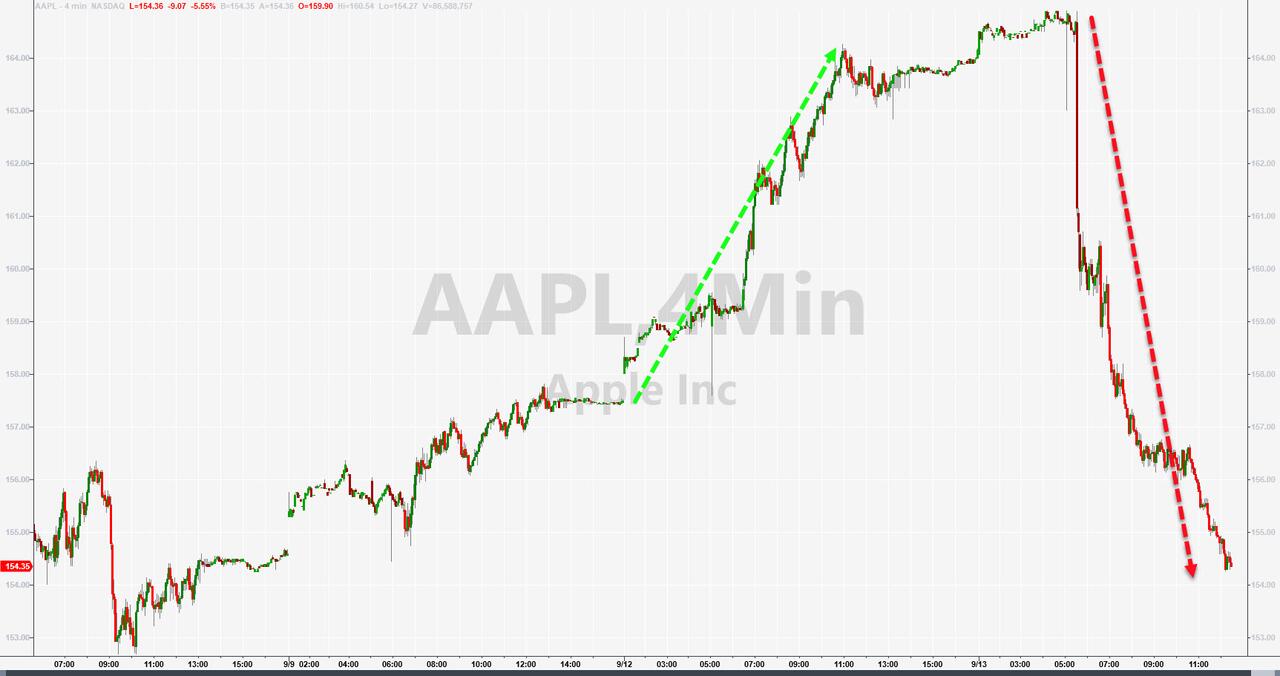
Not helping matters was FedEx, after it withdrew its full-year guidance and said it will implement cost cutting initiatives, as the global economy has drastically worsened. The stock got clobbered and ended down some -24%. Transports tend to be the canary in the coalmine, so we can expect more negative announcements in that area.
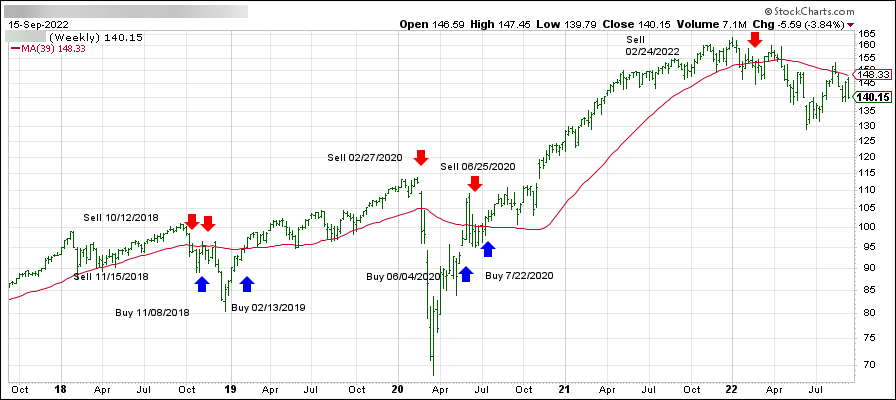
The major indexes have now scored their fourth losing week out of five, which gives even more credence to the idea that any rebound is merely a dead-cat-bounce, as my indicators are confirming via their position below their respective trend lines (section 3).
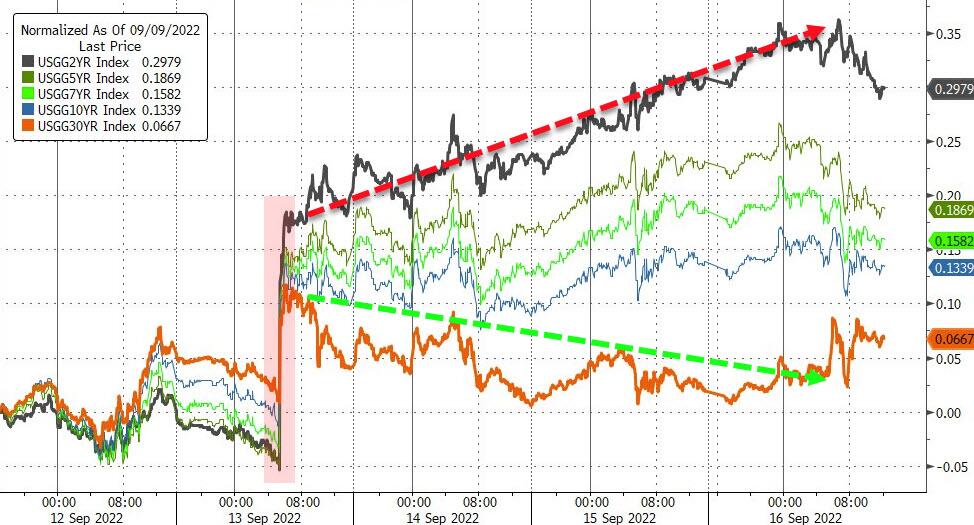
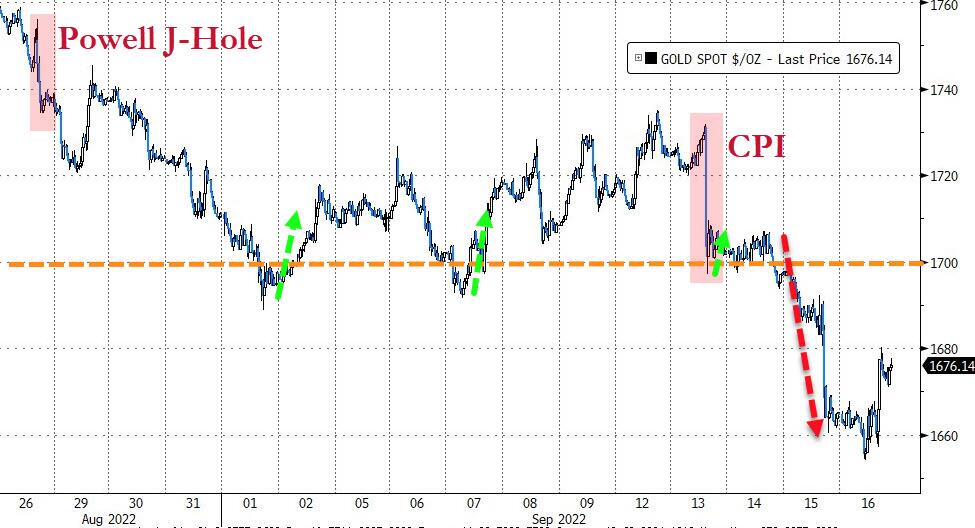
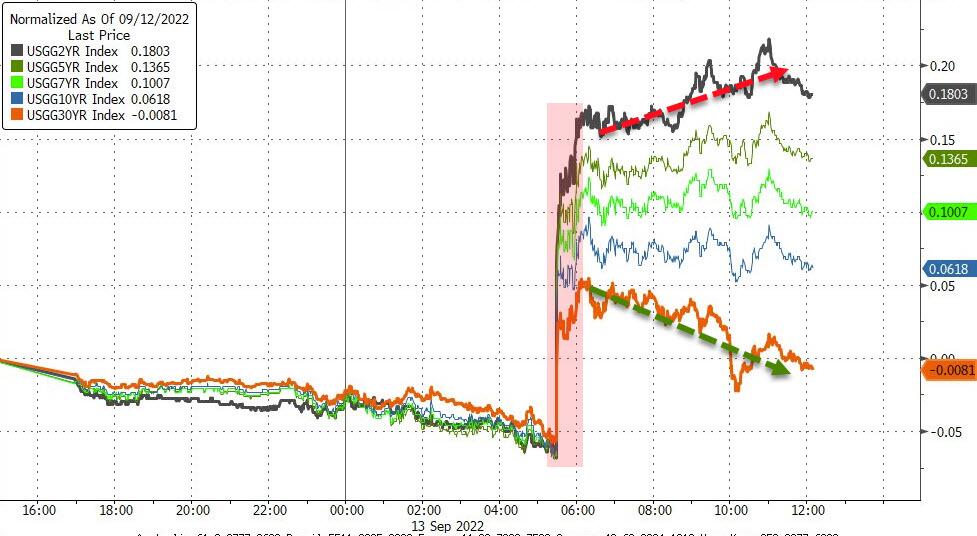
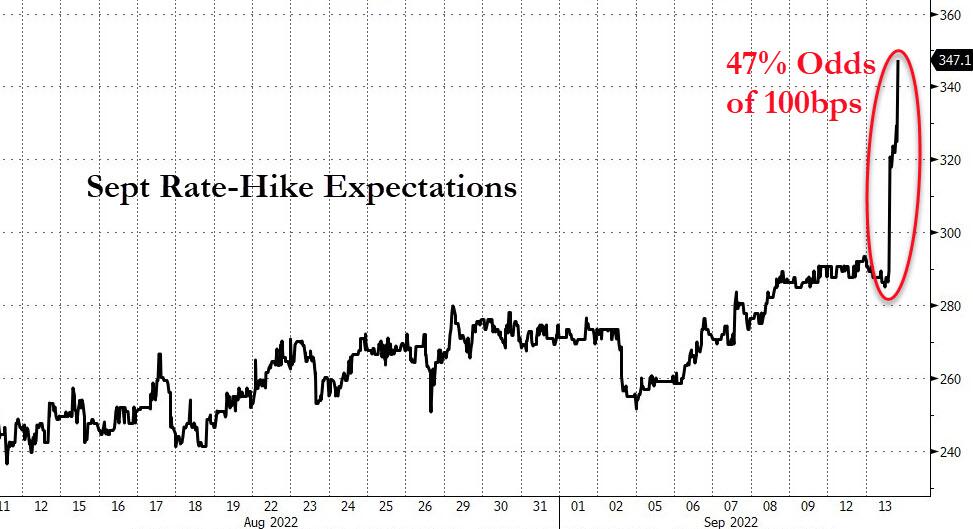
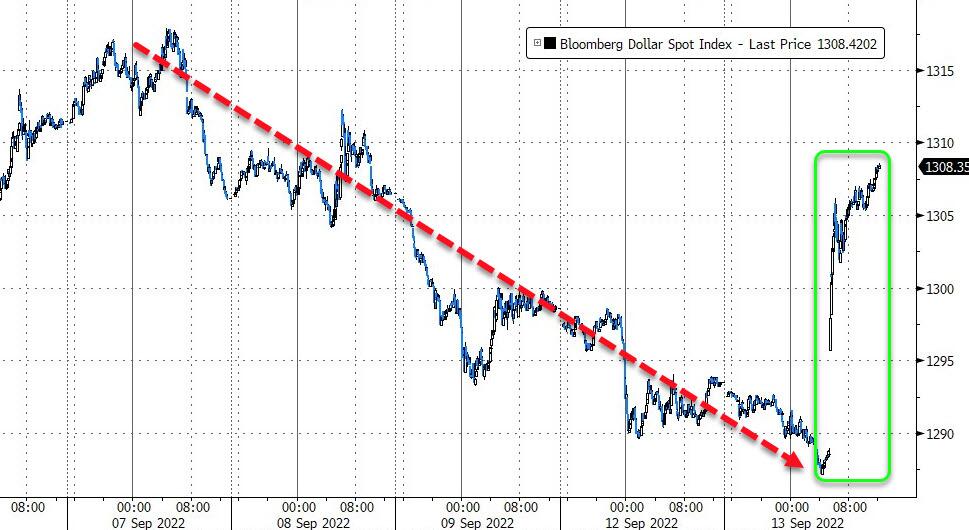
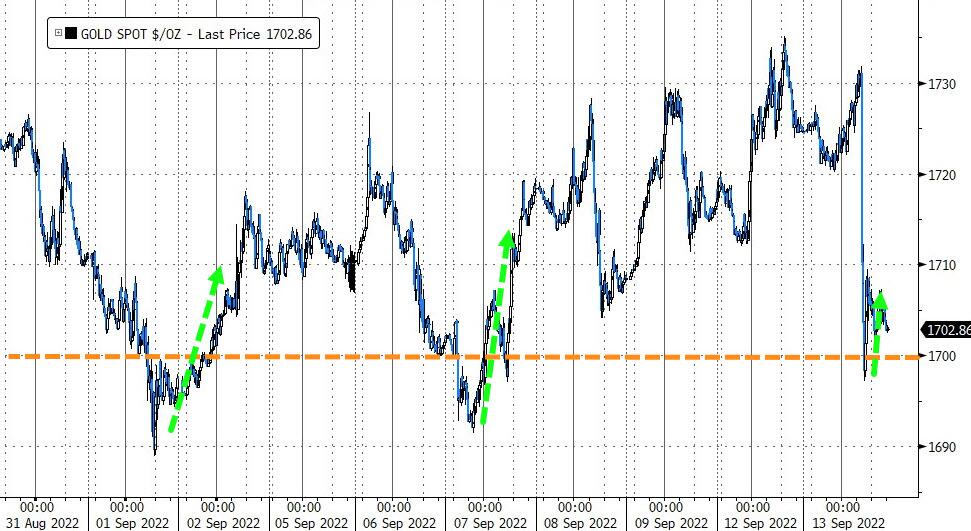
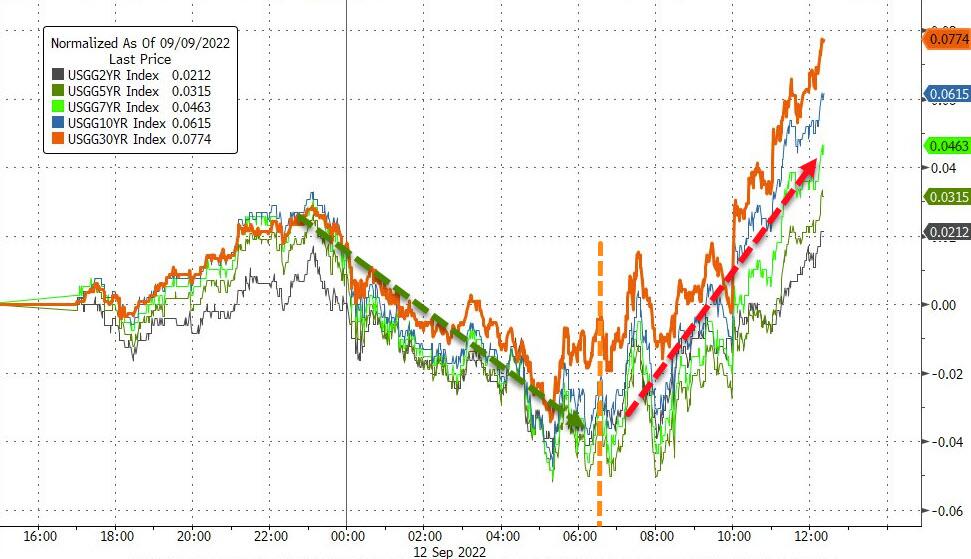
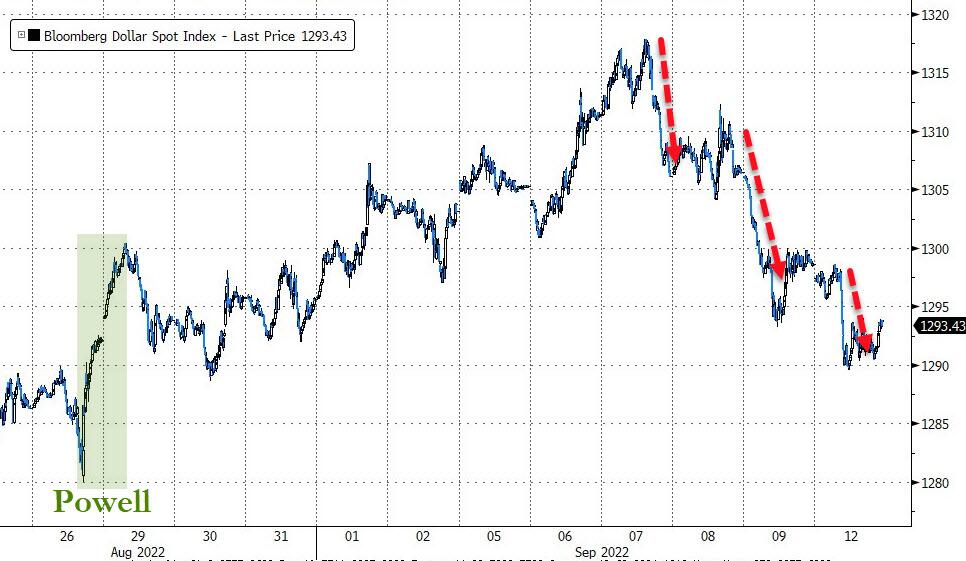
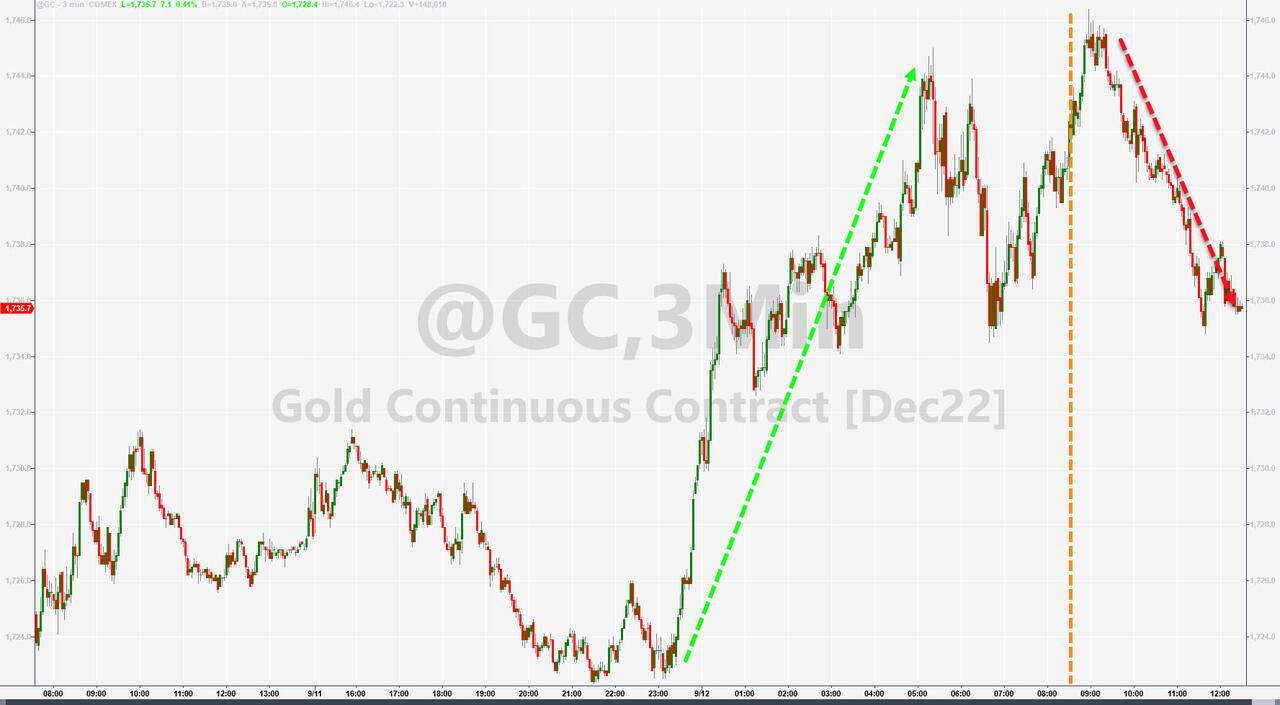
Bond yields rose this week, the US Dollar surged, which meant Gold could not hold on to some of its gains, and the precious metal closed lower despite today’s bounce.
Added ZeroHedge:
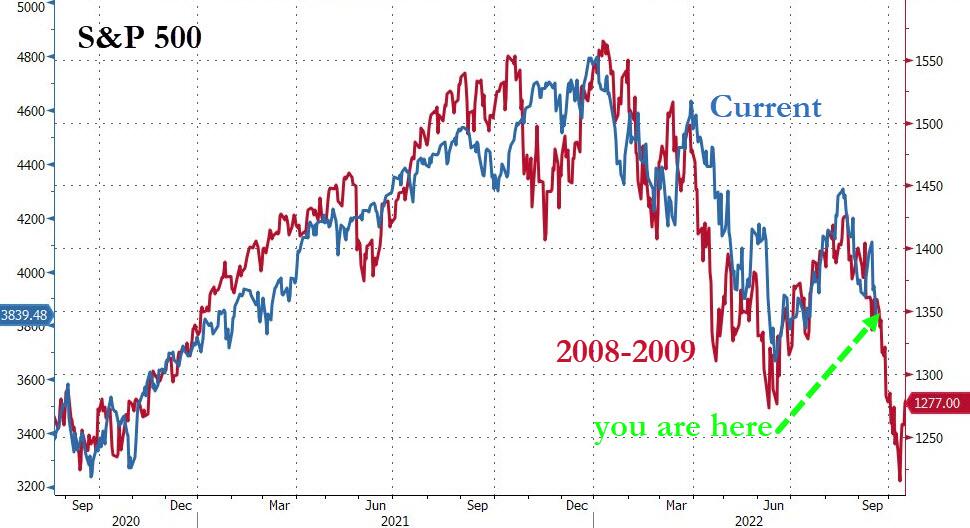
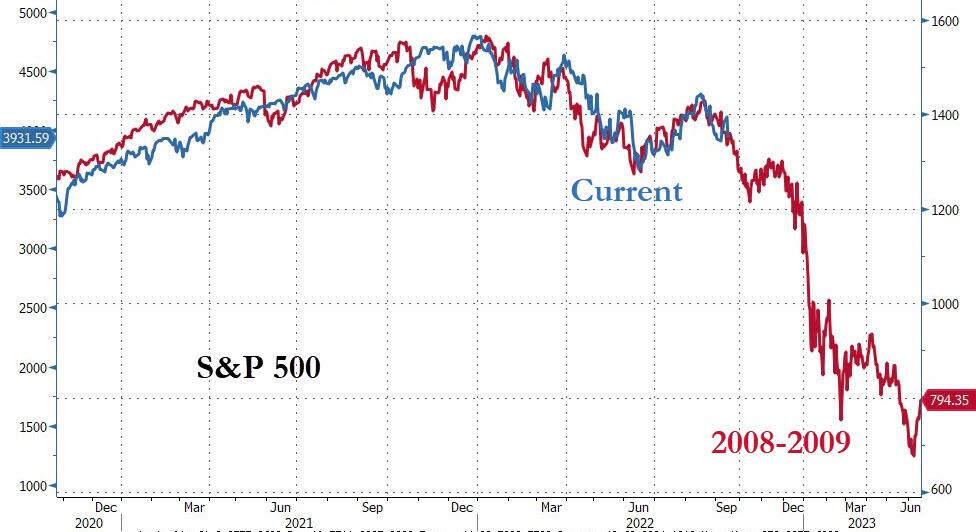
In a scenario where the Fed has to keep pushing against growth until the unemployment rate reaches 5%, we see S&P 500 down-side to 3400.
And in a scenario where unemployment hits 6%, the S&P 500 may dip below 2900. In other words, there may be a lot more downside to markets if stagflation persists.
Updating and extending the financial crises analog to 2008-2009, this picture is worth a thousand words.
Read More