Below, please find the latest High-Volume ETF Cutline report, which shows how far above or below their respective long-term trend lines (39-week SMA) my currently tracked ETFs are positioned.
This report covers the HV ETF Master List from Thursday’s StatSheet and includes 312 High Volume ETFs, defined as those with an average daily volume of more than $5 million, of which currently 44 (last week 43) are hovering in bullish territory. The yellow line separates those ETFs that are positioned above their trend line (%M/A) from those that have dropped below it.
In case you are not familiar with some of the terminology used in the reports, please read the Glossary of Terms. If you missed the original post about the Cutline approach, you can read it here.
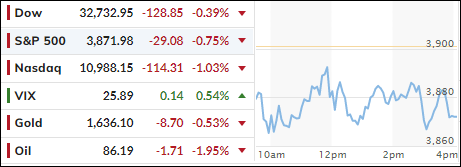
It was chaotic session indeed, as the Dow jumped to an early 500-point gain, only to see it evaporate in no time, with the index diving into the red, before dip buyers pulled equities back above their respective unchanged lines to a solid green close. However, for the week, the Dow snapped its four-week win streak.
ZeroHedge summed up the day’s news like this:
Good: payrolls beat expectations (tightening not working – bad for stocks)
Bad: wage growth slowed modestly (less-flation – good for stocks?), full-time workers dropped 490k (economic weakness – not good for stocks)
Ugly: number of unemployed Americans highest since Feb (recession reality – bad for stocks)
October’s nonfarm payrolls surprised to the upside with the Labor market saying that 261k jobs were added, as the unemployment rate rose to 3.7%. Traders viewed today’s numbers as a mixed picture, yet the idea that a cooldown in the Labor market, with the economy not tanking, was seen as a positive. However, the addition of 261k jobs may also keep the Fed’s policy of continued rate hikes on schedule, thereby pushing the much hoped-for pause or pivot on the back burner.
For the week, the Nasdaq was the biggest loser, down around 6%, the S&P 500 gave back 2.6%, while the Dow fared the best with only a 1.5% loss. Tech stocks gagged some 8%, but energy was the winner with a 2.4% gain.
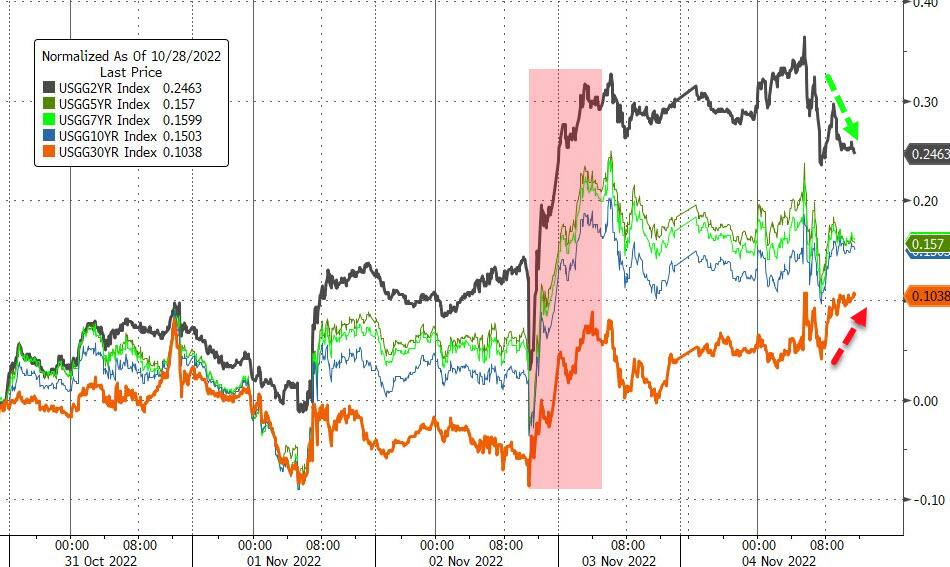
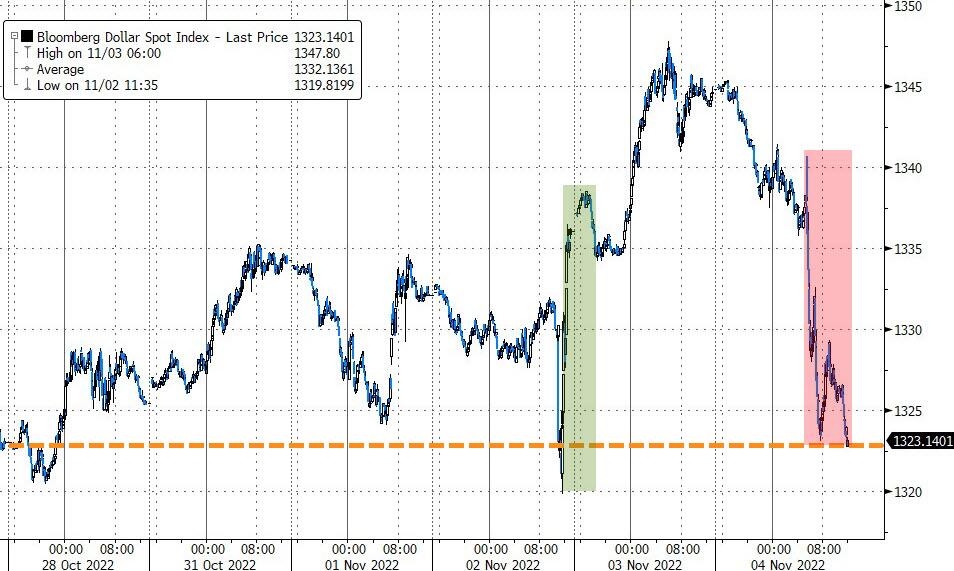
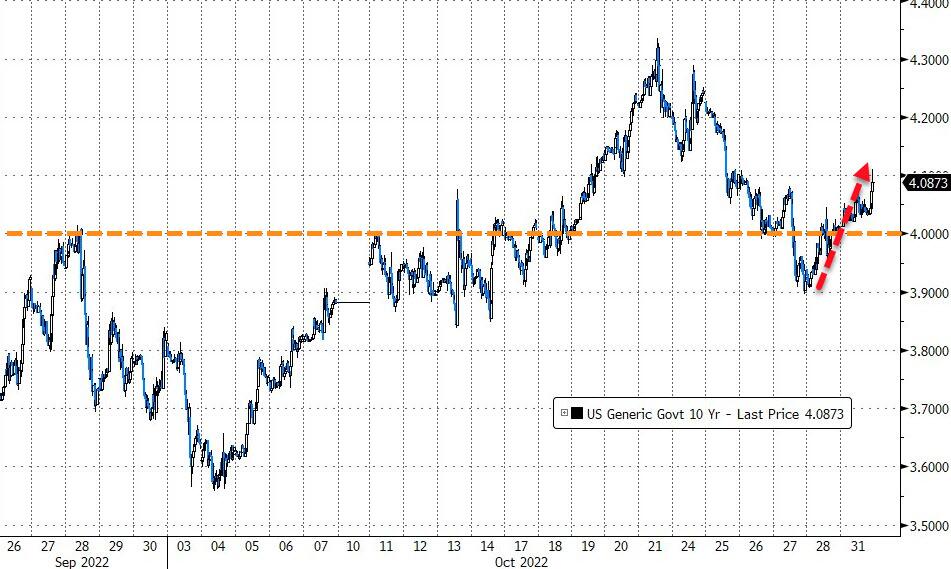
While bond yields had a mixed day, they stormed higher for the week with the 10-year solidly closing above its much-fought over 4% level (4.166%). The US Dollar took a massive dive today (almost 2%), but for the week the currency closed about unchanged.
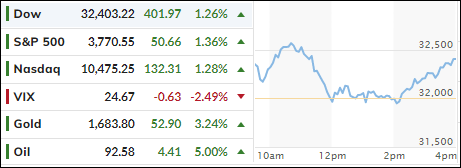
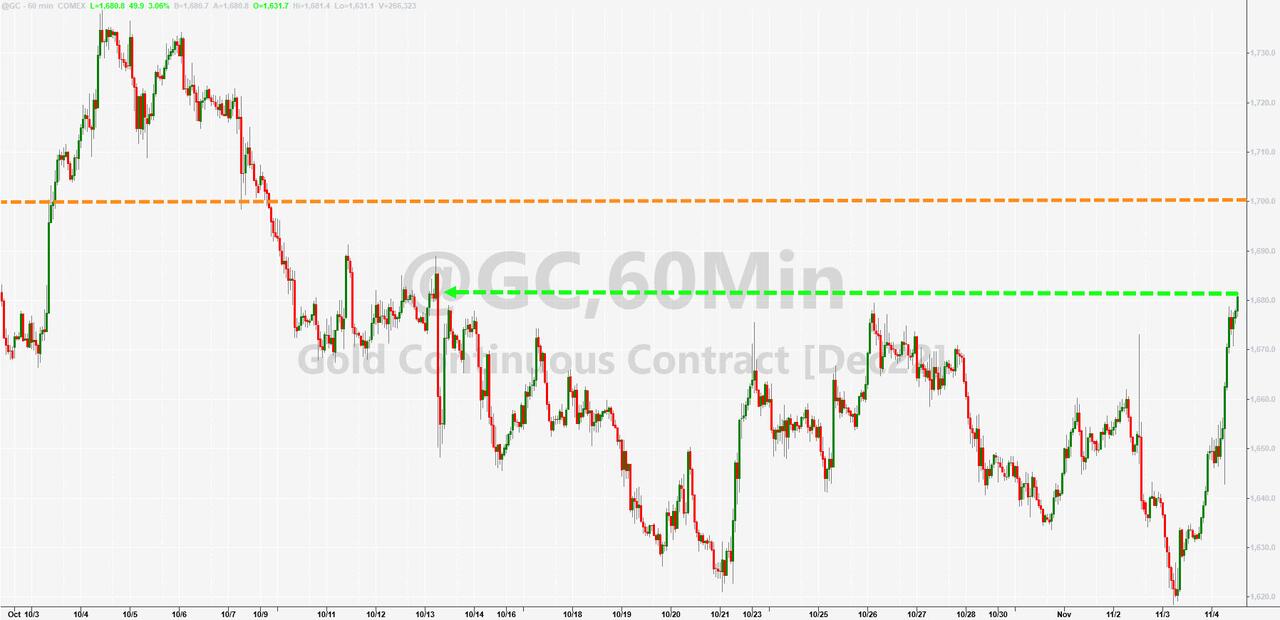
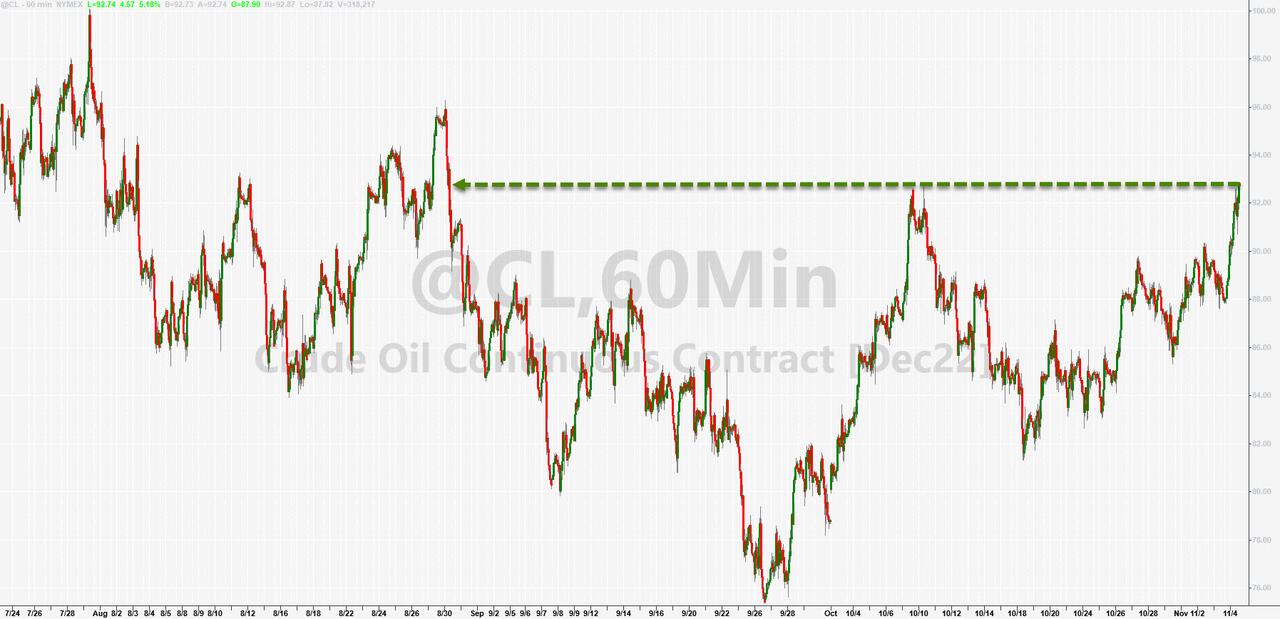
Gold benefitted, captured a solid +3.3% gain on the day and reached its highest point in 3 weeks, while Crude Oil followed suit but climbed to a 3-month high.
Fireworks could be on deck next week, as mid-term elections, and the latest CPI report, will both be able to affect future market direction.
ETF Data updated through Thursday, November 3, 2022
Methodology/Use of this StatSheet:
1. From the universe of over 1,800 ETFs, I have selected only those with a trading volume of over $5 million per day (HV ETFs), so that liquidity and a small bid/ask spread are assured.
2. Trend Tracking Indexes (TTIs)
Buy or Sell decisions for Domestic and International ETFs (section 1 and 2), are made based on the respective TTI and its position either above or below its long-term M/A (Moving Average). A crossing of the trend line from below accompanied by some staying power above constitutes a “Buy” signal. Conversely, a clear break below the line constitutes a “Sell” signal. Additionally, I use a 12% trailing stop loss on all positions in these categories to control downside risk.
3. All other investment arenas do not have a TTI and should be traded based on the position of the individual ETF relative to its own respective trend line (%M/A). That’s why those signals are referred to as a “Selective Buy.” In other words, if an ETF crosses its own trendline to the upside, a “Buy” signal is generated. Here too, I recommend trailing sell stop of 12%, or less, depending on your risk tolerance.
If you are unfamiliar with some of the terminology, please see Glossary of Termsand new subscriber information in section 9.
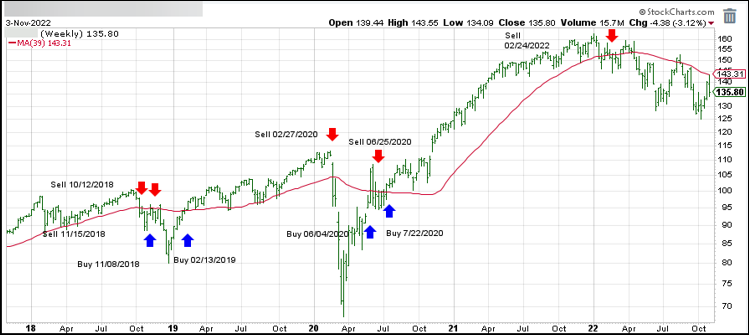
1. DOMESTIC EQUITY ETFs: SELL — since 02/24/2022
Click on chart to enlarge
Our main directional indicator, the Domestic Trend Tracking Index (TTI-green line in the above chart) has broken below its long-term trend line (red) by -5.54% and remains in “SELL” mode.
Despite the Fed doing the expected, namely hiking rates another 75bps and hinting at a policy change in the future, eliciting bullish momentum at first, things went the opposite way after Powell suggested that “the ultimate level of interest rates will be higher than previously expected.”
The overall tone of the FOMC statement was hawkish, which translates into the Fed needing more time to fight inflation with no hints of dovishness that a pause could be a possibility in the future. And just like that, the early feel-good bounce was wiped out, and south we went, with the major indexes diving into the close.
Among a host of comments by Powell, this one left no doubt as to how he sees the current economic environment:
The question of when to moderate the pace of increases is now much less important than the question of how high to raise rates and how long to keep monetary policy restrictive.
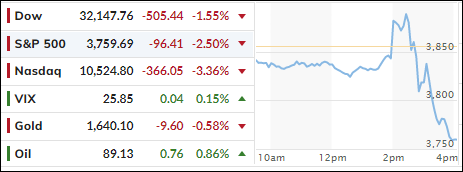
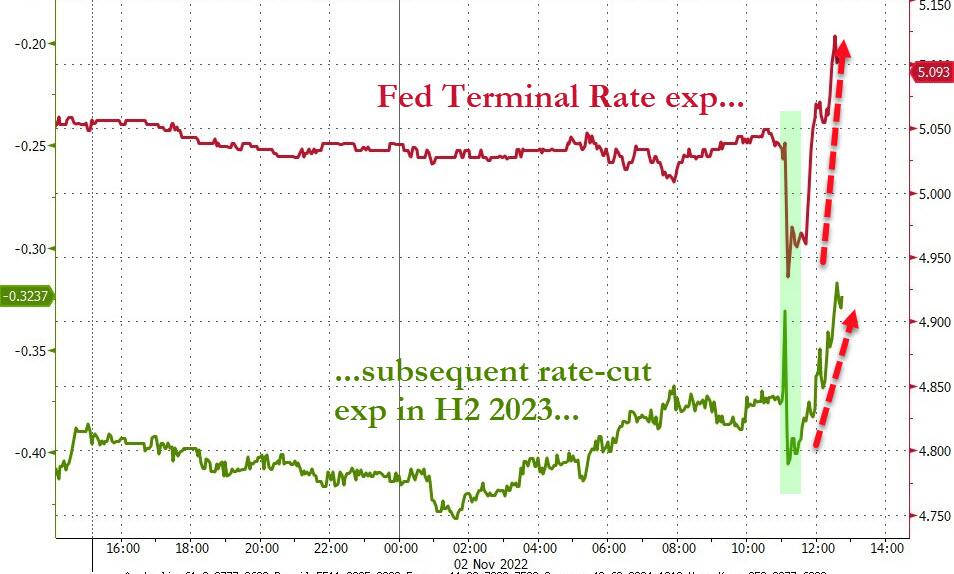
The immediate effect was that Terminal Rate Expectations surged further into hawkish territory, with Rate Cut Expectations following the same path, as the odds for further hikes increased. As a result, SmallCaps and the Nasdaq puked over 3%, as ZeroHedge pointed out.
And then this:
*POWELL: IF WE OVERTIGHTEN, WE CAN SUPPORT ECONOMIC ACTIVITY
*POWELL: IF WE UNDERTIGHTEN, RISK IS INFLATION ENTRENCHED
That should make it clear that a pause, let alone a pivot, is nowhere near on the horizon, which begs this question:
Will the October rally now turn into another dead-cat-bounce?
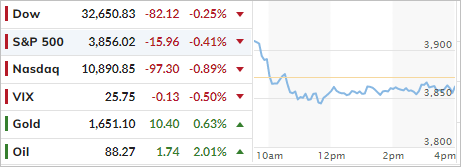
After an early bounce, the major indexes faded below their respective trend lines and spent the session aimlessly meandering in anticipation of the Fed’s decision on interest rates tomorrow.
As I posted before, a hike of 75bps is pretty much a lock, but the much-anticipated question as to what they will do in December may not be answered. However, last month’s rally was based on traders’ assumption the Fed might pull back next month and only hike 50bps.
Should that happen, the current rally has a good chance of continuing, however, if the hawkish sentiment prevails to better fight inflation via another 75bps increase, a sell-off will be in the cards.
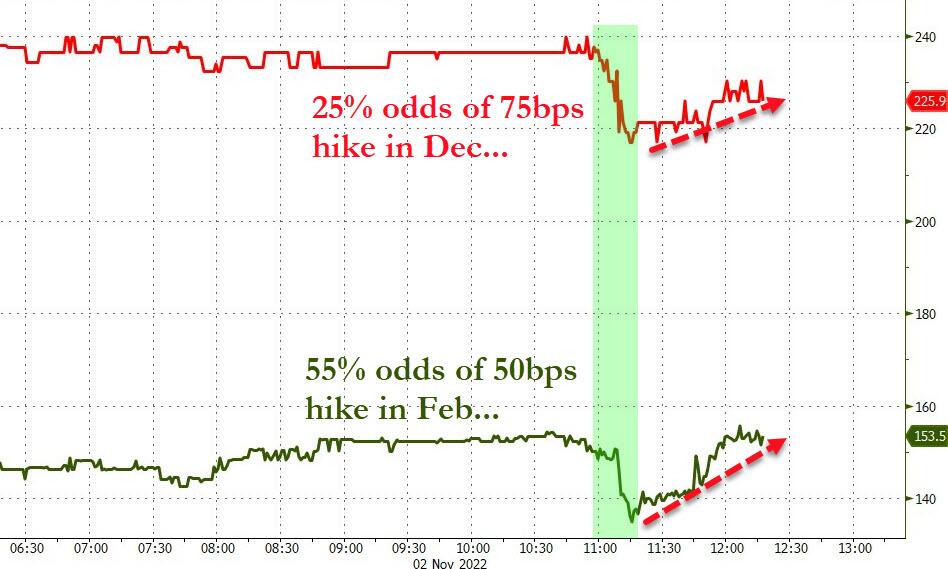
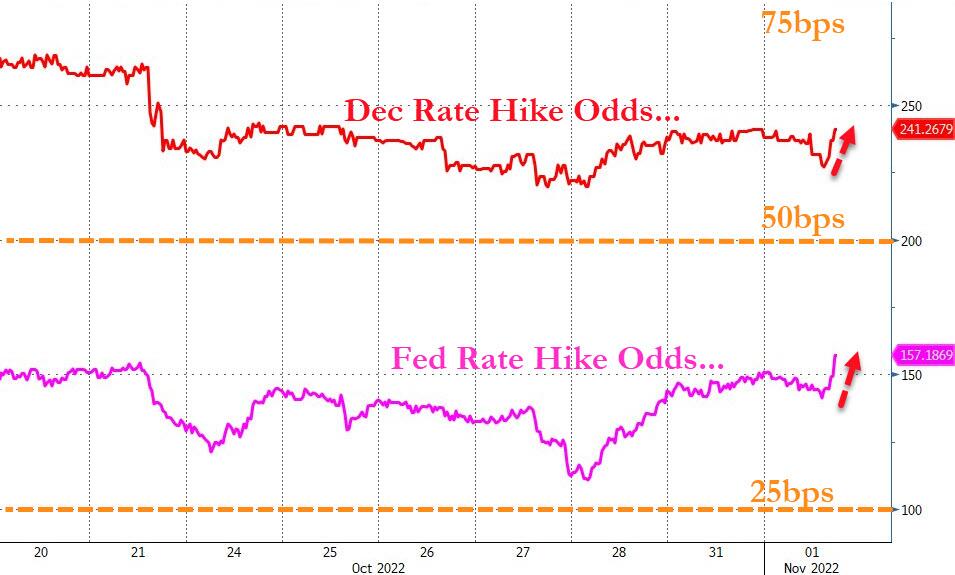
Given today’s stronger than expected jobs data, Fed head Powell may not cave as quickly as had been assumed and wave the torch of higher rates a while longer, as today’s terminal rate expectations chart seems to indicate—as do the December rate hike odds.
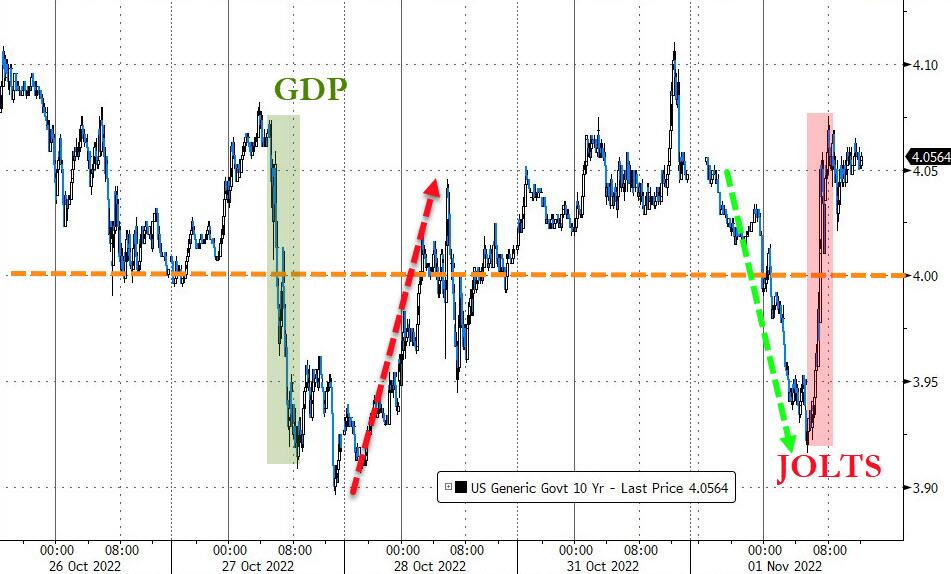
Bond yields were in a world of their own by first tanking and then ripping higher after the jobs report was released. The 10-year followed suit by dumping and pumping.
All eyes are now the Fed, and yesterday’s question, as to whether we will see a three-peat, may be answered, if not tomorrow, but likely over the next few trading days.
During the month of September, the S&P 500 tanked and lost -9.3% with the index meandering sideways for the first 12 days of October. Suddenly, a slow climb out of that deep hole gathered momentum with all major indexes staging a remarkable bear market bounce that stopped just short of generating a new “Buy” signal for us trend followers.
For October, the S&P gained 8%, thereby recouping a big chunk of September’s losses but falling short in magnitude of June/July’s bounce back. Still, the Ramp-A-Thon occurred despite a mixed 3rd quarter earnings season, during which the big names in the tech sector simply got wrecked with the downside “leaders” being Amazon and Facebook.
With a “so-so” earnings season, a slowing economy and worsening inflation everywhere you look, what caused this sudden change in sentiment from bearish to bullish?
The answer is found in the same old standby argument, namely that traders and analysts are absolutely convinced and ever hopeful for a Fed pivot (to at least a pause or a reduction in rate hikes), which is currently defined as a +75bps increase this coming Wednesday followed by only a +50bps hike in December.
It is critical that this plan will fall into place exactly like this, because should the Fed move +75bps in December, disappointment will reign, and you can kiss this current rally goodbye with new YTD lows likely being on the horizon.
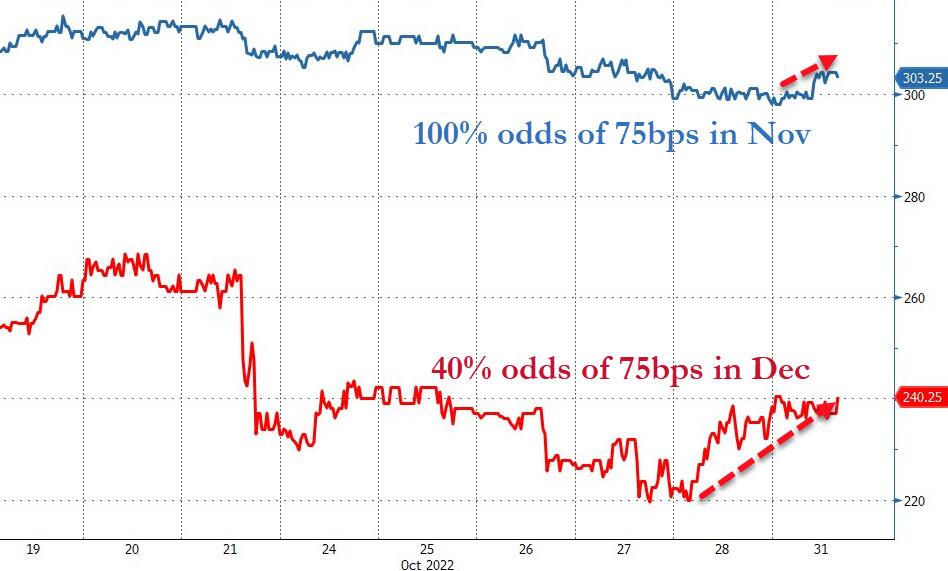
Everything is measured in odds, and Wednesday’s forecast of a 75bps hike is a 100% lock, while the graph shows that the odds of a 75bps move have gotten more hawkish (40%).
Bond yields rose throughout the month, while prices tanked. The 10-year managed to cross the 4% level and meandered around that number yet managed to close above it.
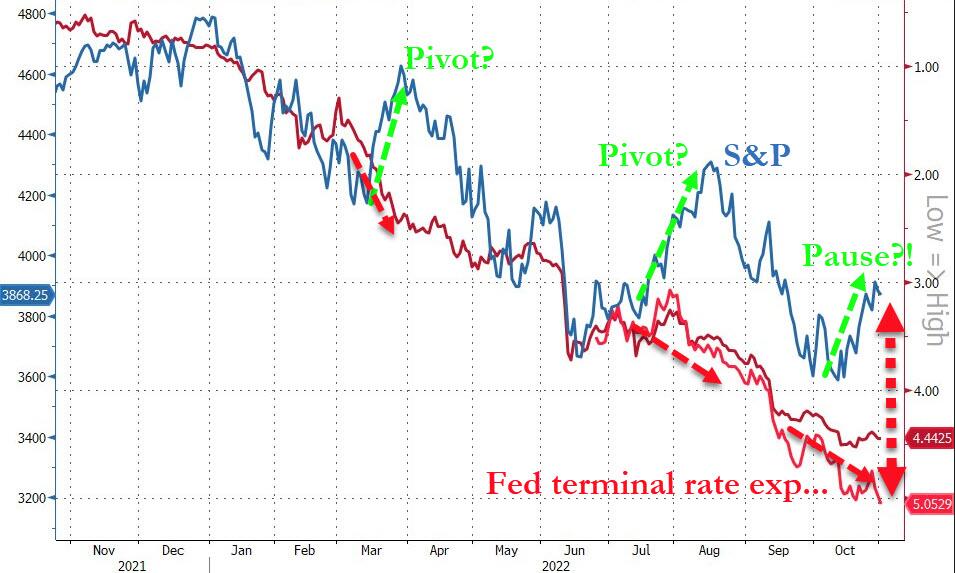
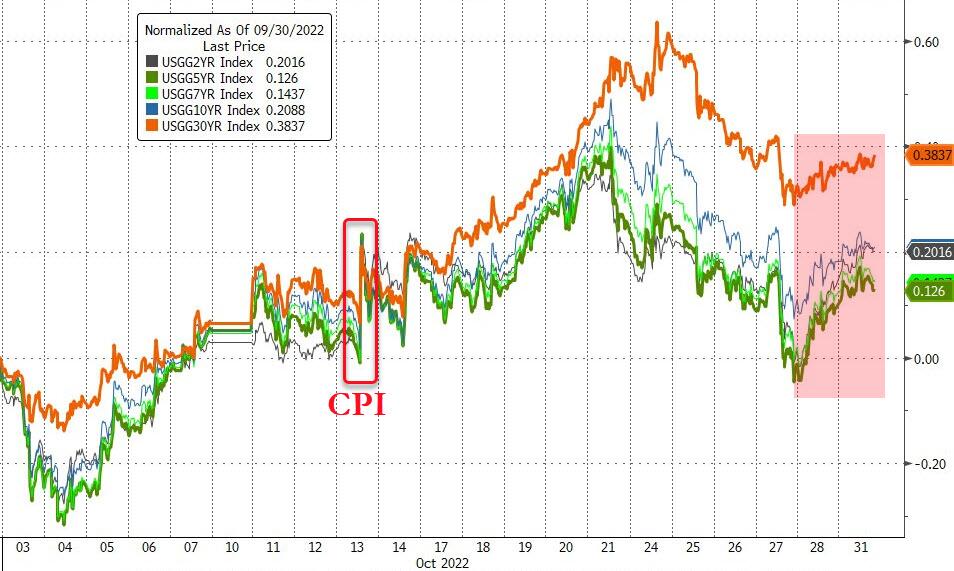
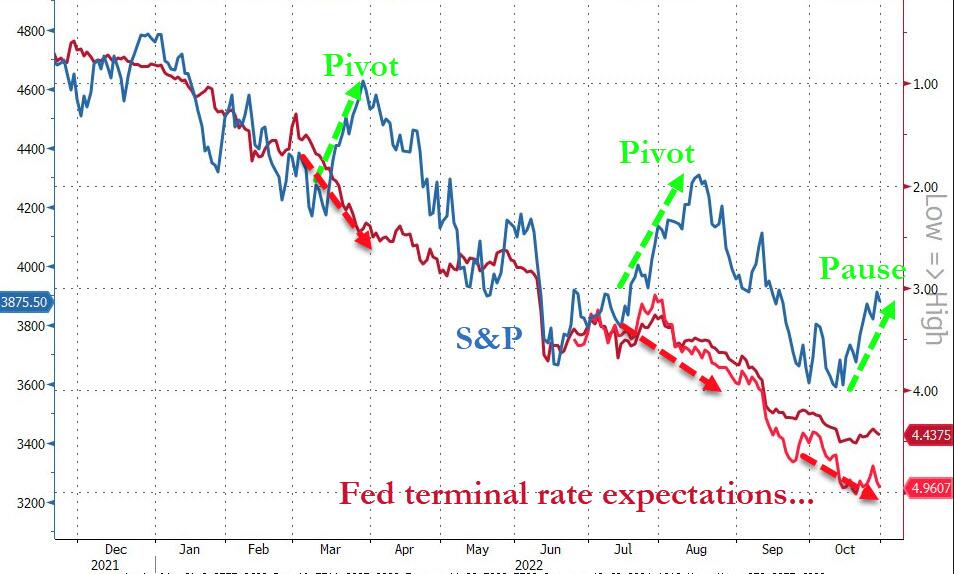
As ZeroHedge points out, this pattern of stocks ramping on “pivot/pause” hope, while rates were rising, has not worked out well for the markets this year, as this chart shows.

