ETF Tracker Newsletter For January 13, 2023

Ulli ETF Tracker Contact

ETF Tracker StatSheet          

You can view the latest version here.

CONQUERING THE FLAT LINE

[Chart courtesy of MarketWatch.com]

  1. Moving the markets

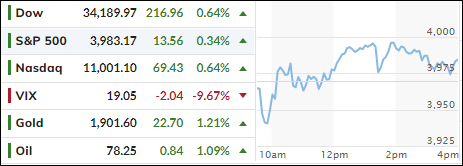
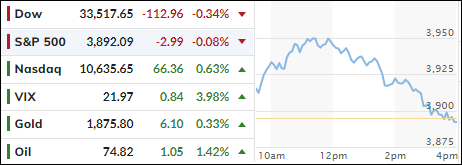
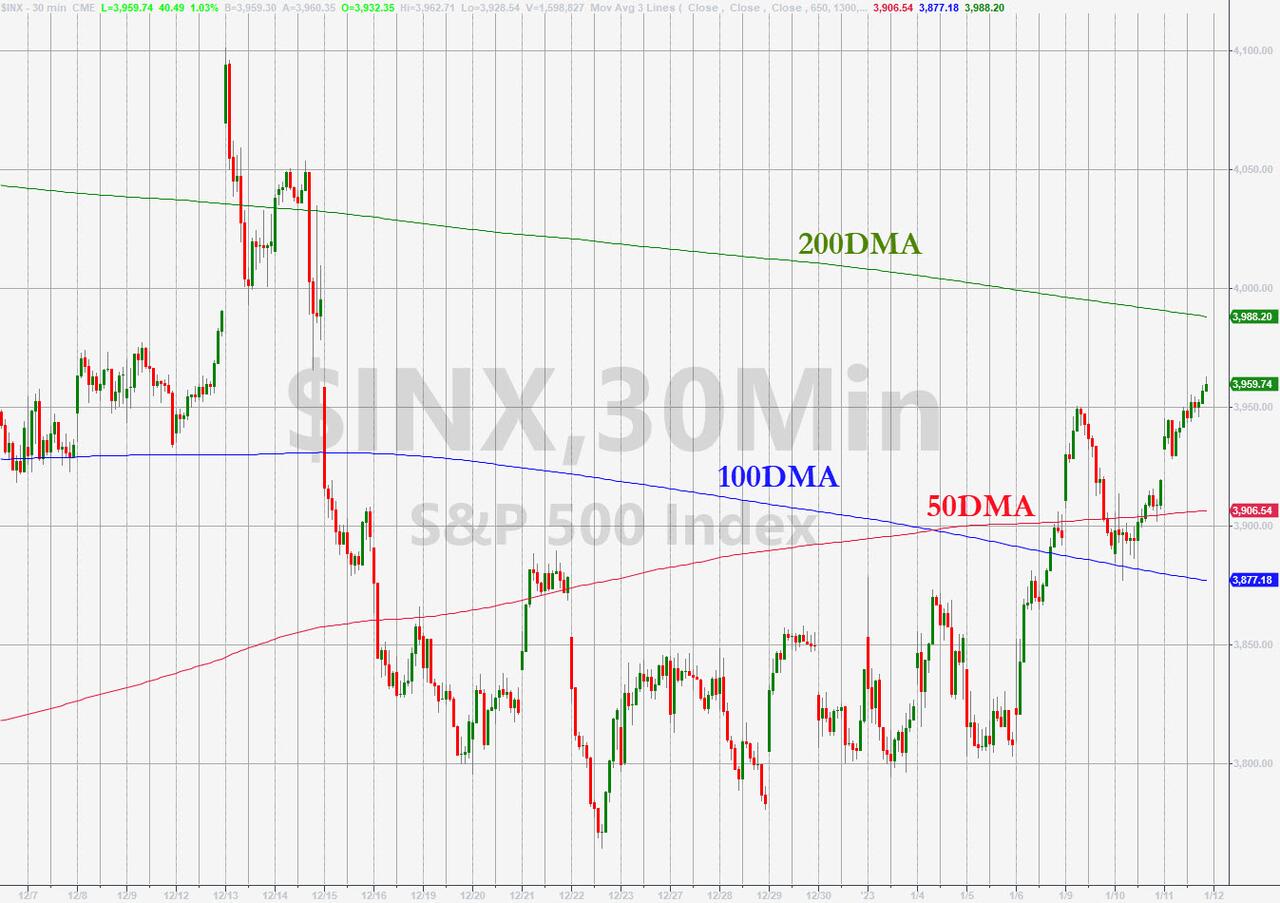
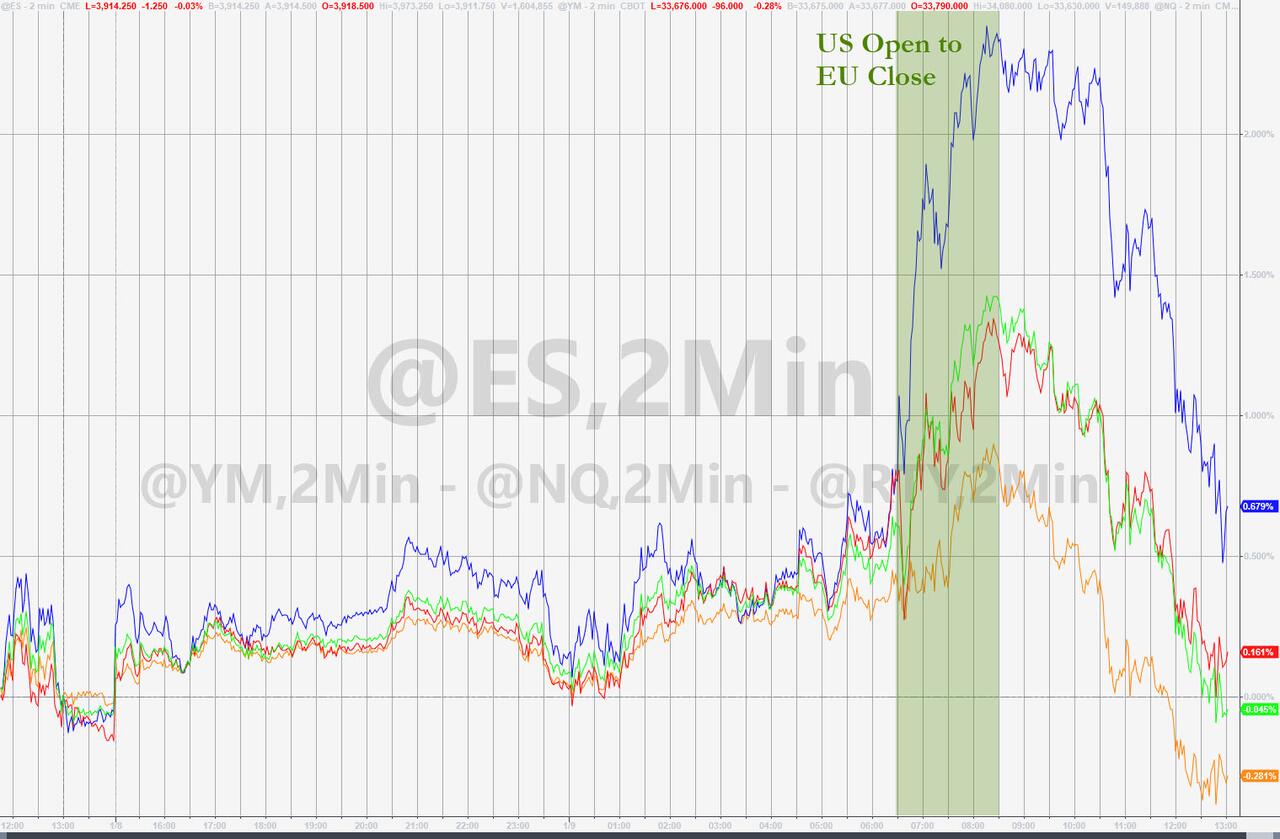
After digging themselves out of an early hole, the major indexes crawled back slowly and surely to end another session on a positive note.

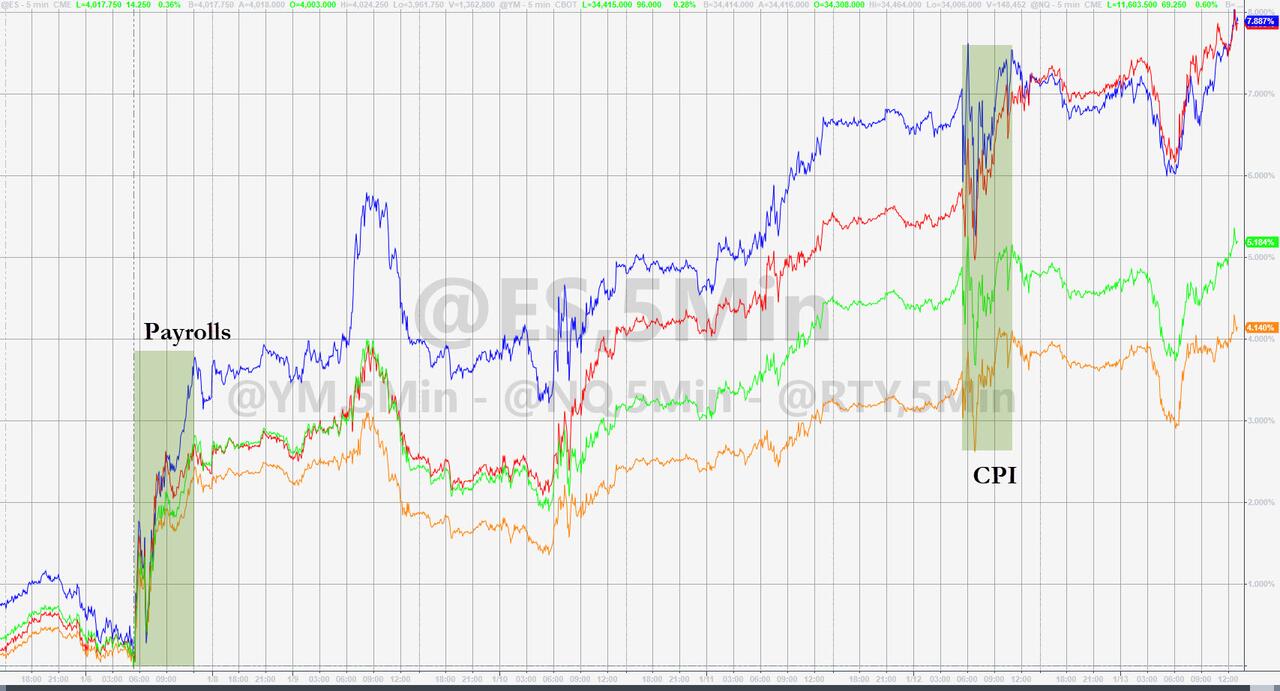
Q4 bank earnings were on the agenda, as JP Morgan beat revenue expectations but warned that it’s setting aside more money, an increase of 49% from Q3, to cover credit losses for what they termed a “mild recession.” The stock slipped initially but recovered late in the day.

Wells Fargo (WF) disappointed, with the stock dropping 4%, and BofA as well slid despite better-than-expected Q4 earnings. WF also added that it’s preparing for the economy to “get worse than it’s been over the last few quarters.”

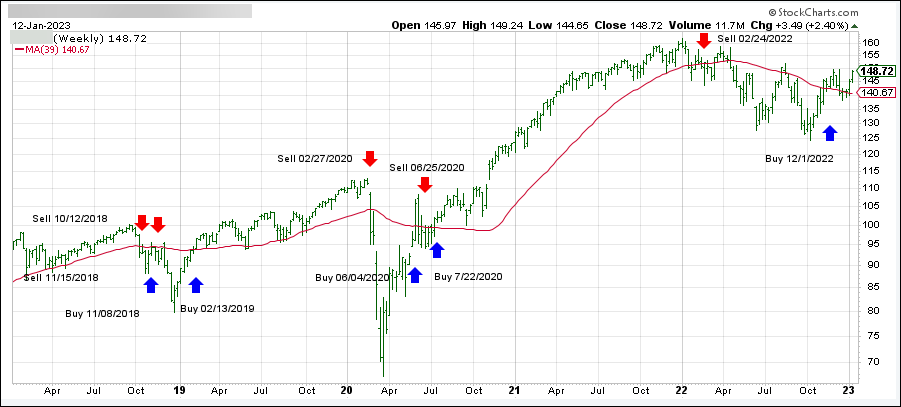
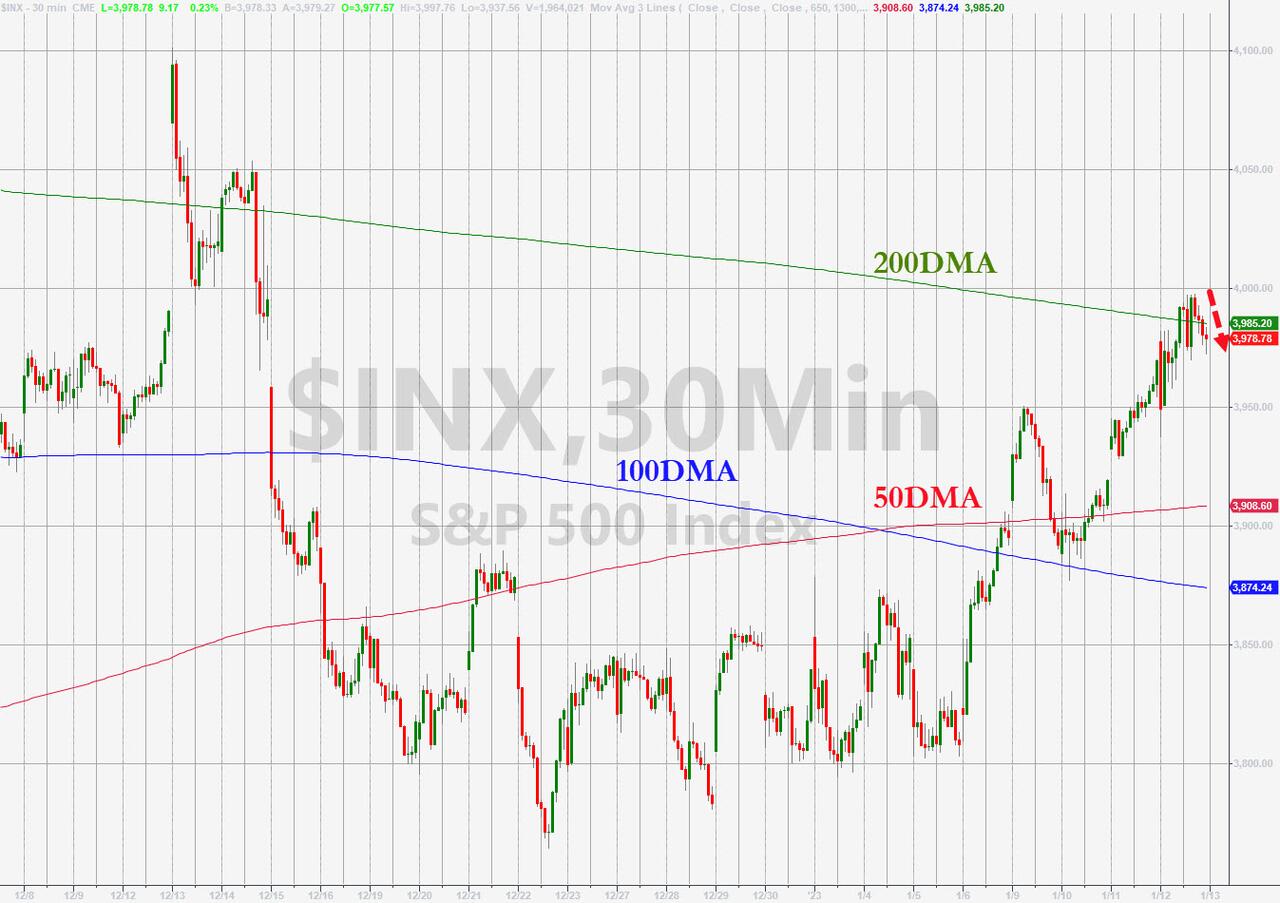
Still, the S&P recorded its best week since November, as MarketWatch pointed out, and scored its second winning week in a row but falling just short of reclaiming its $4k level.

On the economic front, the Consumer sentiment survey showed that 1-year inflation expectations dropped to 4%, vs. 4.3% expected, which is the lowest 1-year outlook since April 2021.

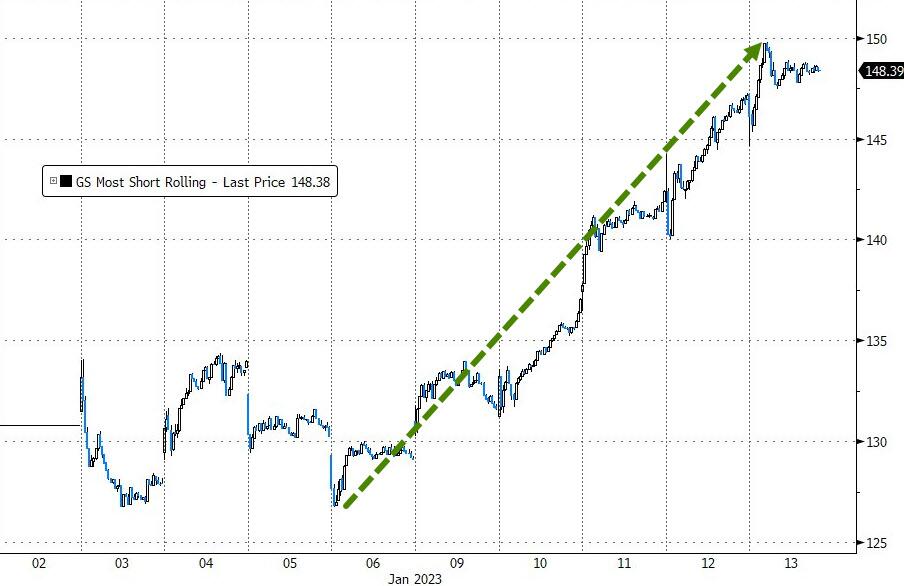
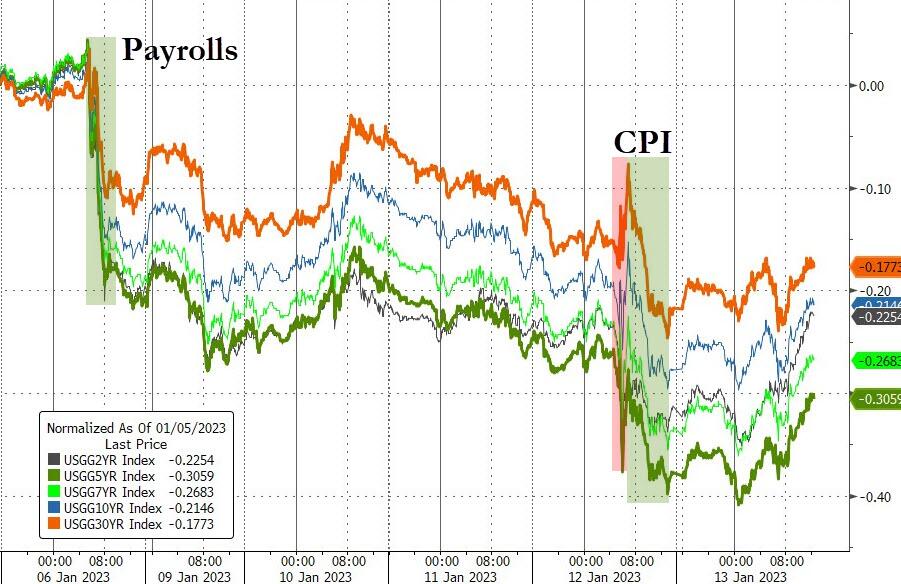
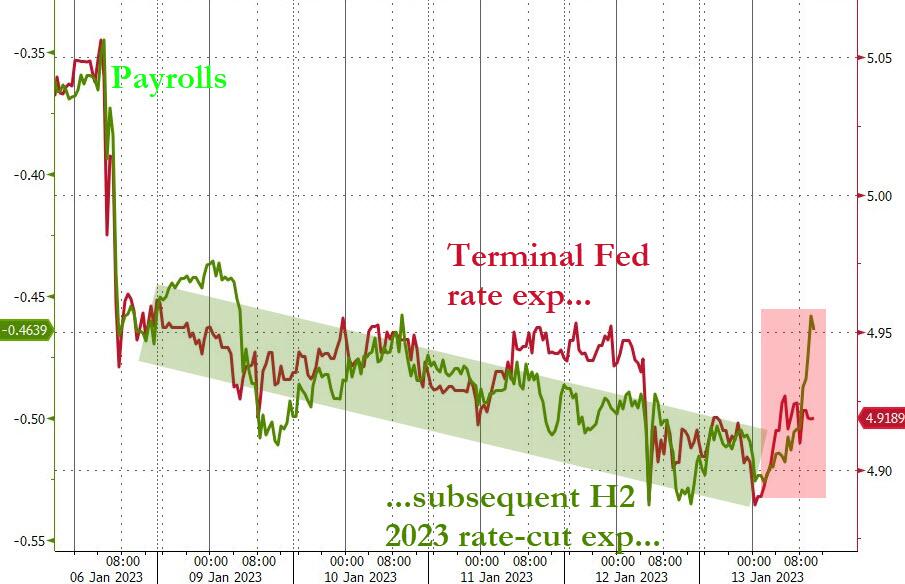
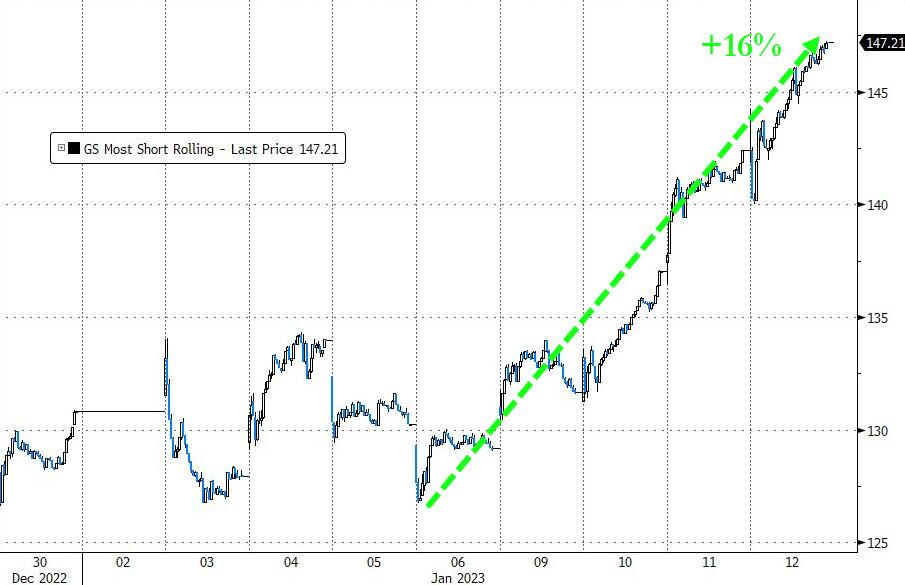
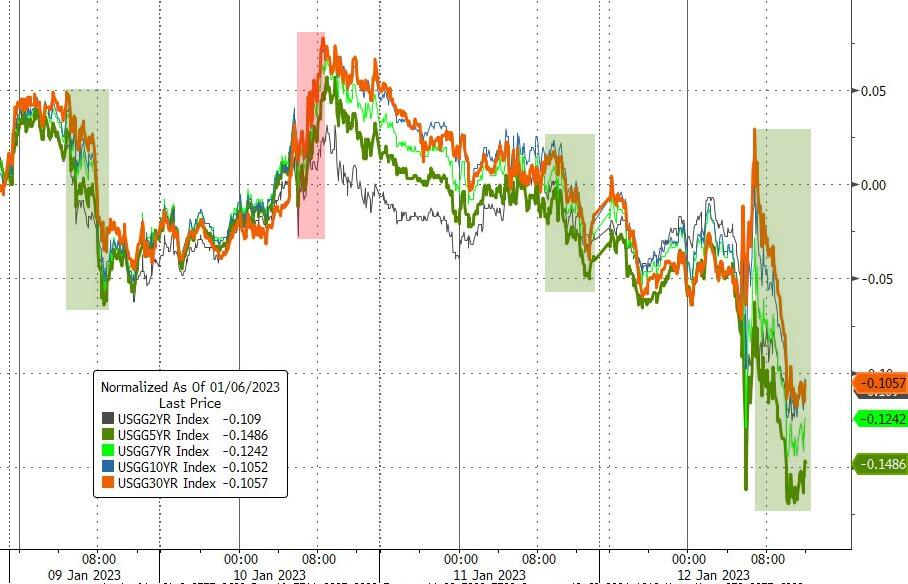
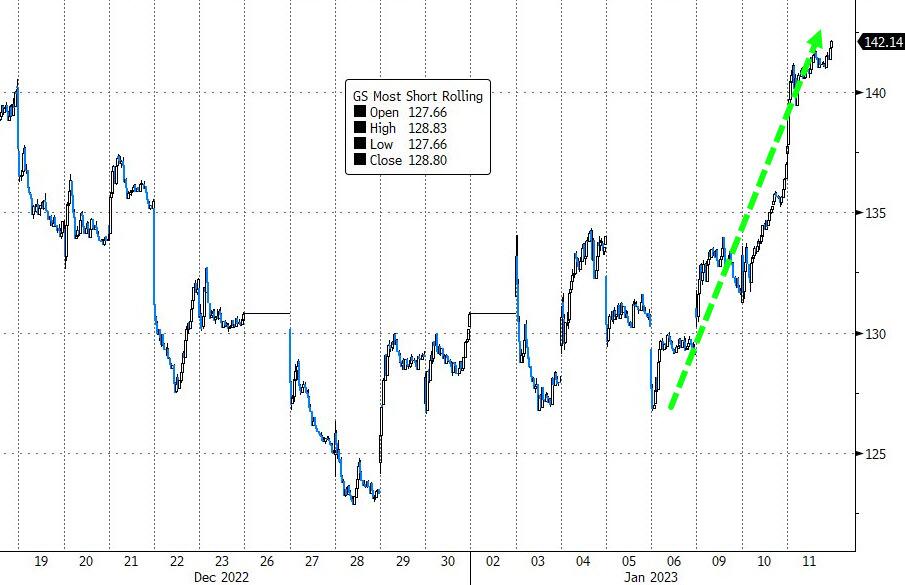
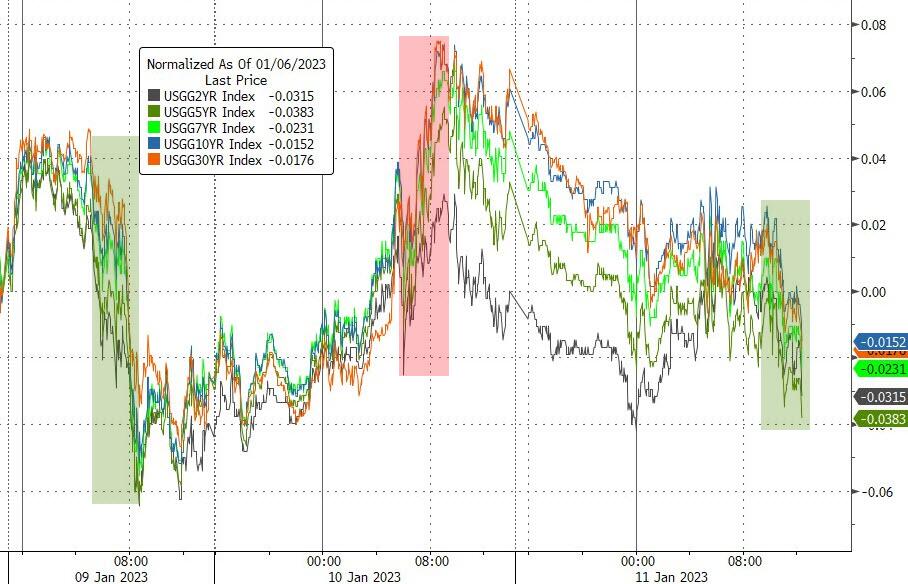
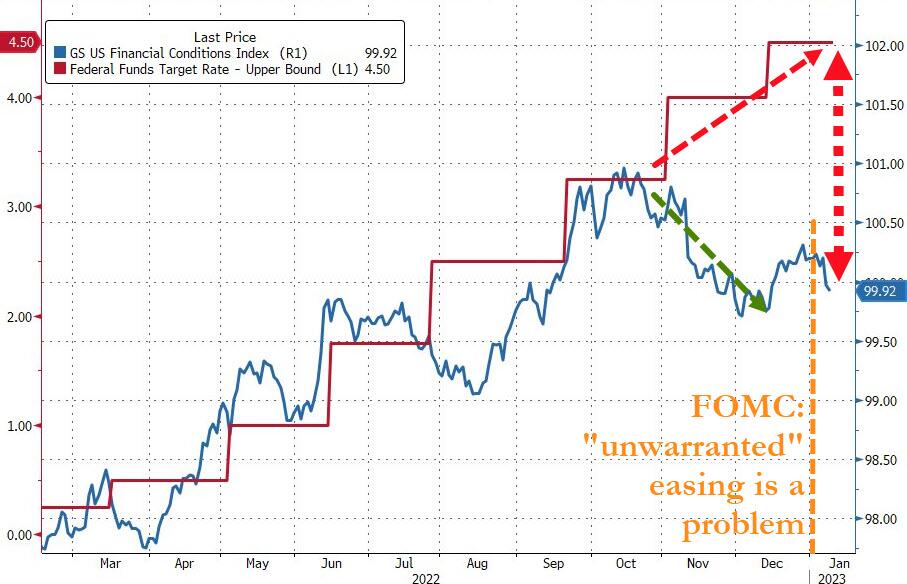
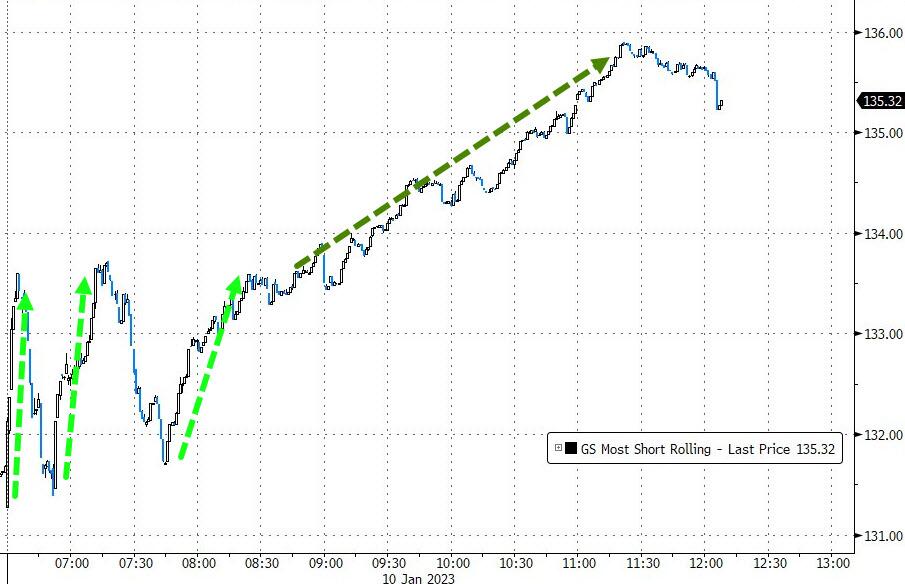
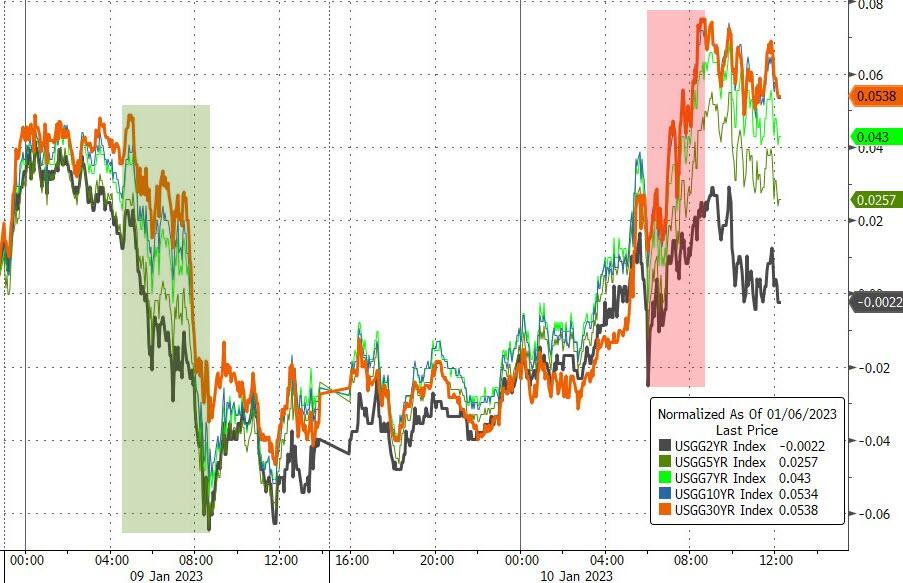
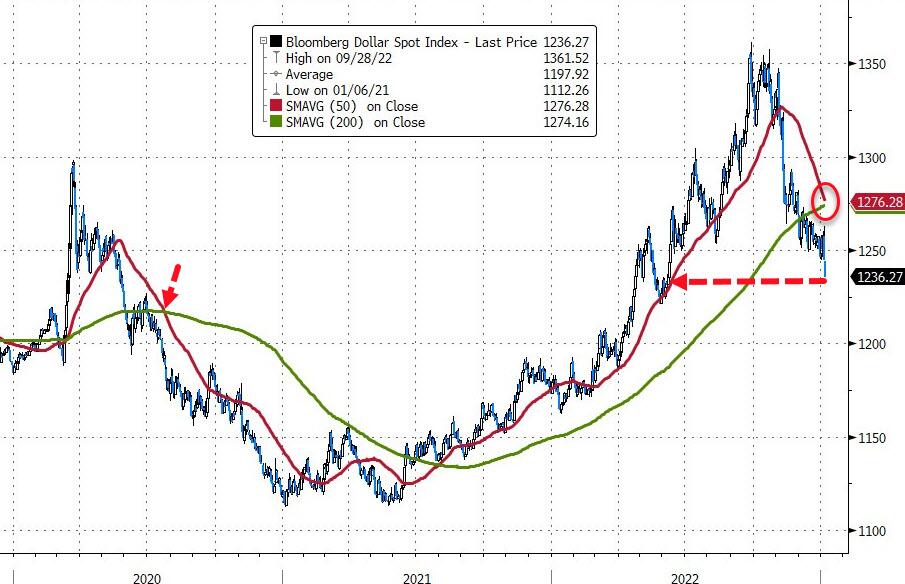
Again, the short squeeze continued unabated and has now pushed up the most shorted stocks an amazing 18% in the past week. Bond yields gave an assist this week by dipping lower, as Fed rate trajectory expectations drifted as well but bounced higher today, as ZeroHedge pointed out.

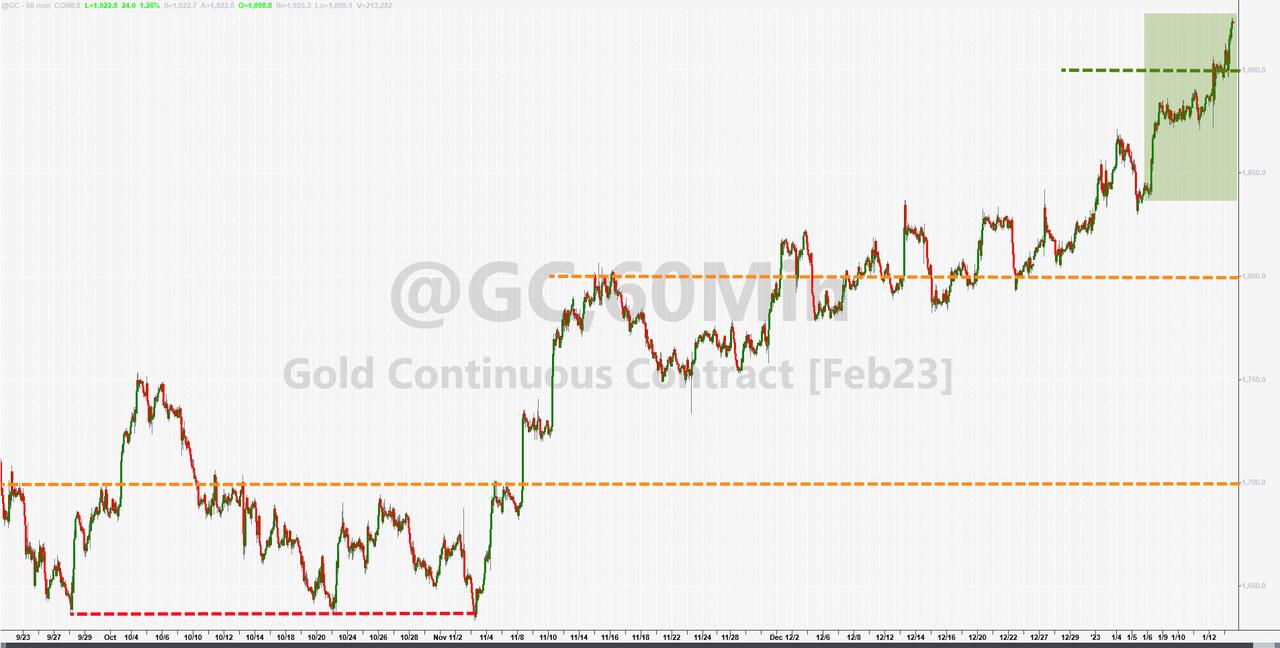
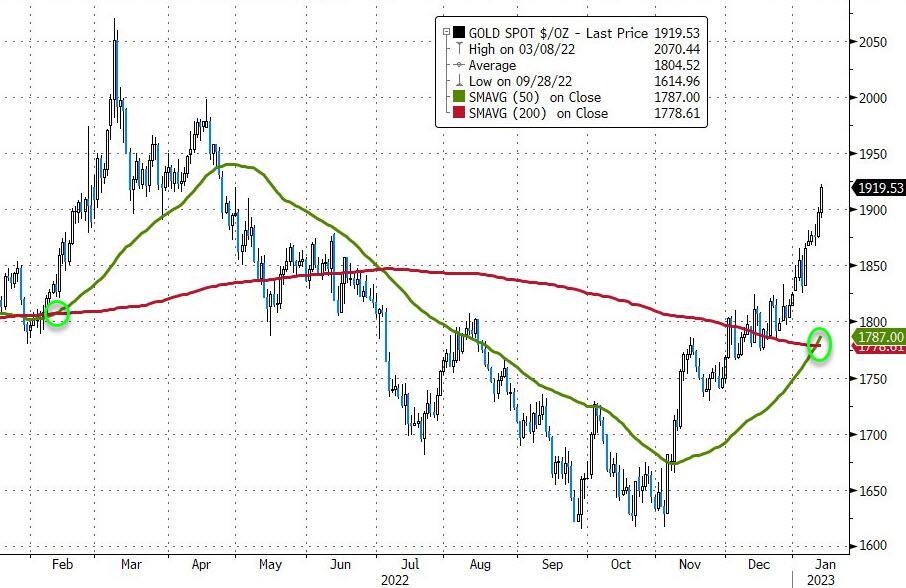
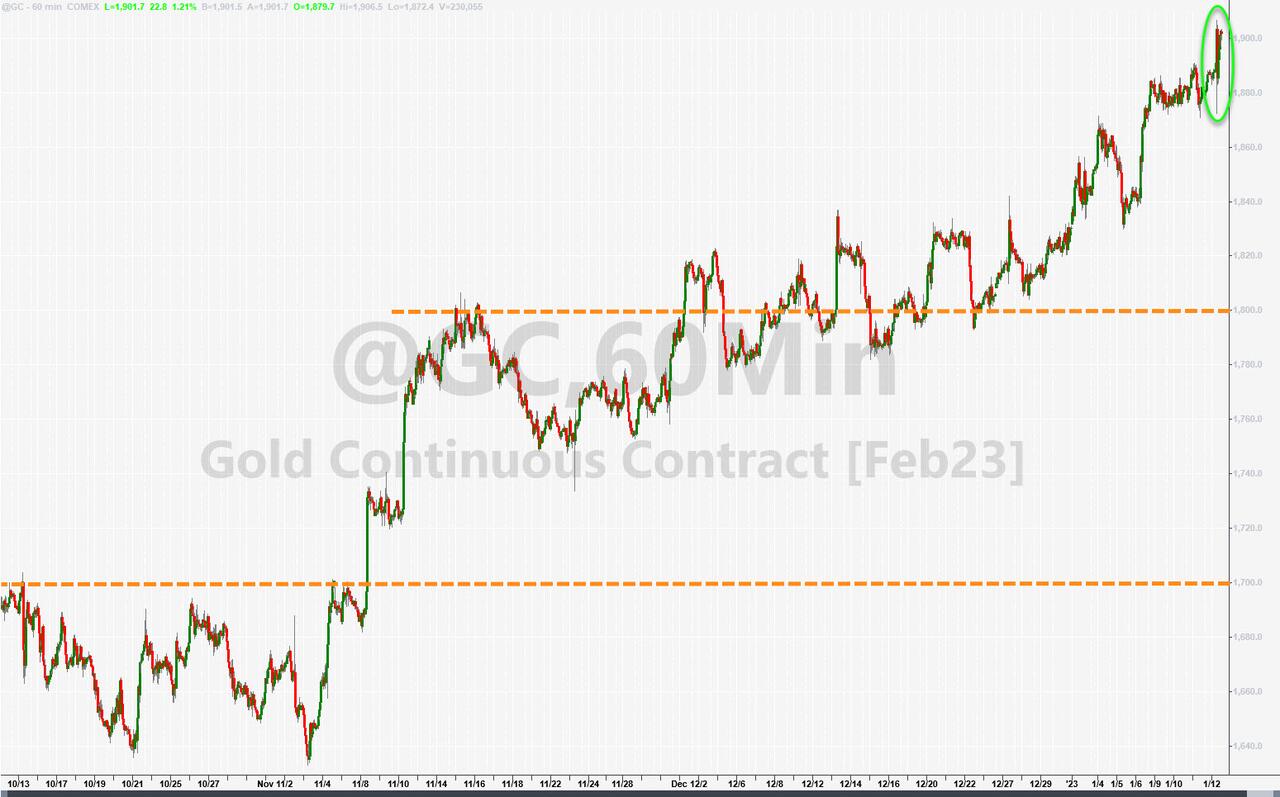
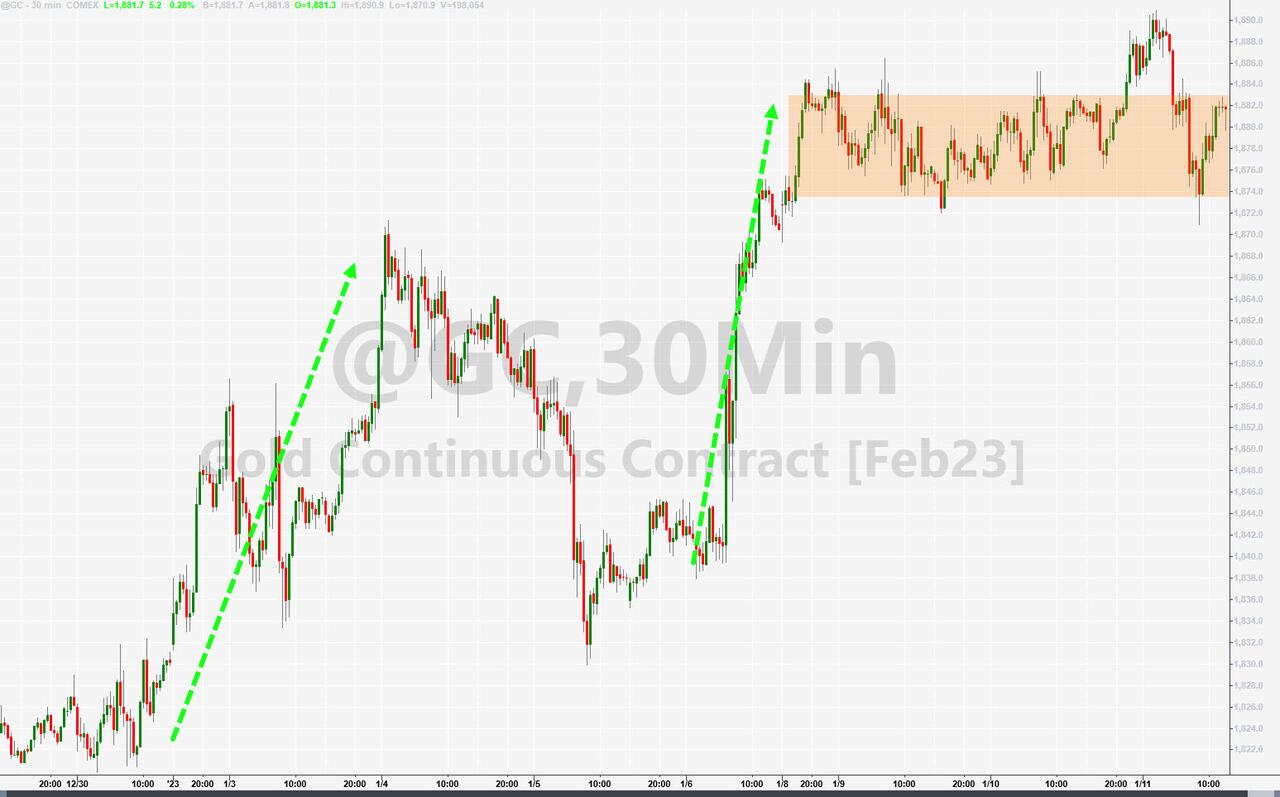
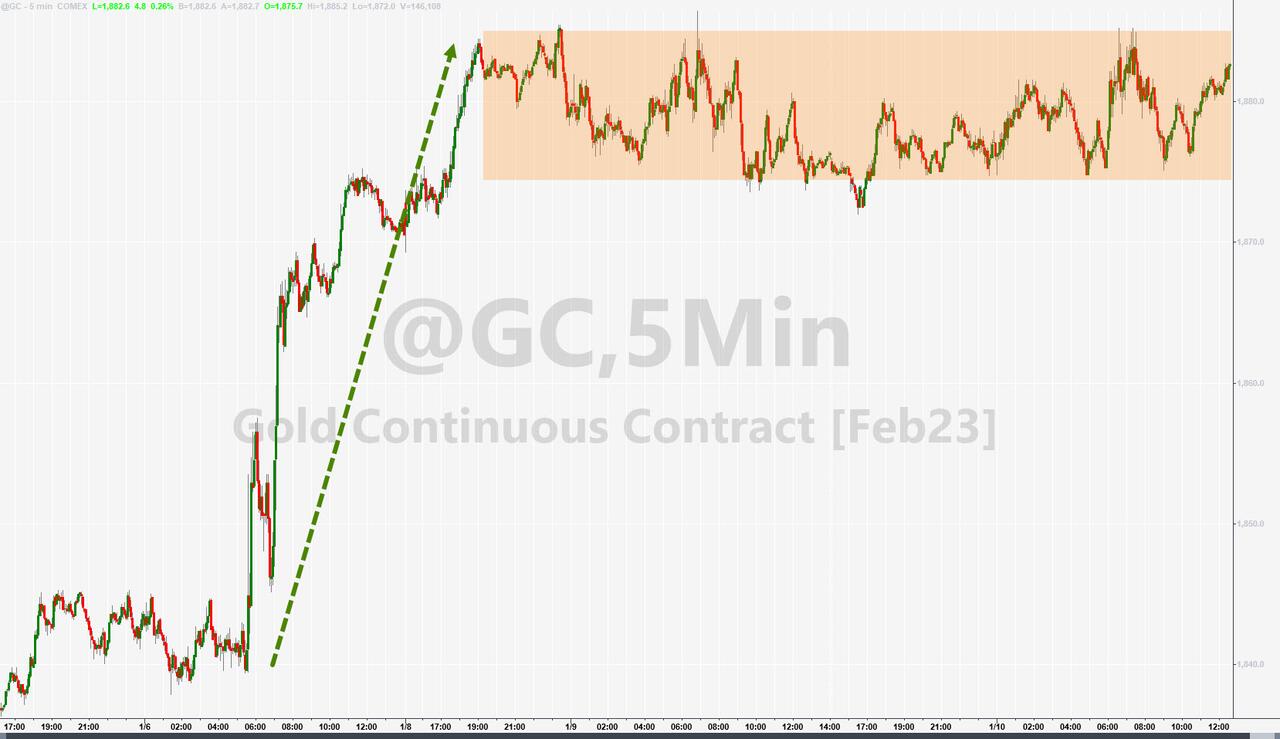
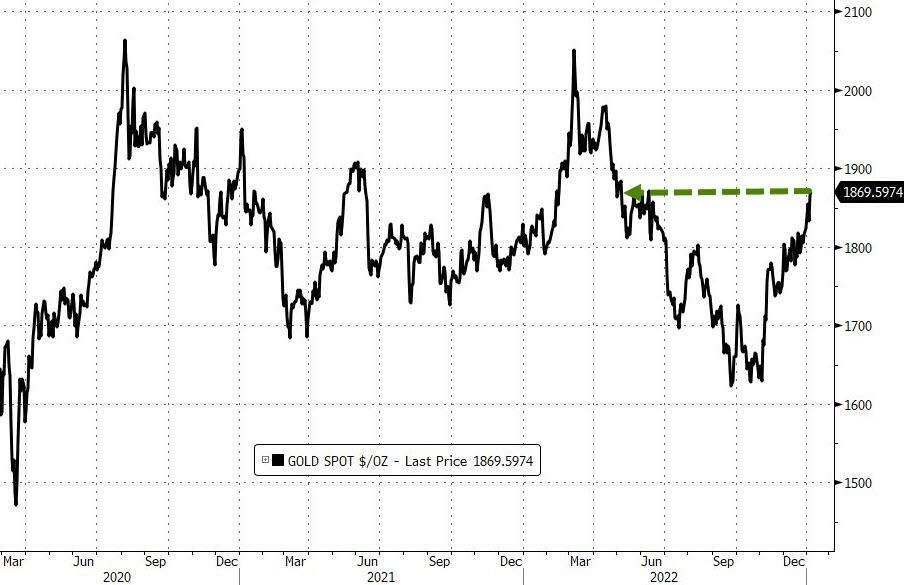
Gold continued its ramp to higher levels and has notched 6 straight days of gains to reach its highest level since April 2022. The precious metal triggered a golden cross, which is the moment in time when the 50-day M/A crosses its 200-day M/A, a very bullish sign.

Gold does well in an era of uncertainty, which Treasury Secretary Janet Yellen seemed to indicate we are heading into, when she said that the US will hit the debt ceiling next Thursday, an event which analysts referred to as “significant market pain.”

Read More

Weekly StatSheet For The ETF Tracker Newsletter – Updated Through 01/12/2023

Ulli ETF StatSheet Contact

ETF Data updated through Thursday, January 12, 2023

Methodology/Use of this StatSheet:

1. From the universe of over 1,800 ETFs, I have selected only those with a trading volume of over $5 million per day (HV ETFs), so that liquidity and a small bid/ask spread are assured.

2. Trend Tracking Indexes (TTIs)

Buy or Sell decisions for Domestic and International ETFs (section 1 and 2), are made based on the respective TTI and its position either above or below its long-term M/A (Moving Average). A crossing of the trend line from below accompanied by some staying power above constitutes a “Buy” signal. Conversely, a clear break below the line constitutes a “Sell” signal. Additionally, I use a 12% trailing stop loss on all positions in these categories to control downside risk.

3. All other investment arenas do not have a TTI and should be traded based on the position of the individual ETF relative to its own respective trend line (%M/A). That’s why those signals are referred to as a “Selective Buy.” In other words, if an ETF crosses its own trendline to the upside, a “Buy” signal is generated. Here too, I recommend trailing sell stop of 12%, or less, depending on your risk tolerance.

If you are unfamiliar with some of the terminology, please see Glossary of Terms and new subscriber information in section 9.     

1. DOMESTIC EQUITY ETFs: BUY — since 12/01/2022

Click on chart to enlarge

Our main directional indicator, the Domestic Trend Tracking Index (TTI-green line in the above chart) has reclaimed its long-term trend line (red) by +5.63% and remains in “Buy” mode for the time being.

Read More

CPI Pleases Markets

Ulli Uncategorized Contact

[Chart courtesy of MarketWatch.com]

  1. Moving the markets

Despite the CPI report syncing up with expectations of an increase of 6.5% YoY, it was the monthly dip of 0.1% in December from November that kept the bullish juices flowing and helped the Nasdaq to complete a 5-day winning streak.

The CPI excluding food and energy prices also met anticipations, which showed a month-over-month gain of 0.3%. The markets were pleased, but the bulls did not get overly excited and pushed the major indexes to only moderate gains.

Hope reigns supreme that these numbers, which only show a slight cooling of inflationary pressures for one month, are sufficient to convince the Fed that a slowdown in rate hikes might be appropriate. Given the Fed’s responses over the past few weeks, an imminent change in policy is highly unlikely. Yes, they will pivot eventually, but I don’t think we have arrived at that moment in time yet.

Few rallies are ever sustained without a short squeeze, and today was no exception as the squeeze continued for the 5th straight day. The S&P 500 briefly crossed its 200-day M/A to the upside but was not able to close above it.  

Bond yields tanked, thereby giving an assist to equities, with the 10-year dropping 18 bps to end the session at 3.44%. The US Dollar dropped to its lowest price since last May, while Gold had a great day by adding +1.2% and closing above $1,900.  

Read More

Gambling On A Positive CPI Report

Ulli Market Commentary Contact

[Chart courtesy of MarketWatch.com]

  1. Moving the markets

Stocks resumed their Ramp-A-Thon into tomorrow’s CPI report, as traders were betting that Thursday’s inflation data will present validation of a decelerating trend. Confidence reigned supreme that the Fed’s rate hikes had their planned impact and that a policy reversal might be on deck, as “the Fed will cave” story gained momentum.

While the CPI forecast still calls for a 6.5% increase from the prior year, prices are expected to have slipped a moderate 0.1% in December from the prior month. Even Bloomberg chimed in with the headline “Stocks Bounce Back with Brewing Optimism Over CPI,” as the hype shifted into overdrive.

A big assist came again from a short squeeze, forcing prices higher like they did ahead of December’s CPI, before plunging back to reality, as ZeroHedge put it. Trader Gurmit Kapoor clarified the importance of this upcoming data point as follows:

Tomorrow’s CPI event risk could be a decider where the S&P 500 can either break above its 200-day moving average, the 4,000 level and the downtrend line, or we head back to 3,800.

Bond yields retreated, the US Dollar stayed in its sideways channel, and Gold inched higher, but its move was marked by wild intraday swings.  

A tip of the hat goes to ZH for graphically pointing out what happened in December after a “soft” CPI print.

Will history repeat itself via following the adage “buy the rumor, sell the fact?”

Read More

Finding Support

Ulli Market Commentary Contact

[Chart courtesy of MarketWatch.com]

  1. Moving the markets

After much bobbing and weaving, the major indexes found some footing and closed in the green led by the Nasdaq with a 1% gain. Upcoming economic data points and corporate earnings later this week kept the rally in check.

All eyes were on Fed head Powell’s speech this morning and, as ZeroHedge pointed out, his view on current “unwarranted” easing of financial conditions. In the end, Powell said nothing and barely commented on monetary policy at all.

Traders took that as a bullish sign and, despite the looming CPI report on Thursday, pushed stocks higher and out of the doldrums. An assist came from a short squeeze, which finally had the desired effect after two failed attempts.  

Bond yields rose, the US Dollar went sideways, and Gold squeezed out some modest gains and maintaining last week’s advance.

I expect the sideways to slighter higher pattern to continue, until Thursday’s CPI will likely end the current tug-of-war between bulls and bears.

Continue reading…

2. “Buy” Cycle Suggestions

For the current Buy cycle, which started on 12/1/2022, I suggested you reference my most recent StatSheet for ETFs selections. However, if you came on board later, you may want to look at the most current version, which is published and posted every Thursday at 6:30 pm PST.

I also recommend for you to consider your risk tolerance when making your selections by dropping down more towards the middle of the M-Index rankings, should you tend to be more risk adverse. Likewise, a partial initial exposure to the markets, say 33% to start with, will reduce your risk in case of a sudden directional turnaround.

We are living in times of great uncertainty, with economic fundamentals steadily deteriorating, which will eventually affect earnings negatively and, by association, stock prices. I can see this current Buy signal to be short lived, say to the end of the year, and would not be surprised if it ends at some point in January.

In my advisor practice, we are therefore looking for limited exposure in value, some growth and dividend ETFs. Of course, gold has been a core holding for a long time.

With all investments, I recommend the use of a trailing sell stop in the range of 8-12% to limit your downside risk.

3. Trend Tracking Indexes (TTIs)

Our TTIs headed north, as the markets finished the session with bullish sentiment.

This is how we closed 01/10/2023:

Domestic TTI: +3.97% above its M/A (prior close +3.20%)—Buy signal effective 12/1/2022.

International TTI: +6.52% above its M/A (prior close +6.26%)—Buy signal effective

12/1/2022.

Disclosure: I am obliged to inform you that I, as well as my advisory clients, own some of the ETFs listed in the above table. Furthermore, they do not represent a specific investment recommendation for you, they merely show which ETFs from the universe I track are falling within the specified guidelines.

All linked charts above are courtesy of Bloomberg via ZeroHedge.

Thriving And Diving

Ulli Market Commentary Contact

[Chart courtesy of MarketWatch.com]

  1. Moving the markets

A continuation of Friday’s rally hit a overhead resistance, with the major indexes reversing direction and plunging below their respective unchanged lines. The exception was the Nasdaq, which managed to hang on to a +0.63% gain, as traders scooped up some of the beaten-up shares like Tesla.

Optimism ruled, compared to the end of 2022, as traders are convinced that inflation may be easing, which explains today’s preference of “growth” assets over “value” ones. Whether that relentless hope will pay off remains to be seen, because the Fed has constantly emphasized its narrative of “no rate cuts” this year.

Market participants simply refuse to accept any Fed jawboning, with today being a perfect example, as ZeroHedge noted:

Fed’s Daly: “Getting inflation down to 2% won’t be completed this year.”

Fed’s Bostic: “I favor hiking rates to 5-5.25%, then hold through 2024. We are just going to have to hold our resolve and let the policy work.”

Bond yields dropped and gave an assist to the early rally, but in the end, they could not keep the markets propped up. The US Dollar slid, and Gold extended its gains to its highest since May 2022.  

All eyes are on Thursday’s CPI report and big bank earnings due out Friday, both of which could have market moving effects in either direction.

Read More