Stalling At The 200-Day M/A—Again

Ulli Market Commentary Contact

[Chart courtesy of MarketWatch.com]

  1. Moving the markets

The markets took a hit today, as January’s bullish momentum ran into a glass ceiling, namely the S&P’s 200-day M/A, which had derailed every rally in 2022, as this chart shows:

Only time will tell, if this is the beginning of another leg down, after the S&P has now “lost” its 200-day M/A again.  

Contributing to today’s Dump-A-Thon were weak economic data points, including huge misses in Producer Price Index (PPI), retail sales and industrial production confirming once again that the economy continues to slide into recession territory. With Microsoft planning on laying off some 10k employees, the Dow suffered the most from today’s sell off.

Sure, after 2 weeks of bullishness, some profit taking has set in, but more so the realization that a recessionary environment is not conducive to higher earnings, because it ultimately decides the value of stock prices.

The theme of a soft landing was put on the back burner, as odds of an eventual hard landing have increased due to the above-mentioned weak data points. Even the Fed’s terminal rate expectation took a hit, as traders are convinced that the Fed will pause in May and then begin a massive rate-cutting pivot, as ZeroHedge described it.   

That wishful thinking is totally engrained in the Wall Street community, so much so that despite multiple Fed mouthpieces today agreeing that “inflation is down but not enough to stop yet and rates will go higher and stay higher for longer,” market participants are stubbornly sticking to their opposite view.

And, as you might have expected on a sell off like today, the short squeezers had no ammo left for another bullish assist.

Bond yields plummeted with the 10-year dropping to a level last seen in September. After riding the intra-day roller coaster, the US Dollar ended just about unchanged. Gold followed a similar pattern and closed a tad lower but remained above its $1,900 level.

Another battle will be starting tomorrow, as the debt ceiling limit makes its presence known. This may turn into an endless and possibly market moving tug-of-war, until final decisions will have to be made by around June 2023, before the national credit card expires.

Read More

Pulling Off The Lofty Levels

Ulli Market Commentary Contact

[Chart courtesy of MarketWatch.com]

  1. Moving the markets

Bank earnings took front and center, as Morgan Stanley posted better-than-expected numbers, thereby pushing up its stock price +6%. However, banking powerhouse Goldman Sachs reported its worst earnings miss in a decade, with its stock price being pummeled at the tune of -6%. JPM’s and Citigroup’s results were mixed.

As a result, the effect on the major indexes diverged, with the Dow losing some 400 points, thanks to Goldman Sachs, the S&P 500 dropping a tiny -0.2%, while the Nasdaq squeezed out a green close, albeit a tiny one.

On the economic front, we learned that the Manufacturing Survey, which shows the NY Fed’s general business conditions, simply collapsed, with the index dropping nearly 22 points to -32.9 this month, which was twice as bad as the weakest analyst estimate, as ZeroHedge pointed out.  

There was no bright spot in the report, as New Orders dropped, Shipments plunged, and Factory Employment fell to its weakest level in more than two years. Ouch! But, not to worry, the theme of a “soft landing” is alive and well.  

Bond yields were mixed today, the short squeeze continued, the dollar drifted lower, and Gold slipped but remained above its $1,900 level.

Hope continues in the trading community that the Fed will pause or cut rates soon, which is not likely, as lessons learned point to 1980. It was the moment in time when then Fed chairman Volcker cut rates too soon, after the CPI slipped, only to see inflation roar back forcing him to reverse course and go back into hiking mode. Bloomberg demonstrates that phenomenon in this chart.

This is something that the Wall Street crowd has not begun to grasp yet, but once they do, the bears will have a good chance to dominate market direction again.  

Read More

ETFs On The Cutline – Updated Through 01/13/2023

Ulli ETFs on the Cutline Contact

Below, please find the latest High-Volume ETF Cutline report, which shows how far above or below their respective long-term trend lines (39-week SMA) my currently tracked ETFs are positioned.

This report covers the HV ETF Master List from Thursday’s StatSheet and includes 312 High Volume ETFs, defined as those with an average daily volume of more than $5 million, of which currently 236 (last report: 179) are hovering in bullish territory. The yellow line separates those ETFs that are positioned above their trend line (%M/A) from those that have dropped below it.

Take a look:                                                                   

The HV ETF Master Cutline Report

In case you are not familiar with some of the terminology used in the reports, please read the Glossary of Terms. If you missed the original post about the Cutline approach, you can read it here.      

ETF Tracker Newsletter For January 13, 2023

Ulli ETF Tracker Contact

ETF Tracker StatSheet          

You can view the latest version here.

CONQUERING THE FLAT LINE

[Chart courtesy of MarketWatch.com]

  1. Moving the markets

After digging themselves out of an early hole, the major indexes crawled back slowly and surely to end another session on a positive note.

Q4 bank earnings were on the agenda, as JP Morgan beat revenue expectations but warned that it’s setting aside more money, an increase of 49% from Q3, to cover credit losses for what they termed a “mild recession.” The stock slipped initially but recovered late in the day.

Wells Fargo (WF) disappointed, with the stock dropping 4%, and BofA as well slid despite better-than-expected Q4 earnings. WF also added that it’s preparing for the economy to “get worse than it’s been over the last few quarters.”

Still, the S&P recorded its best week since November, as MarketWatch pointed out, and scored its second winning week in a row but falling just short of reclaiming its $4k level.

On the economic front, the Consumer sentiment survey showed that 1-year inflation expectations dropped to 4%, vs. 4.3% expected, which is the lowest 1-year outlook since April 2021.

Again, the short squeeze continued unabated and has now pushed up the most shorted stocks an amazing 18% in the past week. Bond yields gave an assist this week by dipping lower, as Fed rate trajectory expectations drifted as well but bounced higher today, as ZeroHedge pointed out.

Gold continued its ramp to higher levels and has notched 6 straight days of gains to reach its highest level since April 2022. The precious metal triggered a golden cross, which is the moment in time when the 50-day M/A crosses its 200-day M/A, a very bullish sign.

Gold does well in an era of uncertainty, which Treasury Secretary Janet Yellen seemed to indicate we are heading into, when she said that the US will hit the debt ceiling next Thursday, an event which analysts referred to as “significant market pain.”

Read More

Weekly StatSheet For The ETF Tracker Newsletter – Updated Through 01/12/2023

Ulli ETF StatSheet Contact

ETF Data updated through Thursday, January 12, 2023

Methodology/Use of this StatSheet:

1. From the universe of over 1,800 ETFs, I have selected only those with a trading volume of over $5 million per day (HV ETFs), so that liquidity and a small bid/ask spread are assured.

2. Trend Tracking Indexes (TTIs)

Buy or Sell decisions for Domestic and International ETFs (section 1 and 2), are made based on the respective TTI and its position either above or below its long-term M/A (Moving Average). A crossing of the trend line from below accompanied by some staying power above constitutes a “Buy” signal. Conversely, a clear break below the line constitutes a “Sell” signal. Additionally, I use a 12% trailing stop loss on all positions in these categories to control downside risk.

3. All other investment arenas do not have a TTI and should be traded based on the position of the individual ETF relative to its own respective trend line (%M/A). That’s why those signals are referred to as a “Selective Buy.” In other words, if an ETF crosses its own trendline to the upside, a “Buy” signal is generated. Here too, I recommend trailing sell stop of 12%, or less, depending on your risk tolerance.

If you are unfamiliar with some of the terminology, please see Glossary of Terms and new subscriber information in section 9.     

1. DOMESTIC EQUITY ETFs: BUY — since 12/01/2022

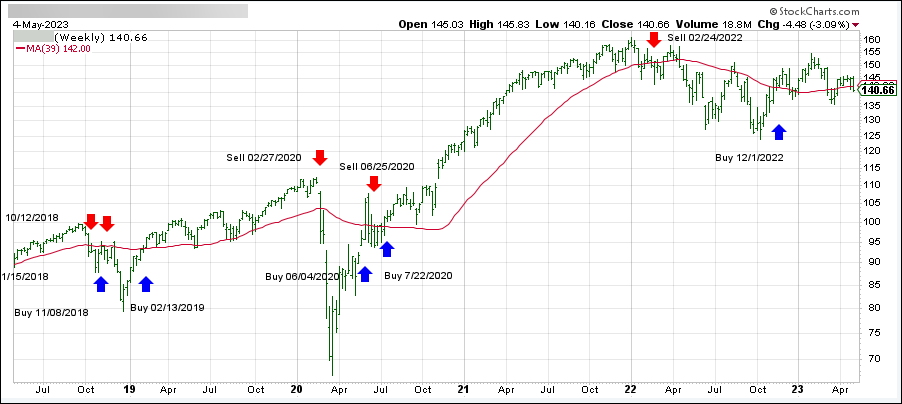
Click on chart to enlarge

Our main directional indicator, the Domestic Trend Tracking Index (TTI-green line in the above chart) has reclaimed its long-term trend line (red) by +5.63% and remains in “Buy” mode for the time being.

Read More

CPI Pleases Markets

Ulli Uncategorized Contact

[Chart courtesy of MarketWatch.com]

  1. Moving the markets

Despite the CPI report syncing up with expectations of an increase of 6.5% YoY, it was the monthly dip of 0.1% in December from November that kept the bullish juices flowing and helped the Nasdaq to complete a 5-day winning streak.

The CPI excluding food and energy prices also met anticipations, which showed a month-over-month gain of 0.3%. The markets were pleased, but the bulls did not get overly excited and pushed the major indexes to only moderate gains.

Hope reigns supreme that these numbers, which only show a slight cooling of inflationary pressures for one month, are sufficient to convince the Fed that a slowdown in rate hikes might be appropriate. Given the Fed’s responses over the past few weeks, an imminent change in policy is highly unlikely. Yes, they will pivot eventually, but I don’t think we have arrived at that moment in time yet.

Few rallies are ever sustained without a short squeeze, and today was no exception as the squeeze continued for the 5th straight day. The S&P 500 briefly crossed its 200-day M/A to the upside but was not able to close above it.  

Bond yields tanked, thereby giving an assist to equities, with the 10-year dropping 18 bps to end the session at 3.44%. The US Dollar dropped to its lowest price since last May, while Gold had a great day by adding +1.2% and closing above $1,900.  

Read More