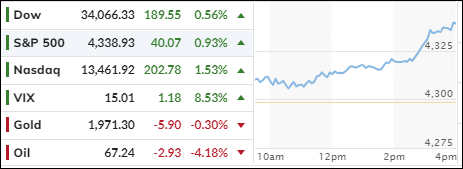
The S&P 500 soared to a 13-month high as traders bet on the Fed holding off on raising interest rates this week. The Fed has already hiked rates 10 times in a row, but now the odds are 74% in favor of a pause.
Maybe tomorrow’s inflation report will confirm that view, as analysts predict a drop from 4.9% to 4% in May. That would be good news for the markets, even if the economy is slowing down. Who cares about earnings when rates are going down, right?
Of course, the Fed won’t admit they are giving in to market pressure. They will still talk tough about fighting inflation and keeping their options open. But the markets are convinced that the tide has turned, and rates will start to fall soon.
That boosted the Nasdaq but left the Small Caps behind. It could be a wild week, though, if inflation surprises to the upside and spoils the party.
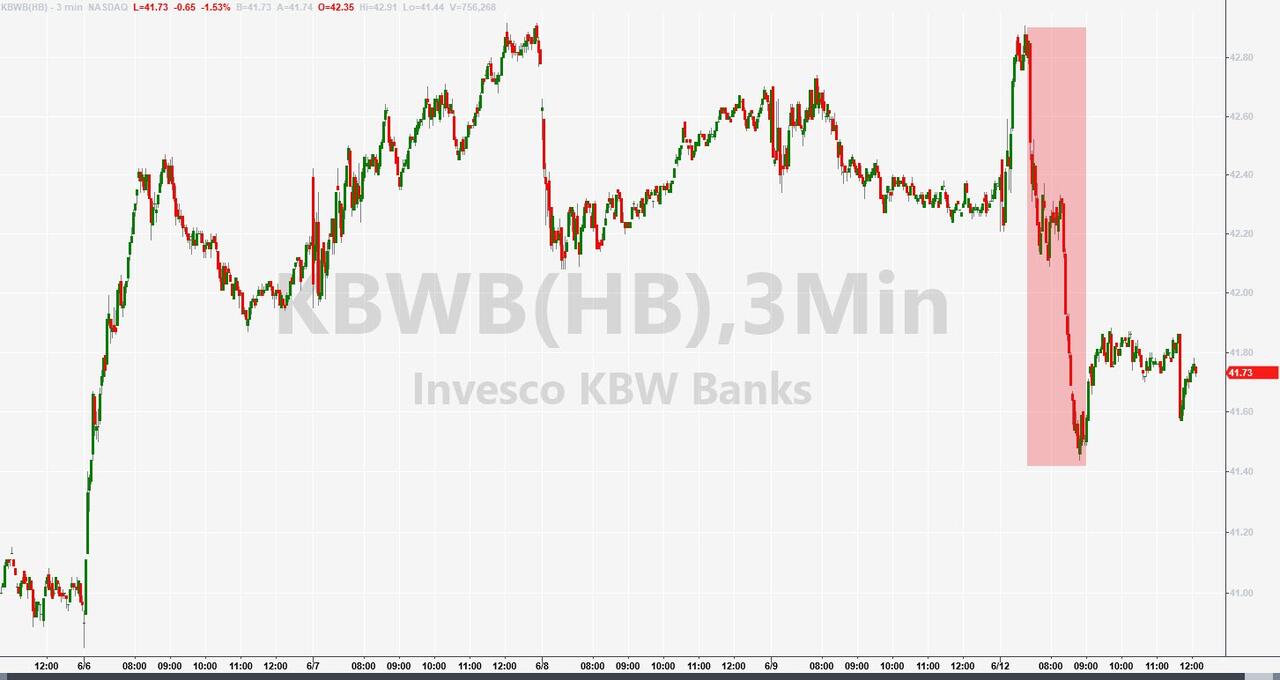
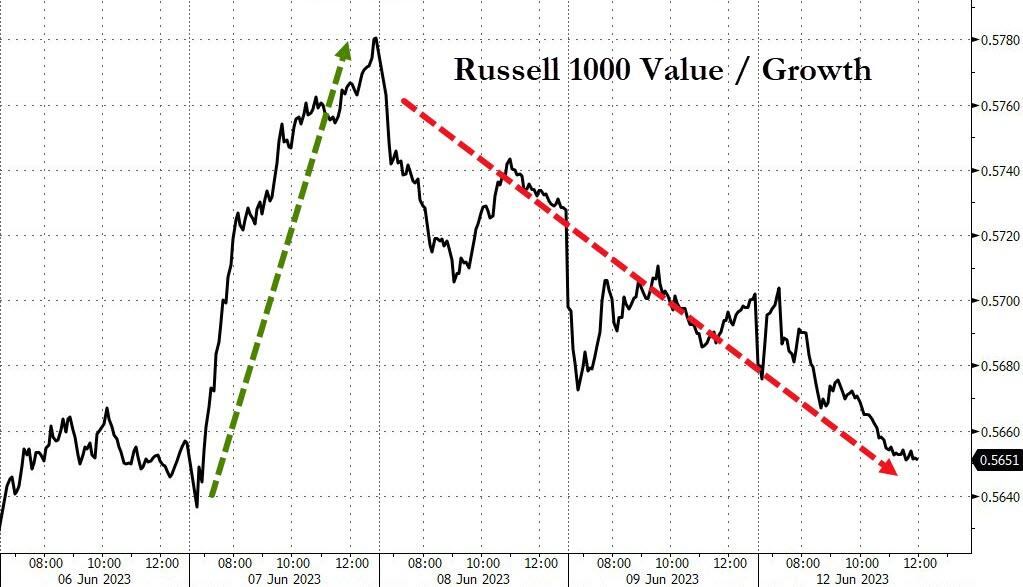
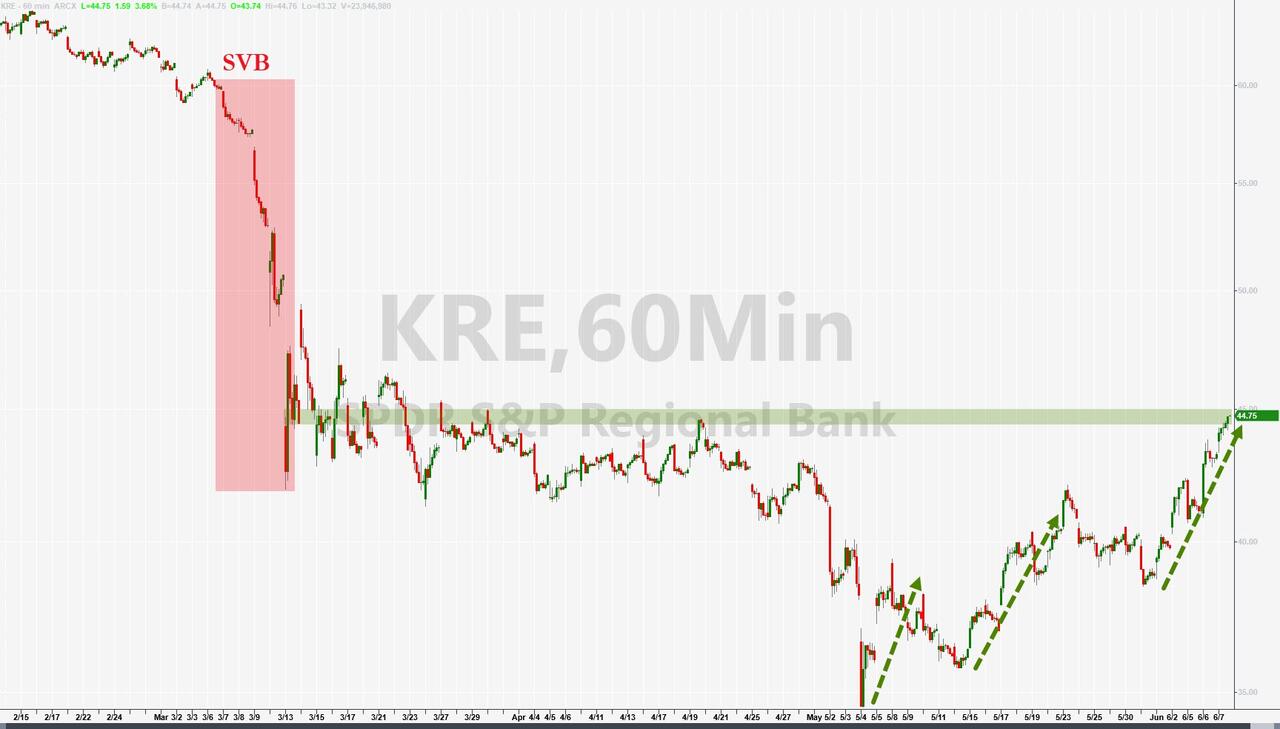
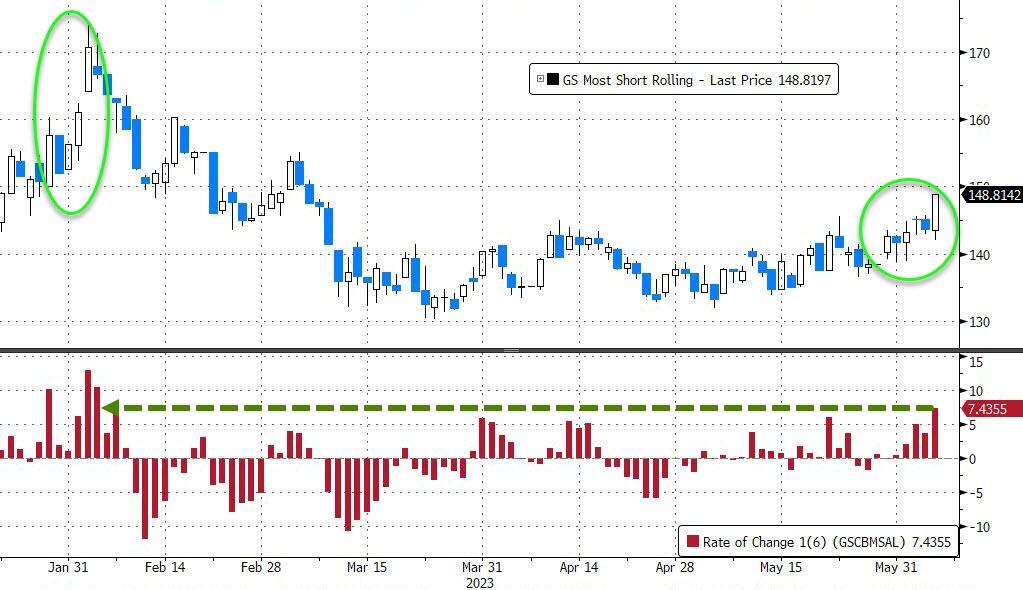
The banks were weak, and the value stocks lost their shine from last week. As ZeroHedge showed with this chart, chasing trends is risky when the markets are so uncertain. One day you’re a winner, the next day you’re a loser.
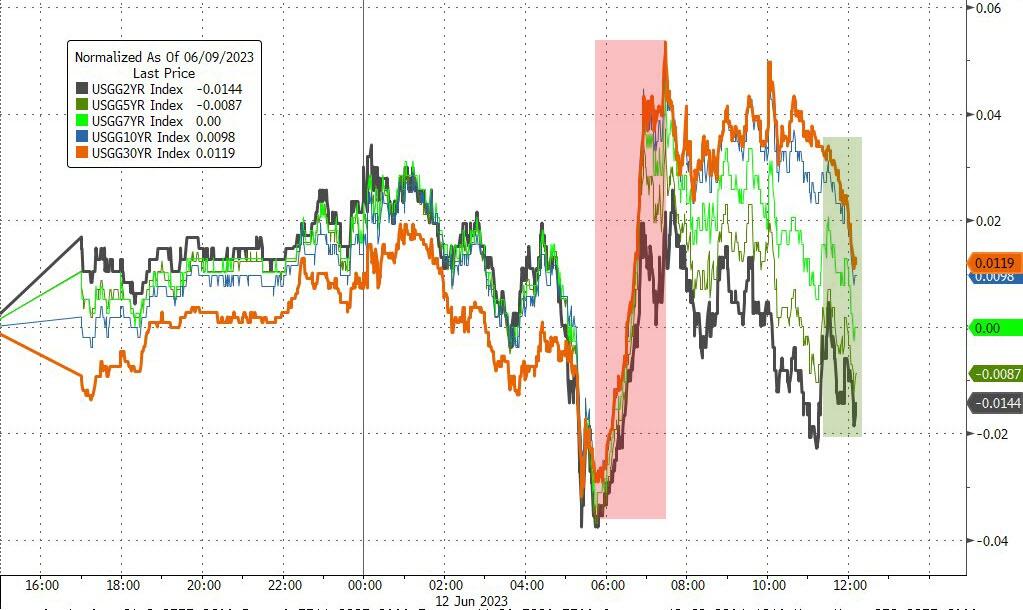
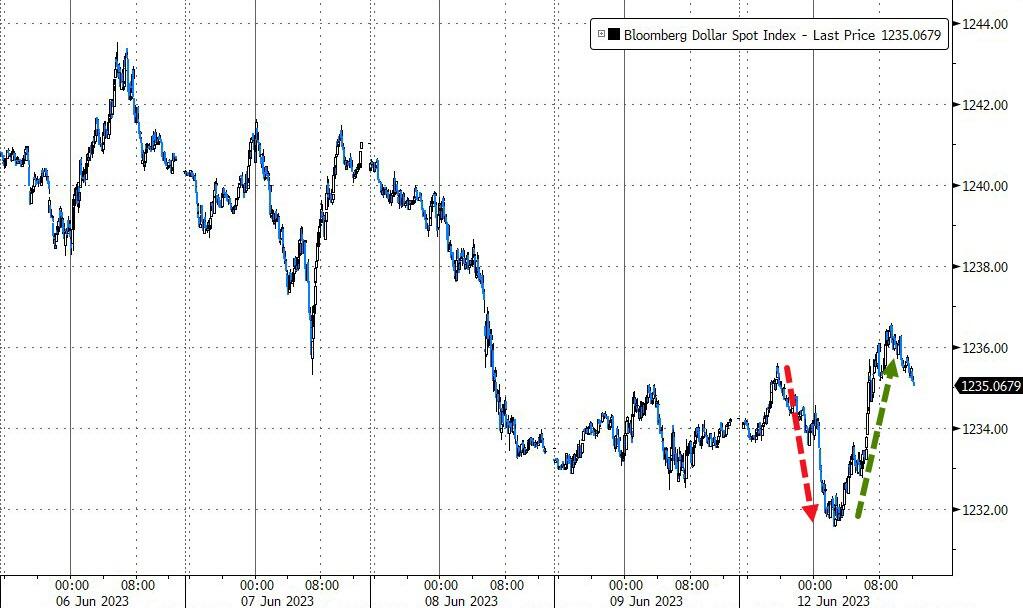
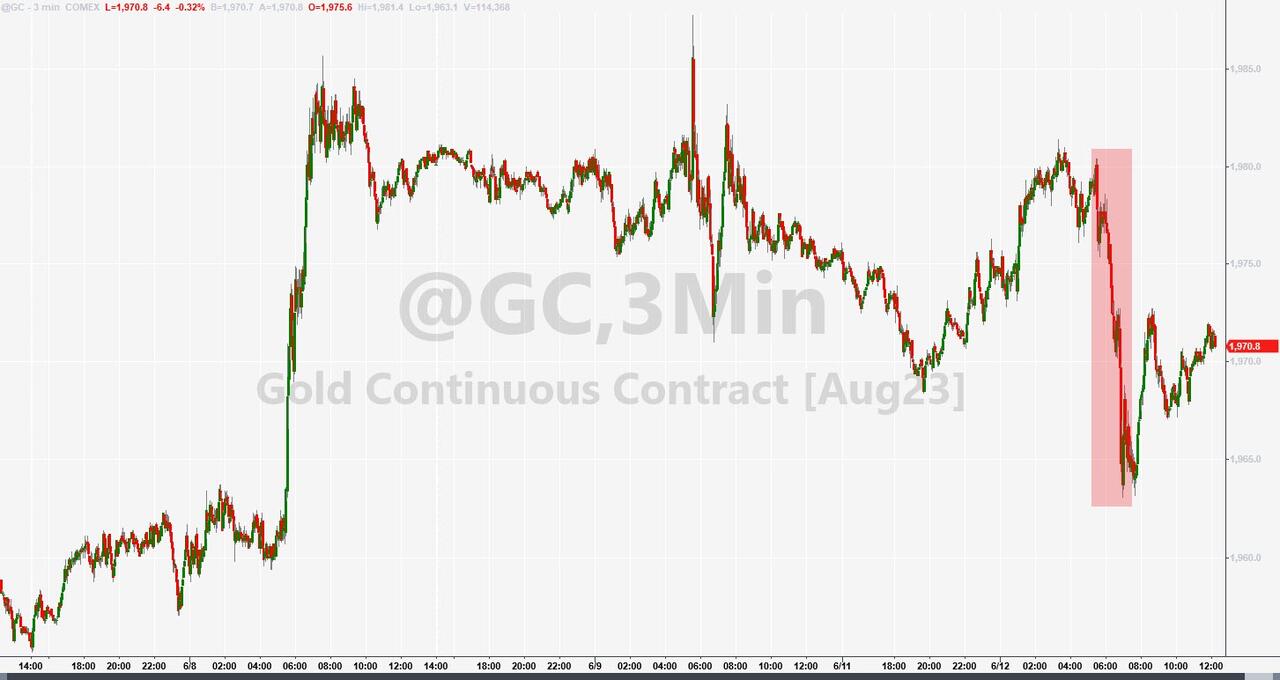
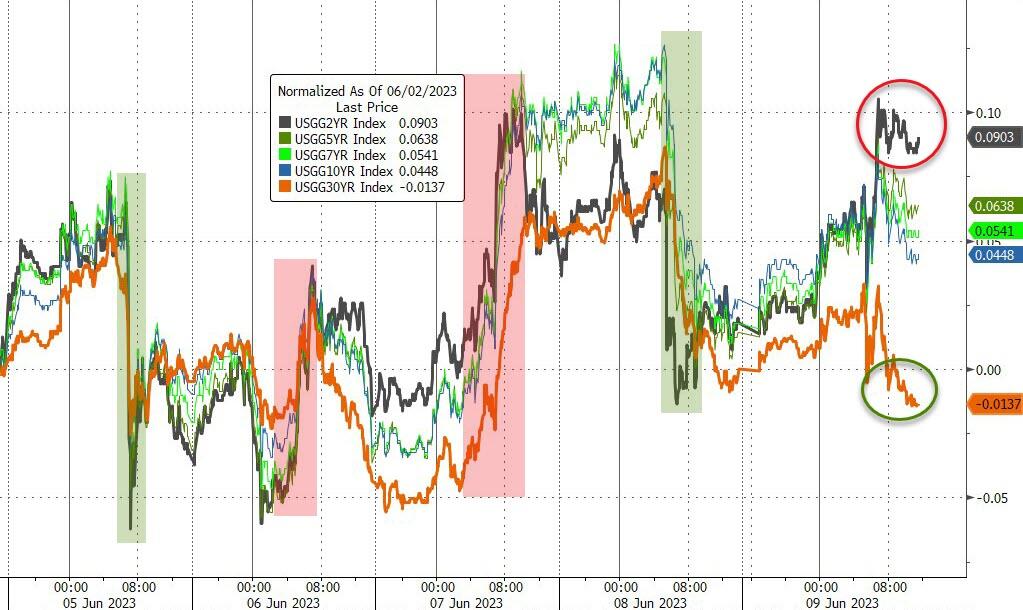
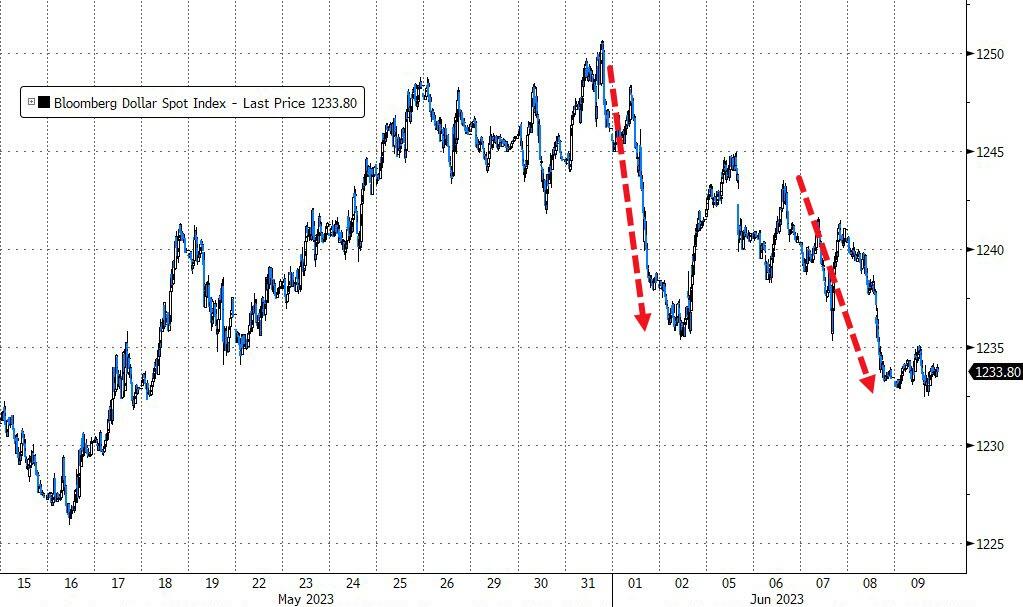
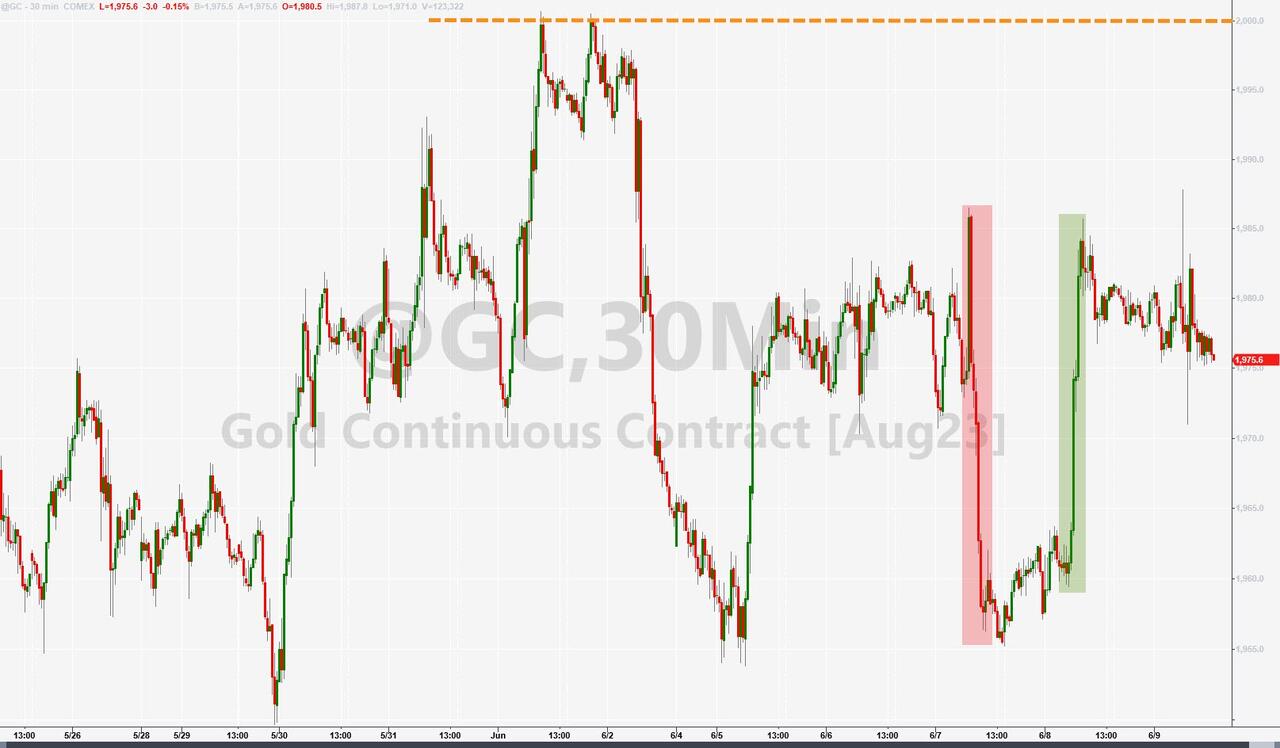
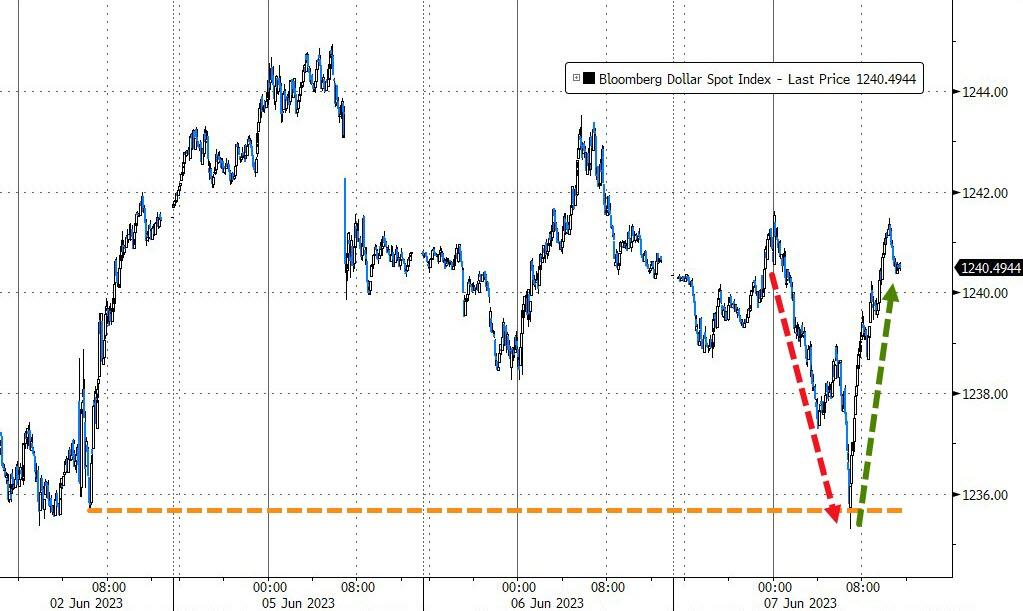
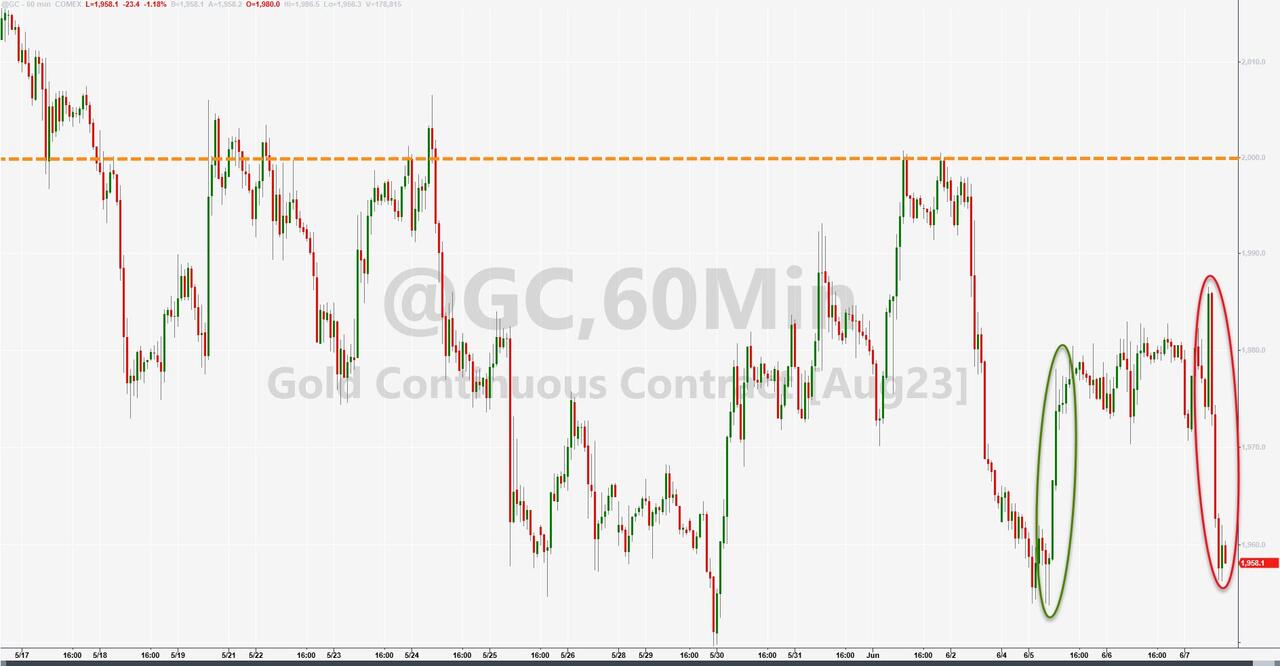
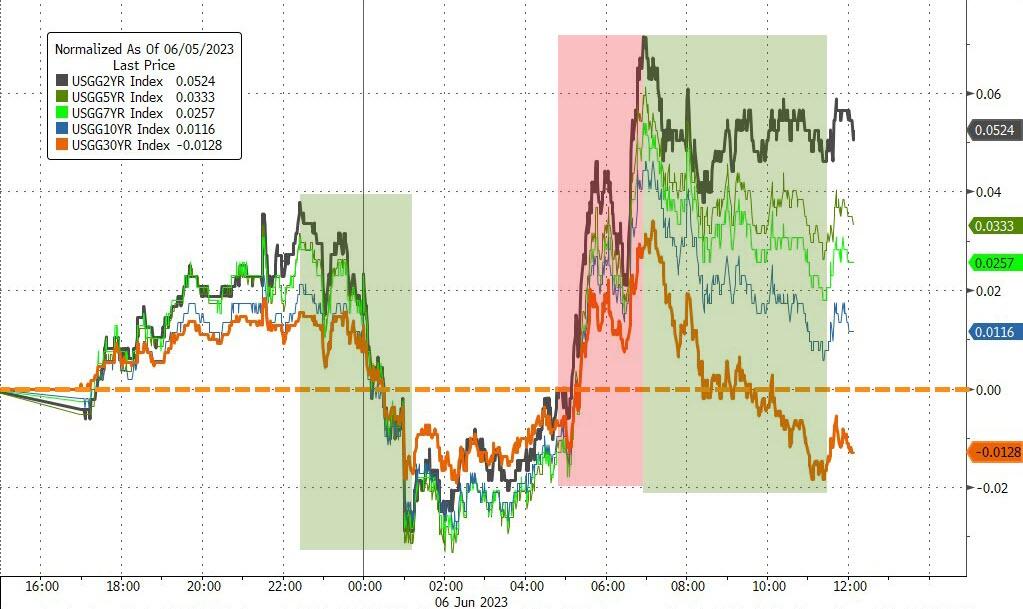
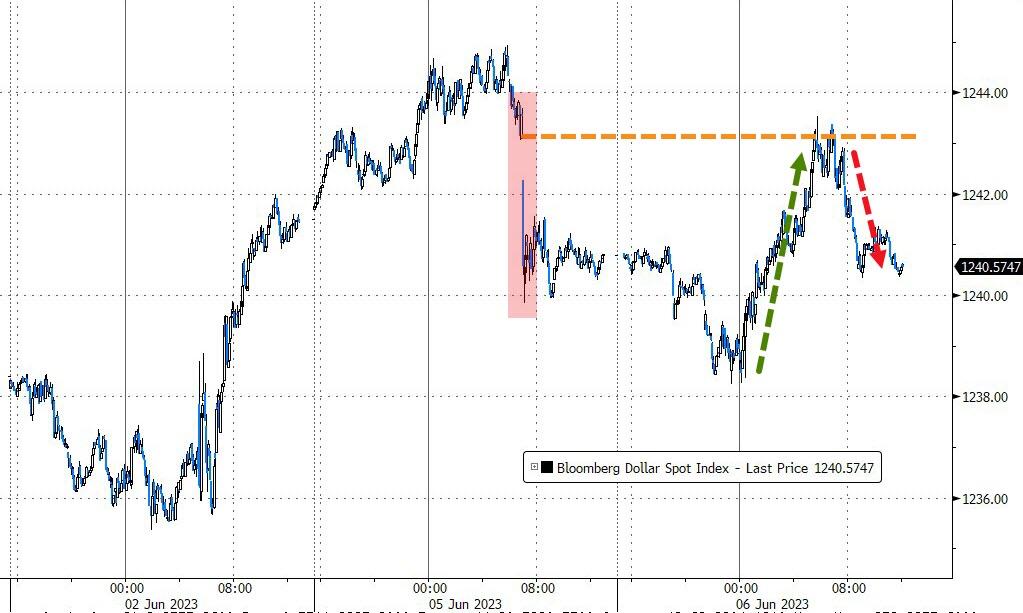
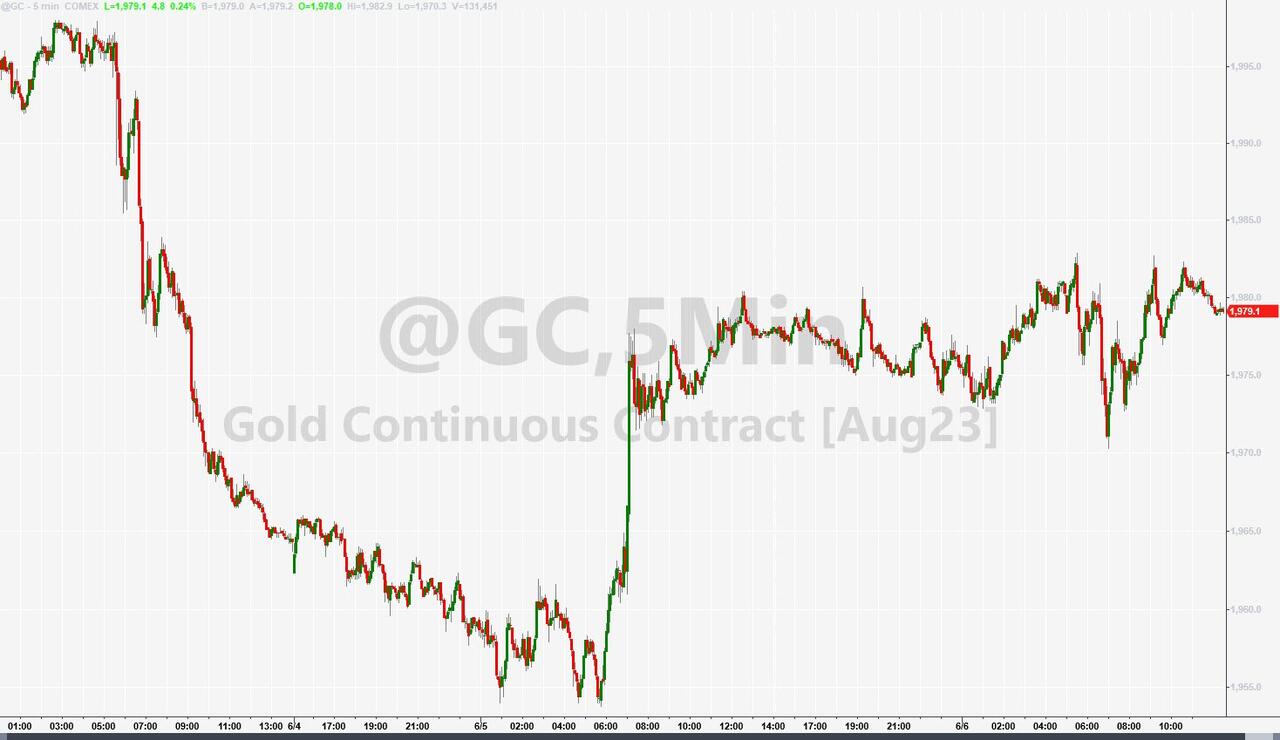
Bond yields spiked at first but then settled down, leaving the 10-year unchanged. The US Dollar edged up, while Gold swung back and forth and ended slightly lower.
The markets are “hooked on hope” that the Fed will do what they want and keep rates steady. But what if they don’t?
Do you want to know which ETFs are hot and which ones are not? Then you need my High-Volume ETF Cutline report. It tells you how close or far each of the 312 ETFs I follow is from its long-term trend line (39-week SMA). These are the ETFs that trade more than $5 million a day, so they are not some obscure funds that nobody cares about.
The report is split into two parts: The winners that are above their trend line (%M/A), and the losers that are below it. The yellow line is the line of shame that separates them. You can see how many ETFs are in each group and how they have changed since the last report (182 vs. 183)
THE STOCK MARKET BUBBLE AND THE TRILEMMA: WHAT’S NEXT?
[Chart courtesy of MarketWatch.com]
Moving the markets
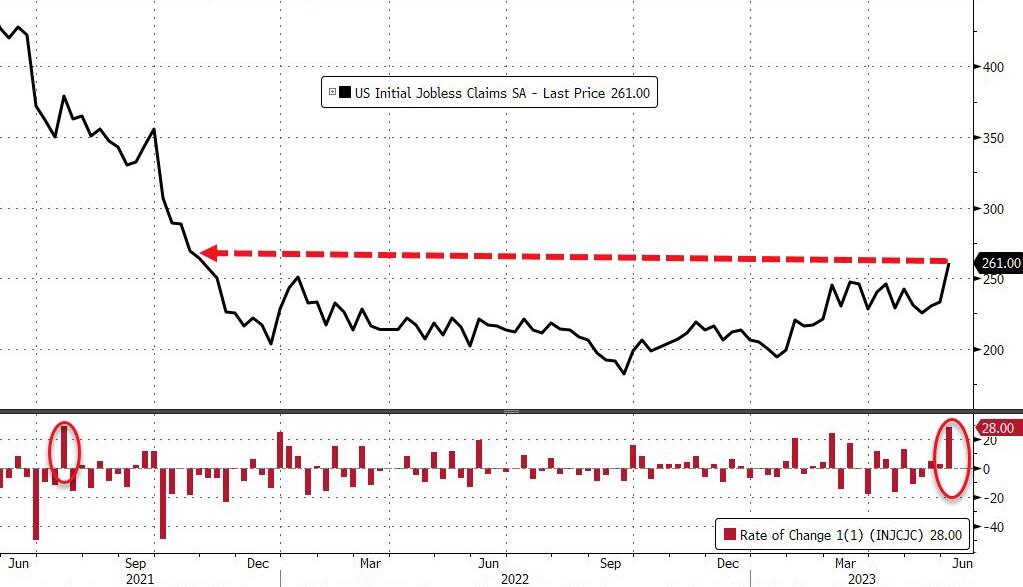
The tech rally seems unstoppable, even as the economy struggles. Just look at the latest jobless claims, which hit a new high since last October. Sure, some people found work and left the benefit rolls, but that’s hardly a sign of recovery.
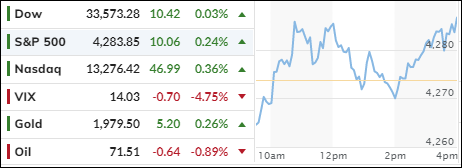
Meanwhile, the stock market is living in its own bubble, ignoring the bad news and cheering for more stimulus. The S&P 500 reached a new record of 4,300 before retreating slightly, ending the week with a modest gain of 0.4%.
But it’s not all doom and gloom. Some other sectors, like small caps, are joining the party, making the rally more broad-based and sustainable. If this trend continues, investors might become more optimistic and confident.
Of course, a lot depends on what happens next week. We’ll get the latest inflation data, which is expected to show some improvement. And we’ll hear from the Fed, which might pause its rate hikes for a while. That would be music to the ears of the bulls, who are betting on more easy money.
But what if they’re wrong? What if inflation is worse than expected, or the Fed sticks to its hawkish stance? Then we might see a reversal of fortunes, with the bears taking over and the bulls running for cover.
The bond market was mixed this week, with short-term yields rising and long-term yields falling. The dollar weakened for the second week in a row. Gold had a good run but also faced some volatility.
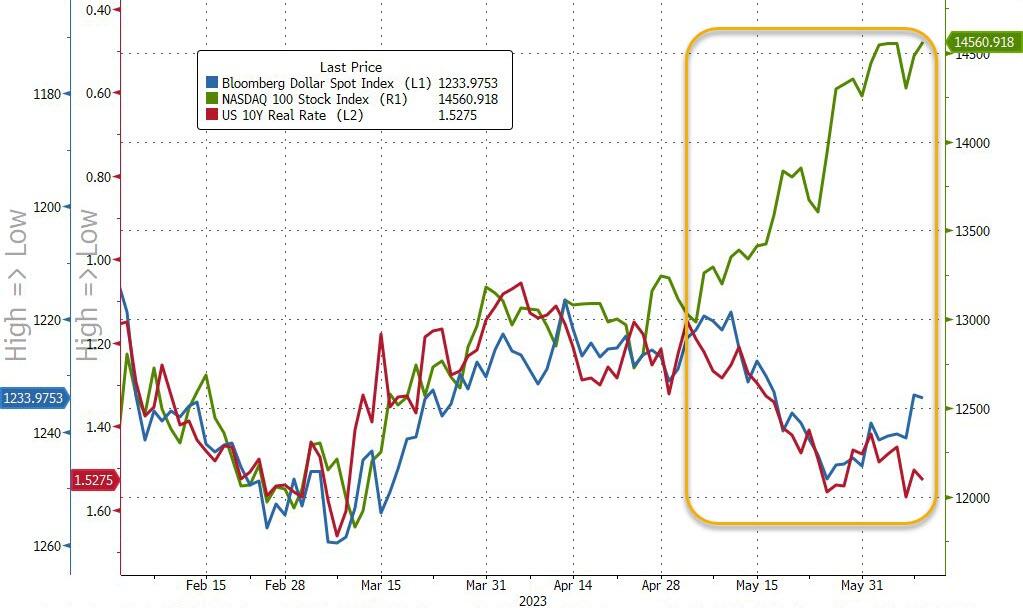
We’re in a tricky situation right now, as ZeroHedge puts it, with three things that don’t make sense together: the dollar, tech stocks and real rates. Can you spot the odd one out in this chart?
Out of the 1,800+ ETFs out there, I only pick the ones that trade over $5 million per day (HV ETFs), so you don’t get stuck with a lemon that nobody wants to buy or sell.
Trend Tracking Indexes (TTIs)
These are the main indicators that tell you when to buy or sell Domestic and International ETFs (section 1 and 2). They do that by comparing their position to their long-term M/A (Moving Average). If they cross above, and stay there, it’s a green light to buy. If they fall below, and keep going, it’s a red light to sell. And to make sure you don’t lose your shirt if things go south, I also use a 12% trailing stop loss on all positions in these categories.
All other investment areas don’t have a TTI and should be traded based on the position of each ETF relative to its own trend line (%M/A). That’s why I call them “Selective Buy.” In other words, if an ETF goes above its own trend line, you can buy it. But don’t forget to use a trailing sell stop of 12%, or less if you’re feeling nervous.
If some of these words sound like Greek to you, please check out the Glossary of Terms and new subscriber information in section 9.
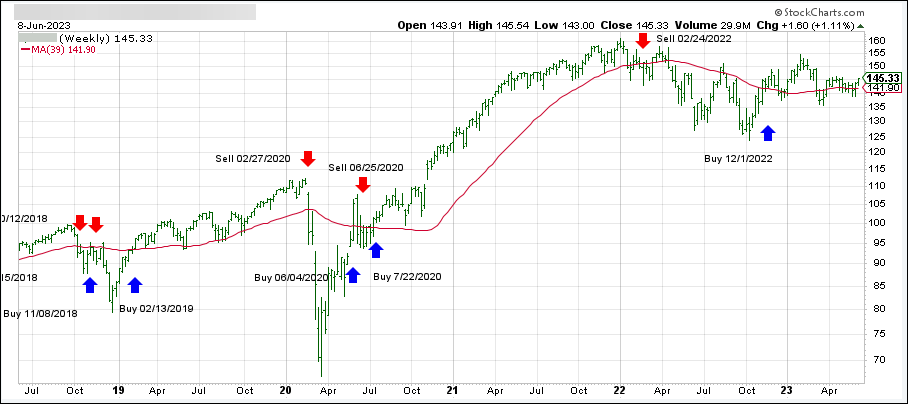
DOMESTIC EQUITY ETFs: BUY— since 12/01/2022
Click on chart to enlarge
This is our main compass, the Domestic Trend Tracking Index (TTI-green line in the above chart). It just broke back above its long-term trend line (red) by +2.45% and remains in “Buy” mode.
The link below shows all High Volume (HV) Domestic Equity ETFs. They are ranked by M-Index, which is my secret sauce for measuring momentum. Prices in all linked tables below are updated through 06/08/2023, unless otherwise noted. Price data not yet available at publication is indicated with 00.00% or -100.00%. Please note that distributions are not included in the current momentum numbers.
If the TTI is above the trend line, you can use the tables in the link below to pick your winners:
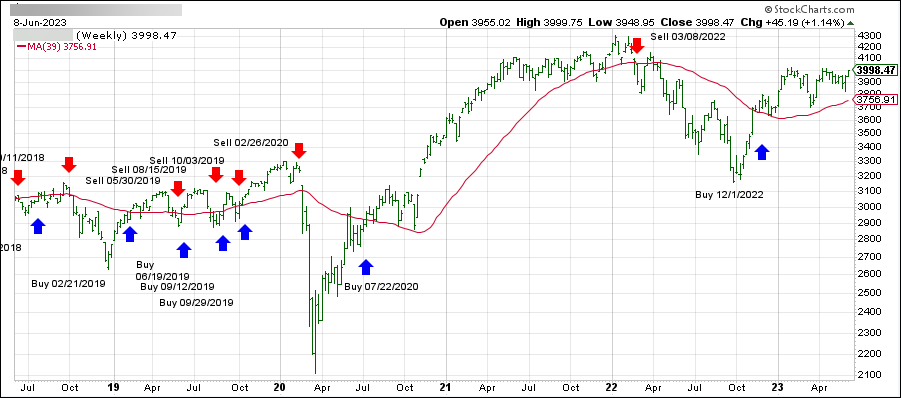
This is our global guide, the International Trend Tracking Index (green). It has moved +6.75% above its long-term trend line (red) and is now in “Buy” mode as posted.
The list in the link below shows the High Volume (HV) International ETFs I track for you during a Buy cycle. They are also ranked by M-Index:
This is the mother of all lists, showing all ETFs I track and how they stack up against each other. The sorting order is by M-Index too. Momentum figures for all ETFs are not adjusted for dividends.
This is where you can find HV ETFs for specific countries or regions that I watch every week. Please note that the data in this table does not include adjustments due to distributions. Country funds can be wild beasts, so make sure you use a trailing stop loss (I use 10%) to protect yourself from nasty bites.
This is where you can diversify your portfolio by looking for different opportunities in various sectors of the market. The table of HV Sector ETFs in the following link covers a wide range of possibilities. The sorting order is by M-Index:
Here too, I recommend using a 10% trailing stop loss to limit your risk.
BOND & DIVIDEND ETFs: SELECTIVE BUY
If you like getting paid for holding ETFs, here’s a list of bond and dividend paying ETFs. But before you buy them, make sure you check their momentum figures first. Then you can visit your favorite financial web site to see their yield and other details.
Please note that the data in this table does not include adjustments due to distributions.
Please note that some of these funds try to beat the index they are tied to by a certain percentage. This can boost your returns, but it can also magnify your losses. So be careful and use a trailing sell stop (I suggest 10%) and be ready for some bumps along the way.
NEW SUBSCRIBER INFORMATION
To get a head start on more successful investing, please click on:
In case you missed it, you can download my latest e-book “How to beat the S&P 500…with the S&P 500,” here. If you are investing your 401k and must use mutual funds, I suggest you mainly stick with the S&P 500 as described in my book. Of course, you can always use the above tables to find sector or country ETFs that suit your taste and use the equivalent mutual funds as offered by your custodian.
Disclosure:
I must tell you that I, as well as my advisory clients, own some of the ETFs listed in the above table. Also, they are not meant to be specific investment recommendations for you, they just show which ETFs from my universe are doing well right now.
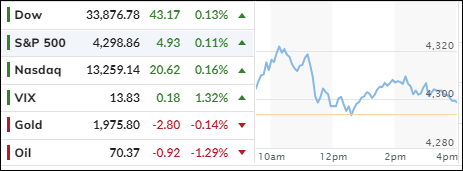
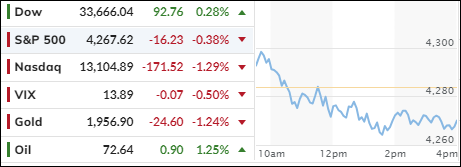
The S&P 500 is still hovering near its highest level since August, but it slipped a bit today. Maybe the market realized that its artificial intelligence stocks can’t keep the party going forever.
After all, we have seen 13 months of declining leading indicators, and the Fed’s hawkish policy will likely bite us in the future. Liquidity issues will become a big problem, especially when the government needs to borrow an estimated $1 trillion to fill its empty coffers. Who will buy all that new debt? The Fed may have to step in and print more money.
Some assets went up, some went down, leaving many investors confused and frustrated. Billionaire hedge fund manager Stan Druckenmiller summed it up well:
This is the most complicated non-roadmap, unanalyzable situation I’ve ever seen in terms of having a lot of confidence in an economic prediction going forward… I just don’t see a fat pitch right now.
And then he added:
Our central case is there’s more shoes to drop, particularly in addition to the asset markets economically.
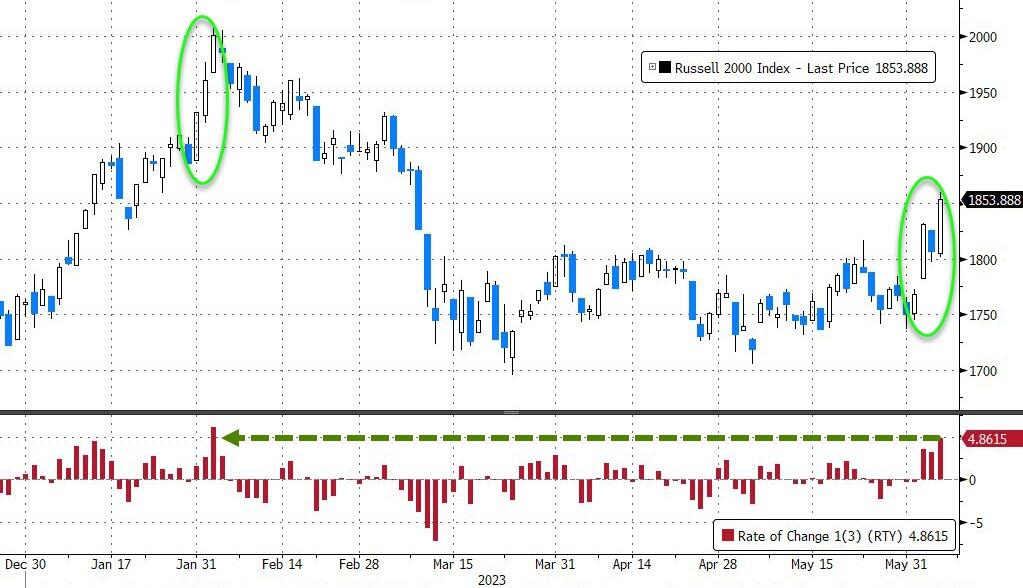
Ouch. That sounds bad. And it shows. The Nasdaq had its worst day since mid-April, while the Russell 2000 (small caps) outperformed it by the most since March 2021.
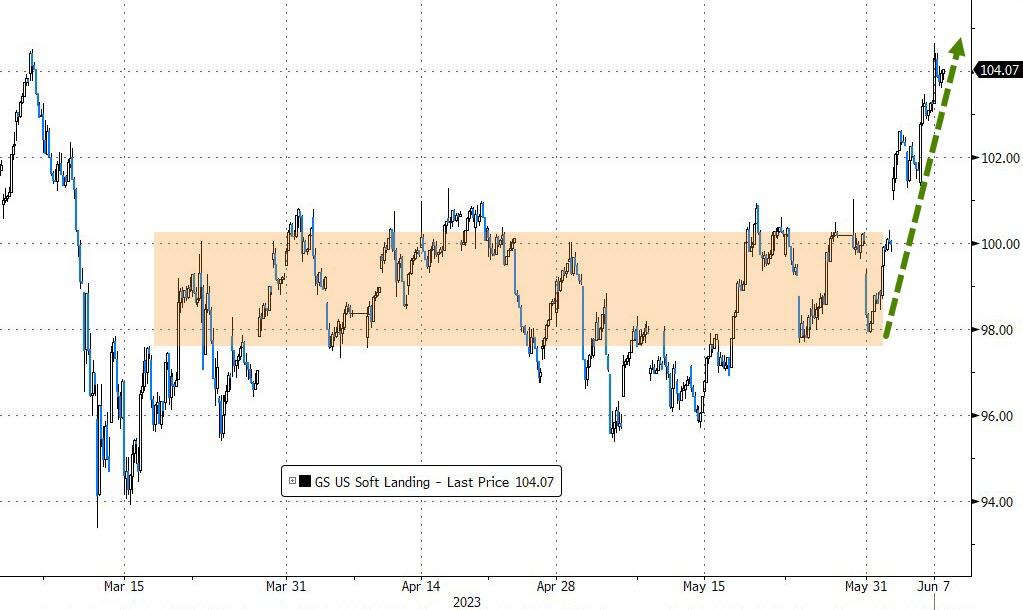
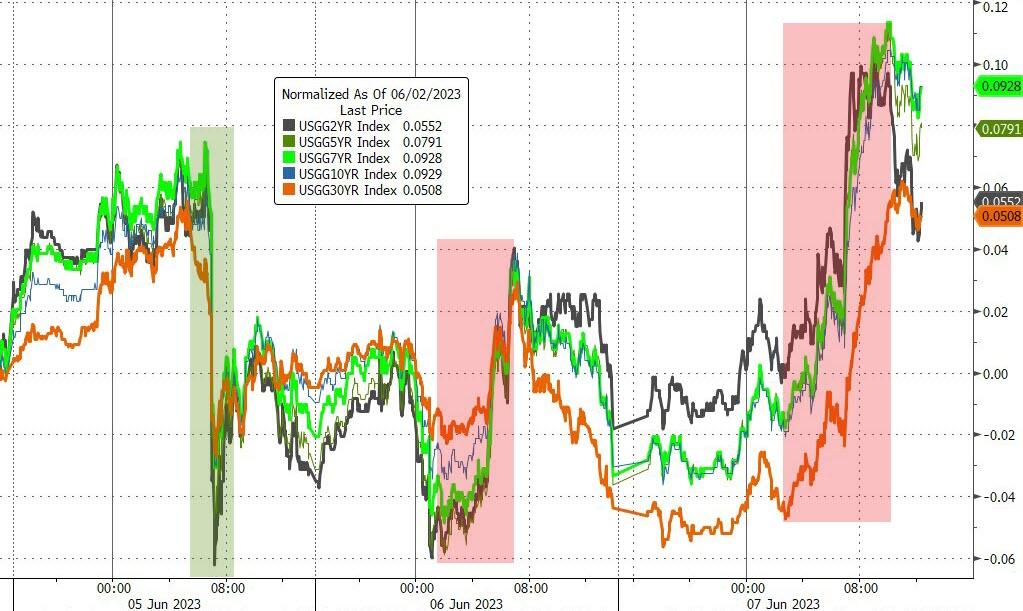
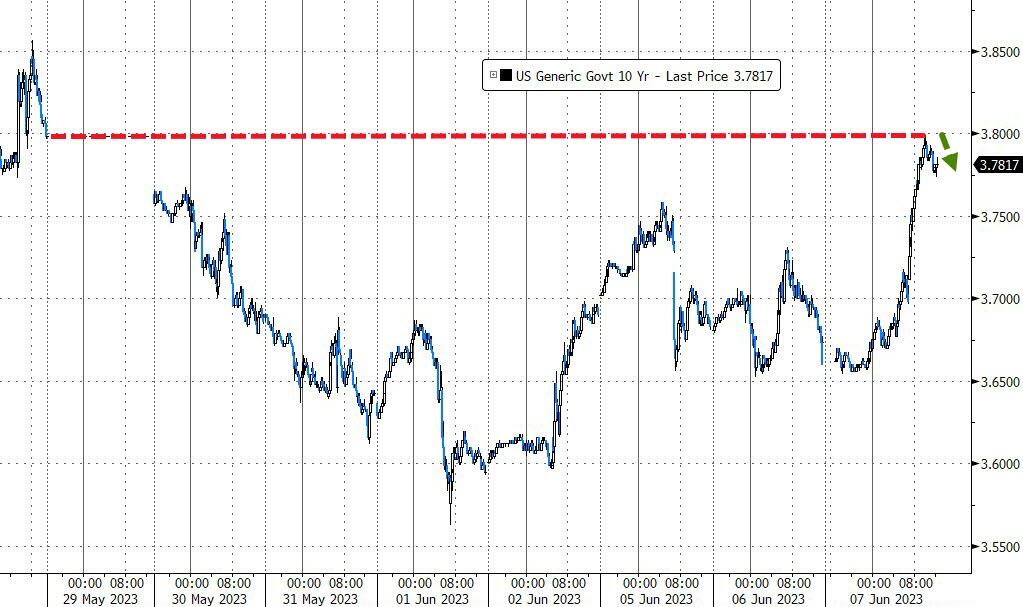
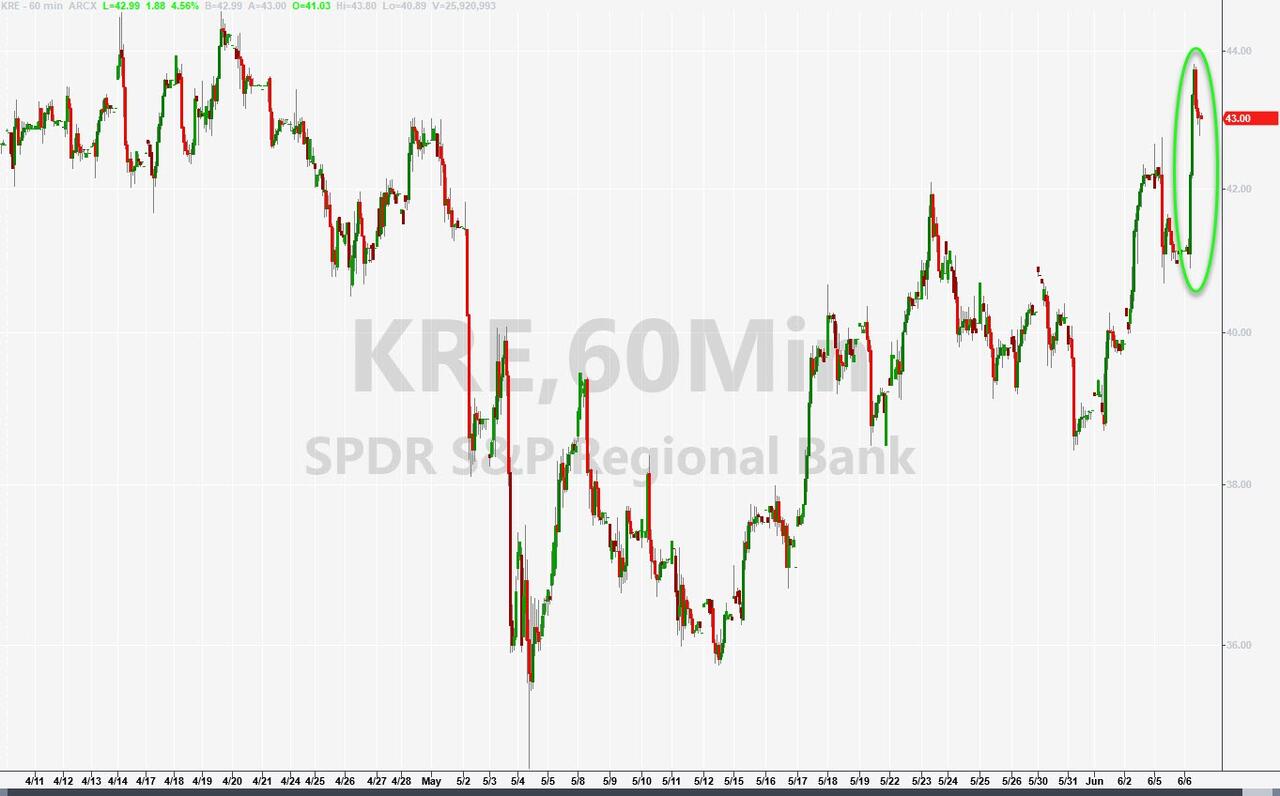
Regional banks kept rising, while Goldman Sachs tried to convince us that everything would be fine, and we would have a “soft landing”. Bond yields soared higher with the 10-year jumping 12 basis points but stopping at the 3.8% resistance level.
The US Dollar had a wild ride but ended flat. Gold was not so lucky and gave back Monday’s gains as bond yields hurt its appeal. So, what should we do in this bubble? Druckenmiller has some advice:
There are definitely lessons to be learned [from the Dot Com bubble]. Don’t get emotional, don’t get crazy.
Sounds reasonable. But will we listen? Or will we repeat history?
The S&P 500 is close to its highest level in nine months, but don’t get too excited. This rally is driven by a few big stocks, while most of the market is lagging. That’s a sign of weakness, not strength, according to analyst Lance Roberts. He explains:
Breadth is important. A rally on narrow breadth indicates limited participation, and the chances of failure are above average. The market cannot continue to rally with just a few large-caps (generals) leading the way. Small and mid-caps (troops) must also be on board to give the rally credibility. A rally that “lifts all boats” indicates far-reaching strength and increases the chances of further gains.
So far, investors have ignored the bad news about the economy and kept buying stocks. But that could change soon, especially if the Fed decides to raise interest rates again on June 14th. Until then, we might see some sideways action and low volatility in the market.
Yesterday, the major indexes barely closed in the green, despite some negative headlines for Coinbase and Apple. The only exception was the small-cap index, which soared for the third day in a row, gaining 5% in total. That sounds impressive, but it might be a false signal. The last time this happened was in early February, right before a big drop. Regional banks also did well, thanks to a 6-day short squeeze.
Bond yields rose early in the session but fell back later. The US dollar had a wild ride but ended up flat. Gold added to its gains from yesterday.
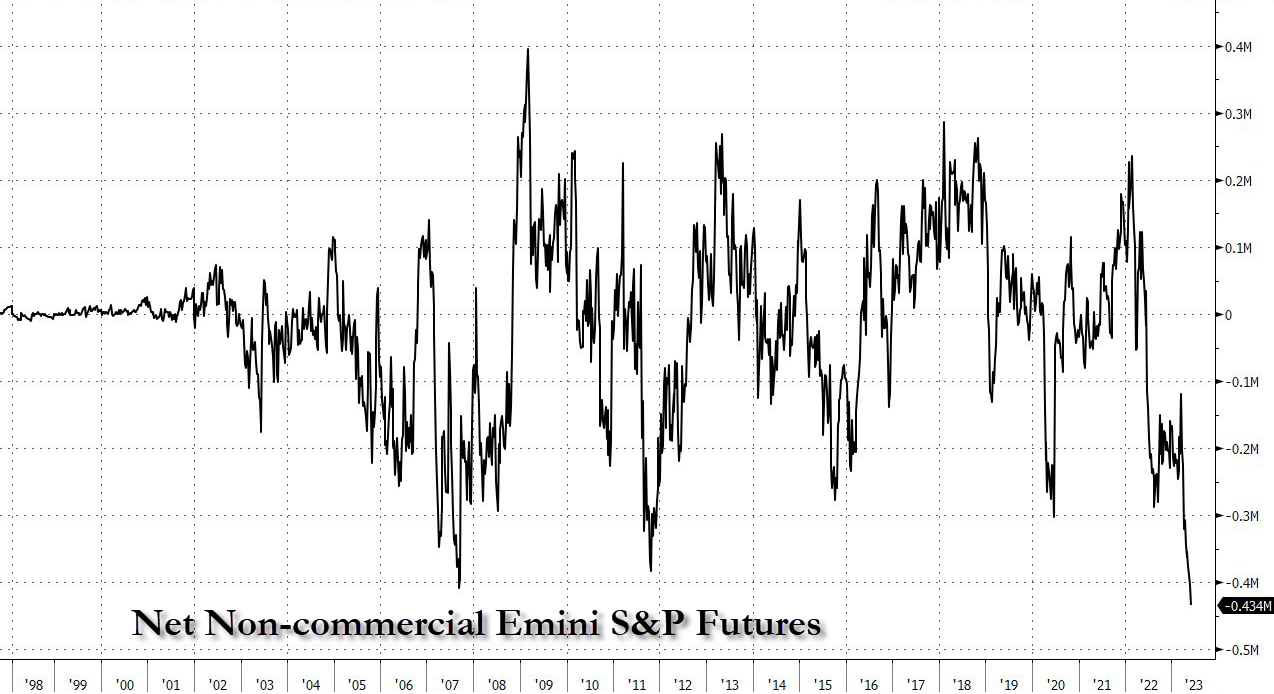
The world is betting against the S&P 500 right now, which makes me wonder if this rally has any legs left. To me, it looks like the market is out of sync and the S&P is on thin ice. It’s sensible to have a sell stop discipline in place.

