
- Moving the markets
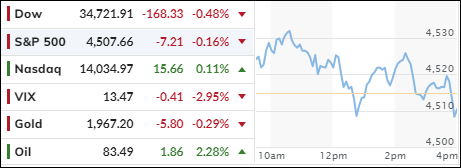
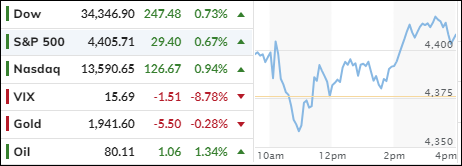
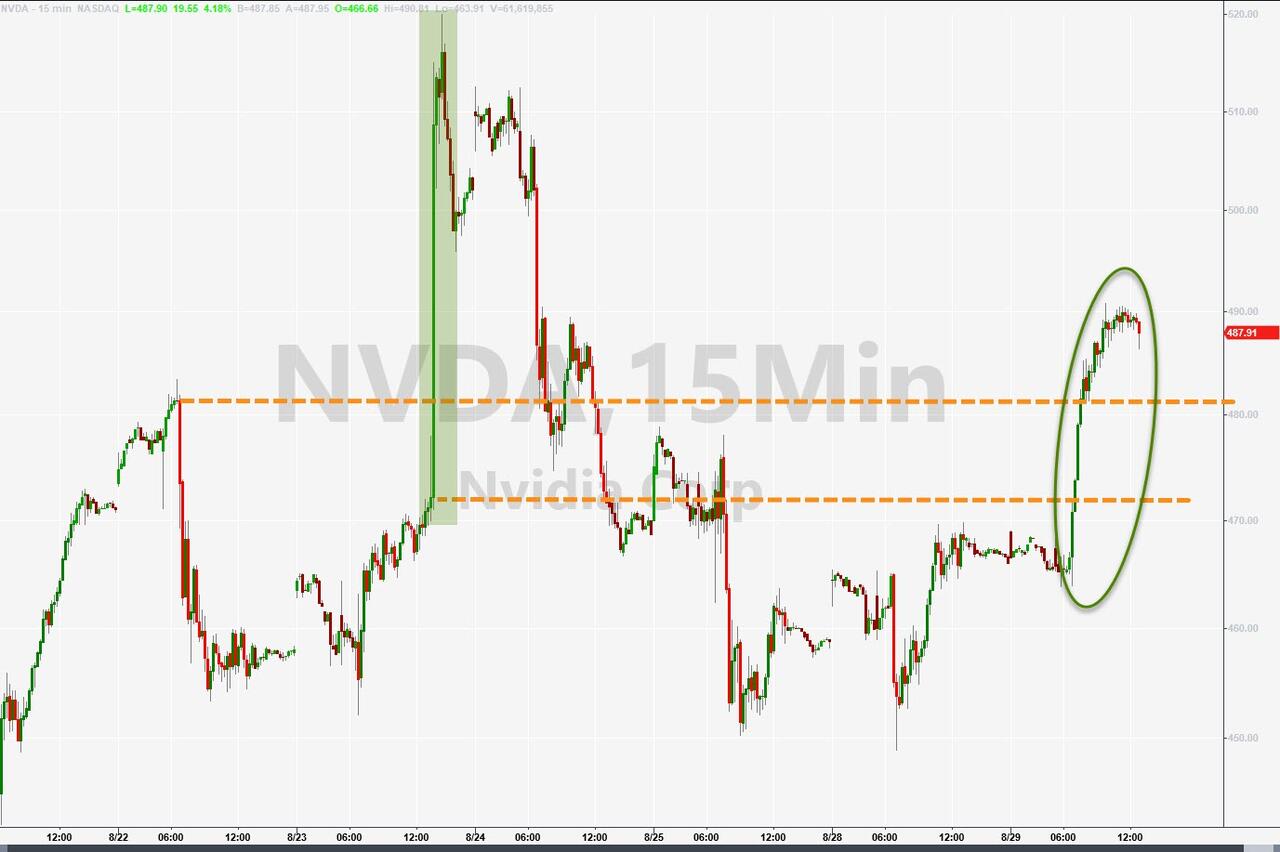
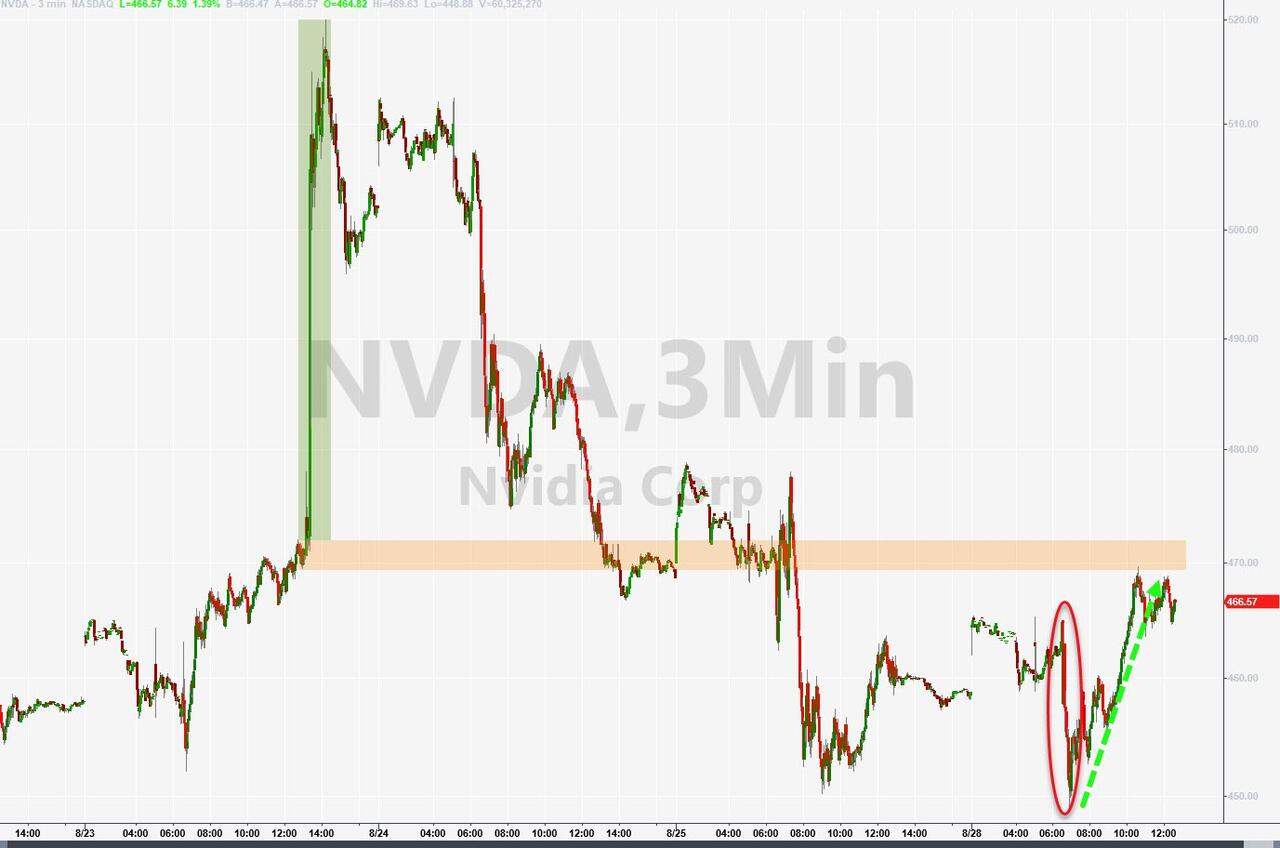
The stock market had a roller-coaster ride on Thursday, as an early rally fizzled out and left only the Nasdaq in the green. The other two major indexes closed slightly lower, snapping a 4-day winning streak. The month of August was a bumpy one for stocks, as the S&P 500 trimmed its losses from nearly 5% to less than 2%. Small caps suffered the most, as they usually do in turbulent times.
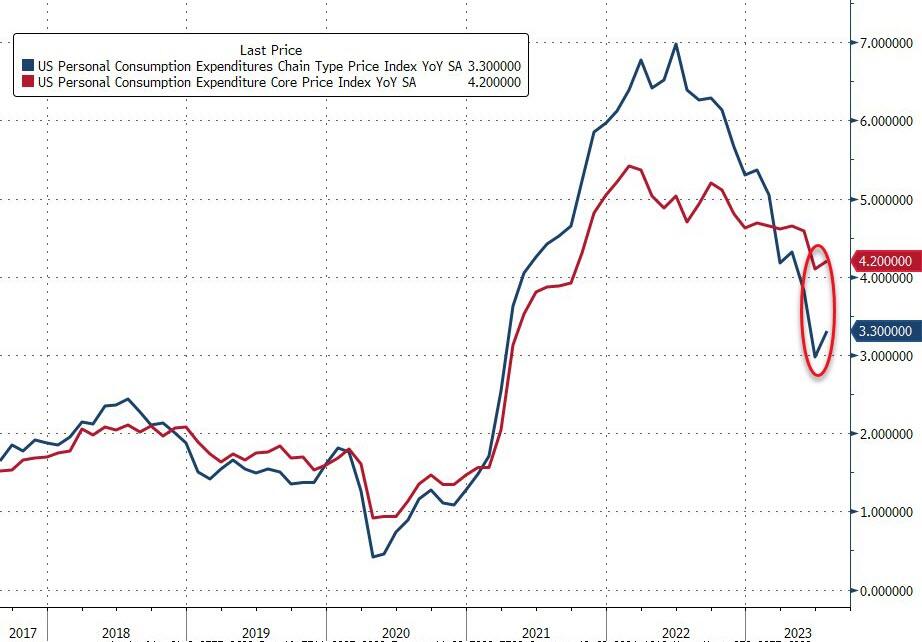
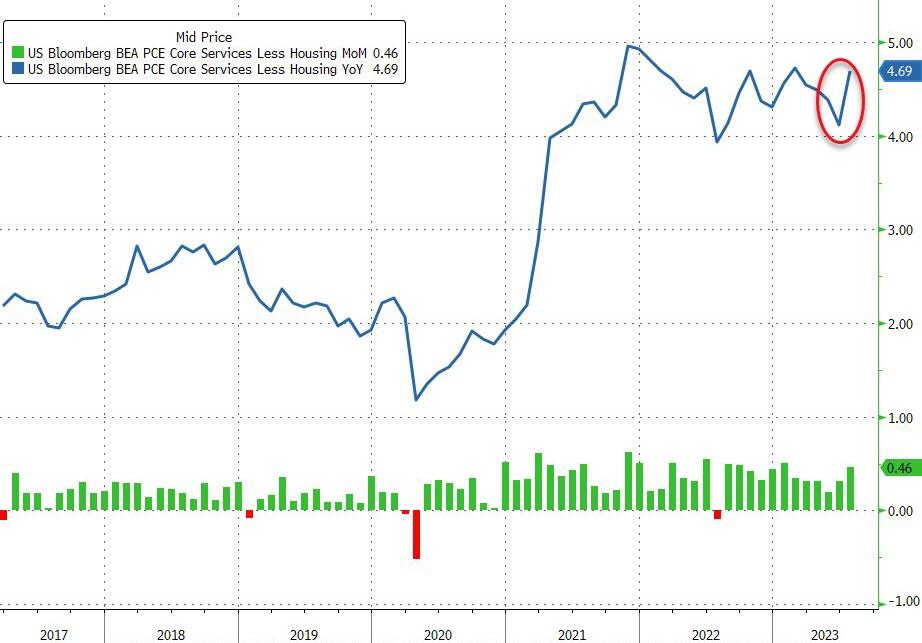
Inflation remained a hot topic, as the Fed’s preferred measure, the Core PCE Deflator, rose to 4.2% year-over-year in July, matching expectations but higher than June’s 4.1%. The headline PCE also jumped to 3.3%, the highest since June 2022. But if you take out the housing component, which accounts for a large chunk of consumer spending, inflation is still stuck at elevated levels, as this chart shows.
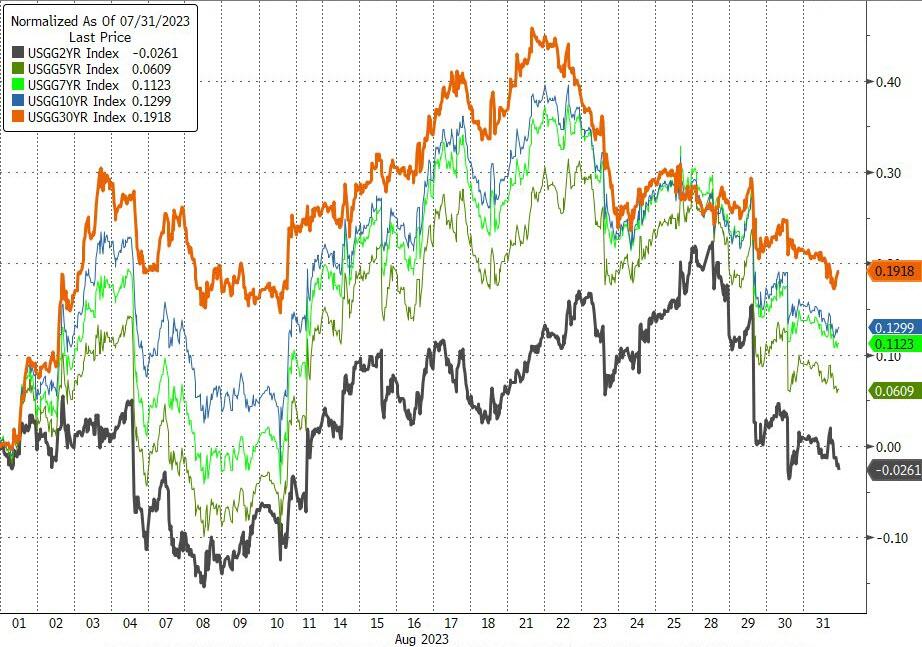
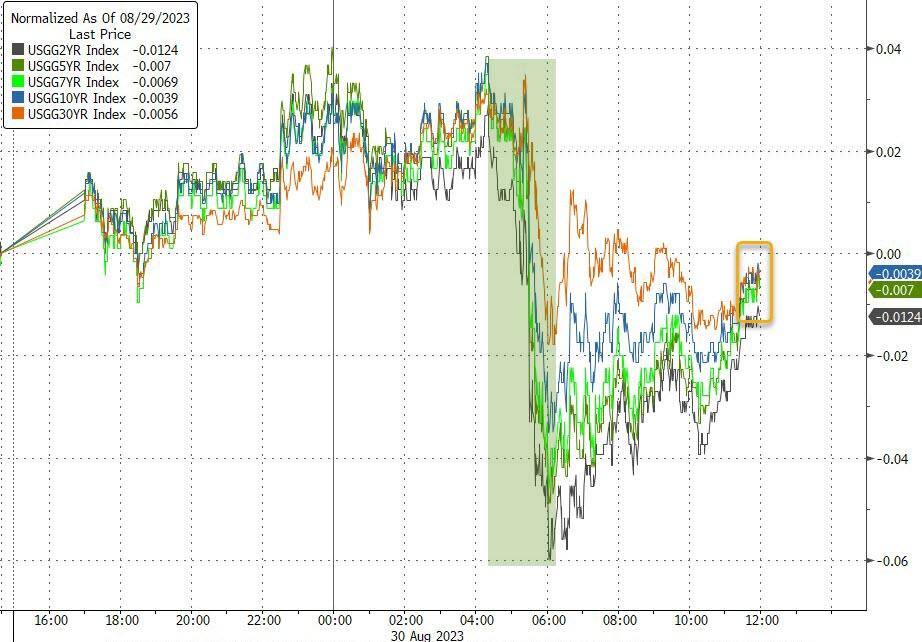
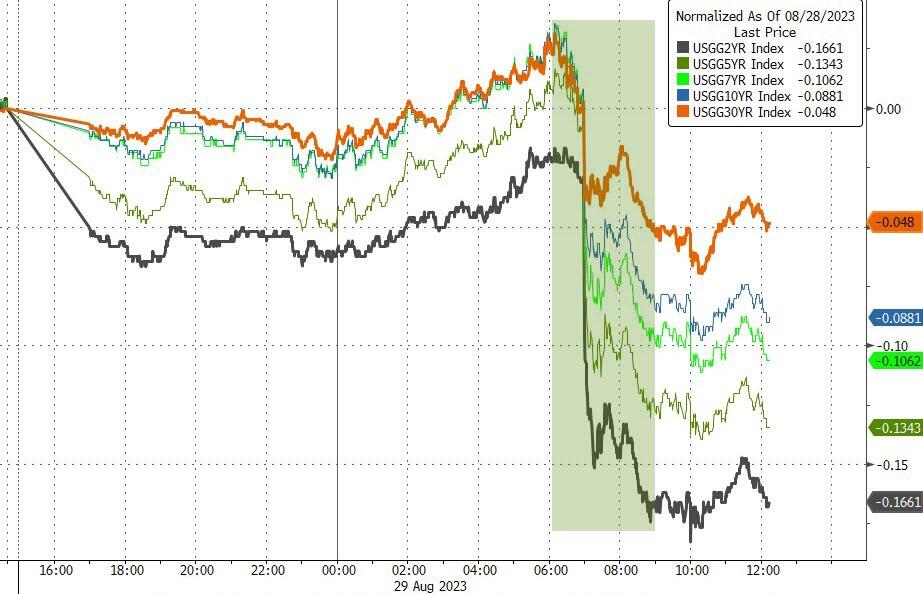
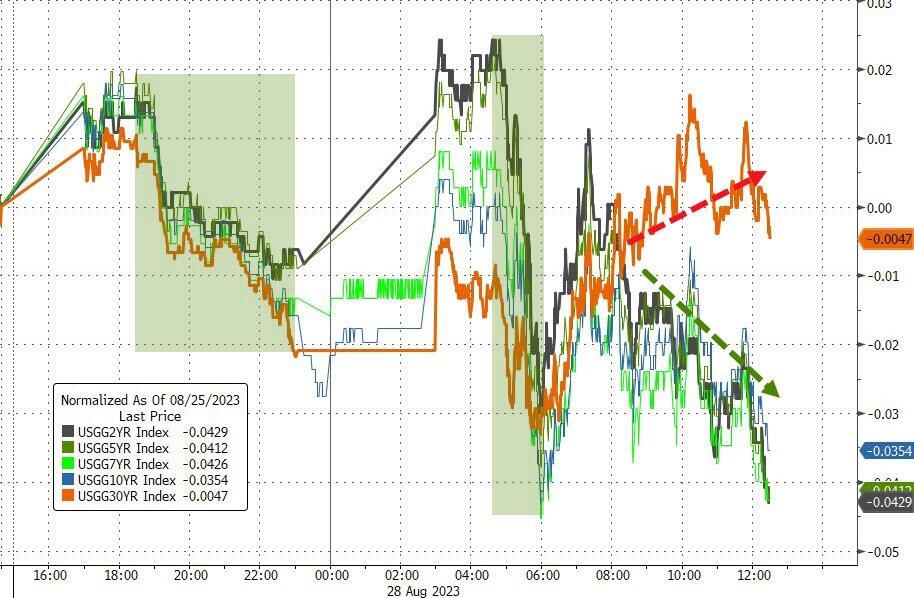
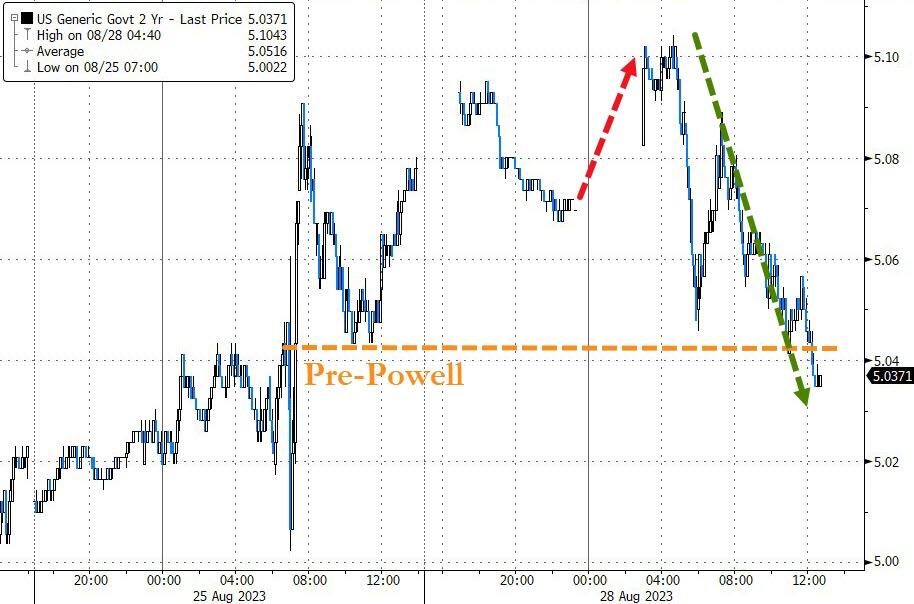
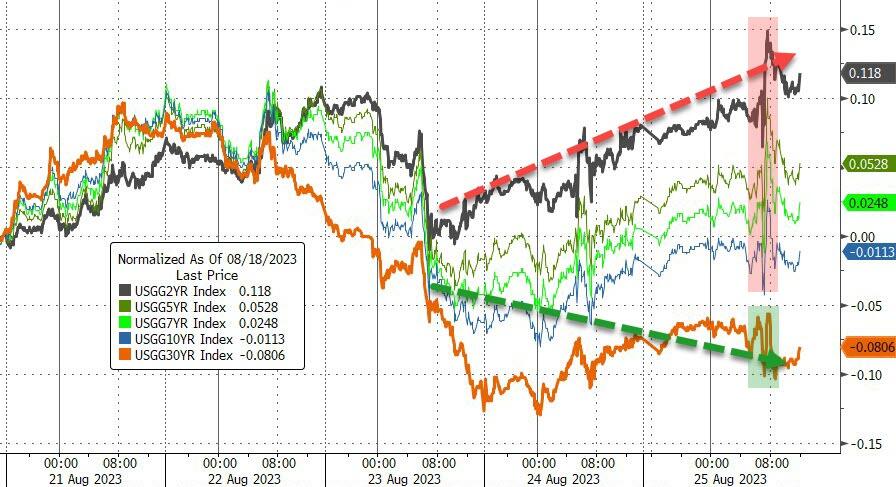
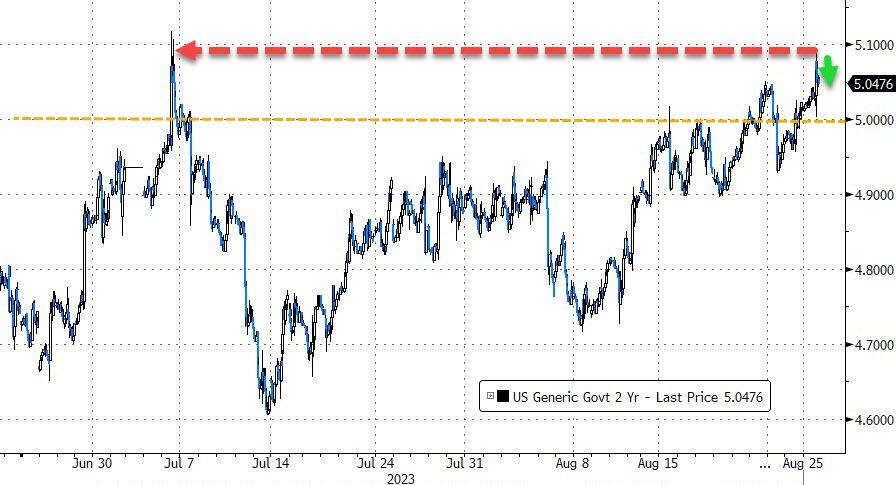
Bond yields were initially falling, which boosted stocks, but then reversed course and started to climb, which dragged stocks down. It seems that stocks are following bonds closely these days, so lower yields could mean higher stock prices in the near term.
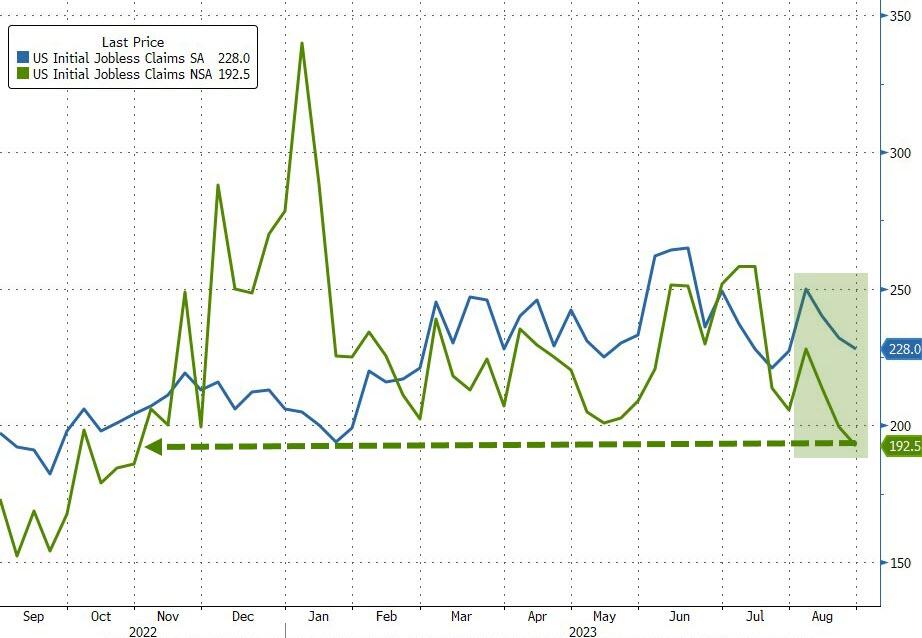
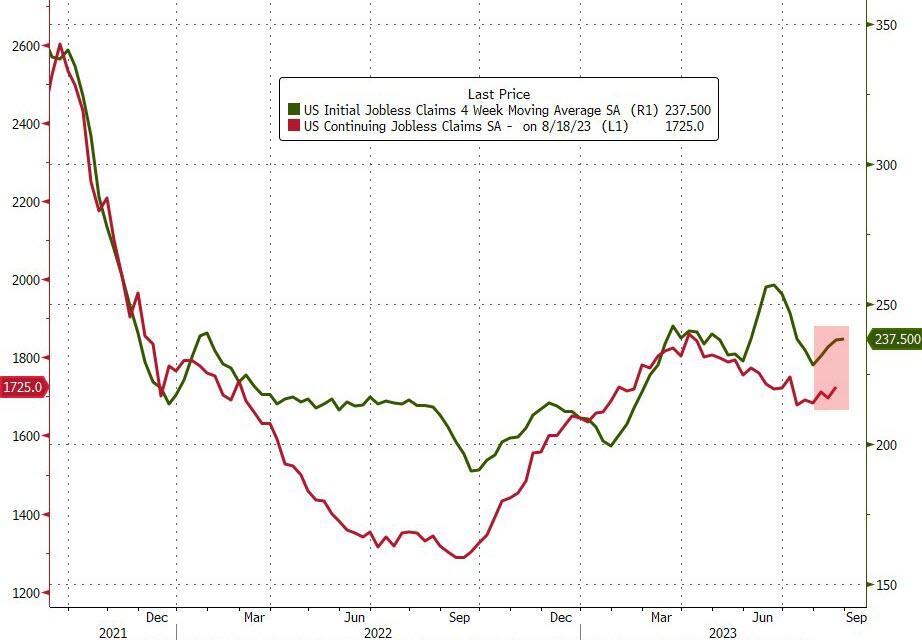
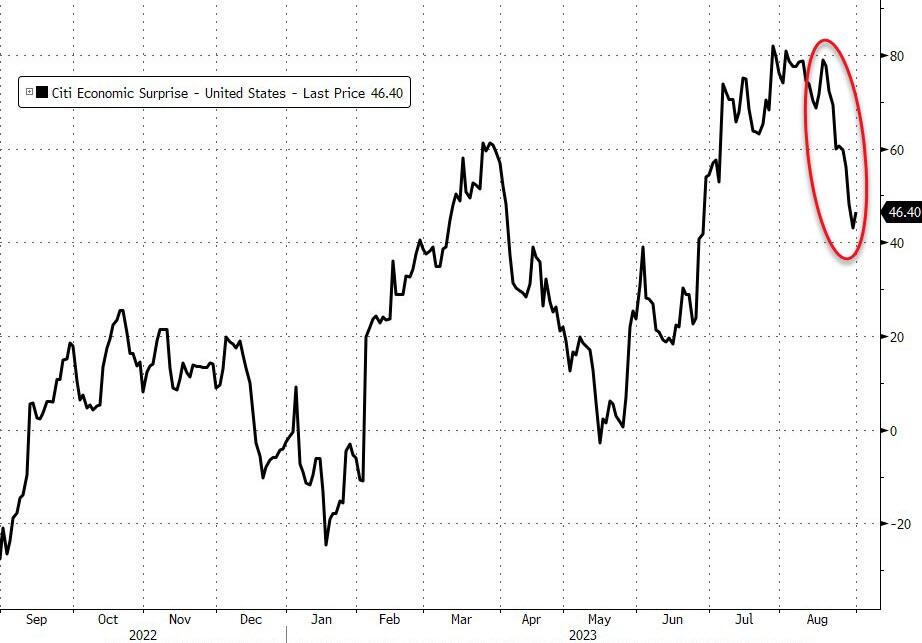
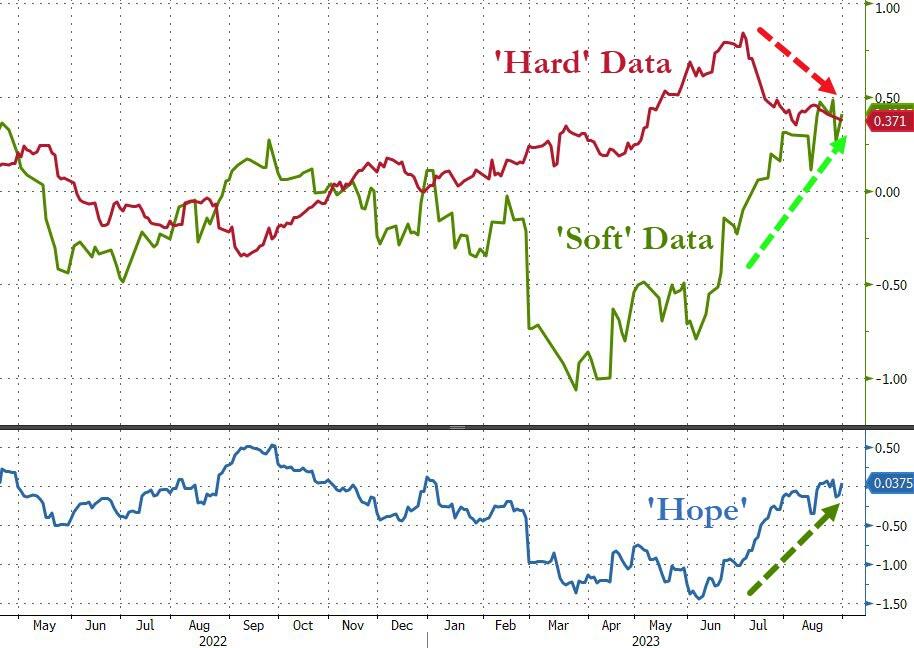
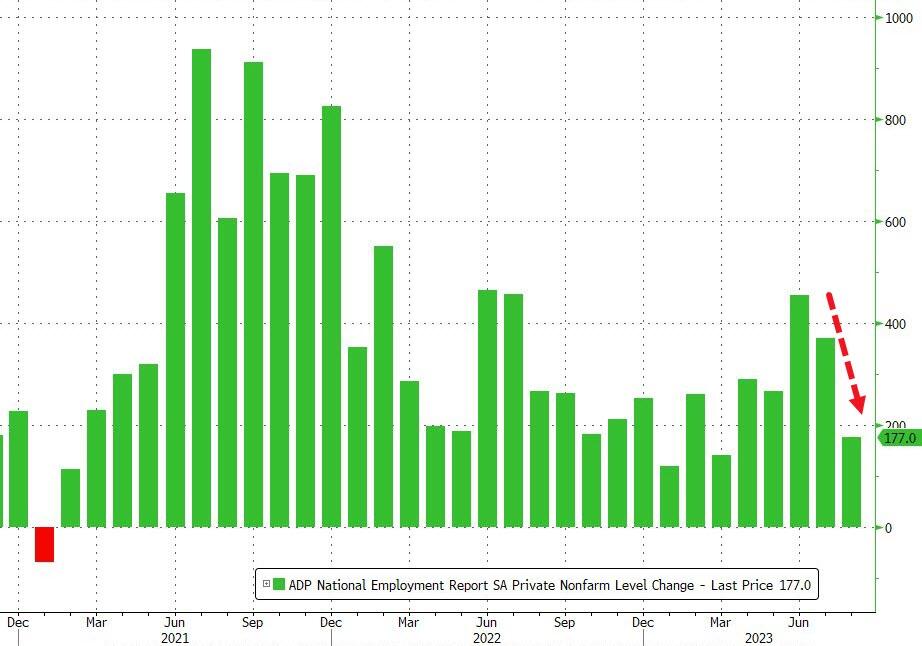
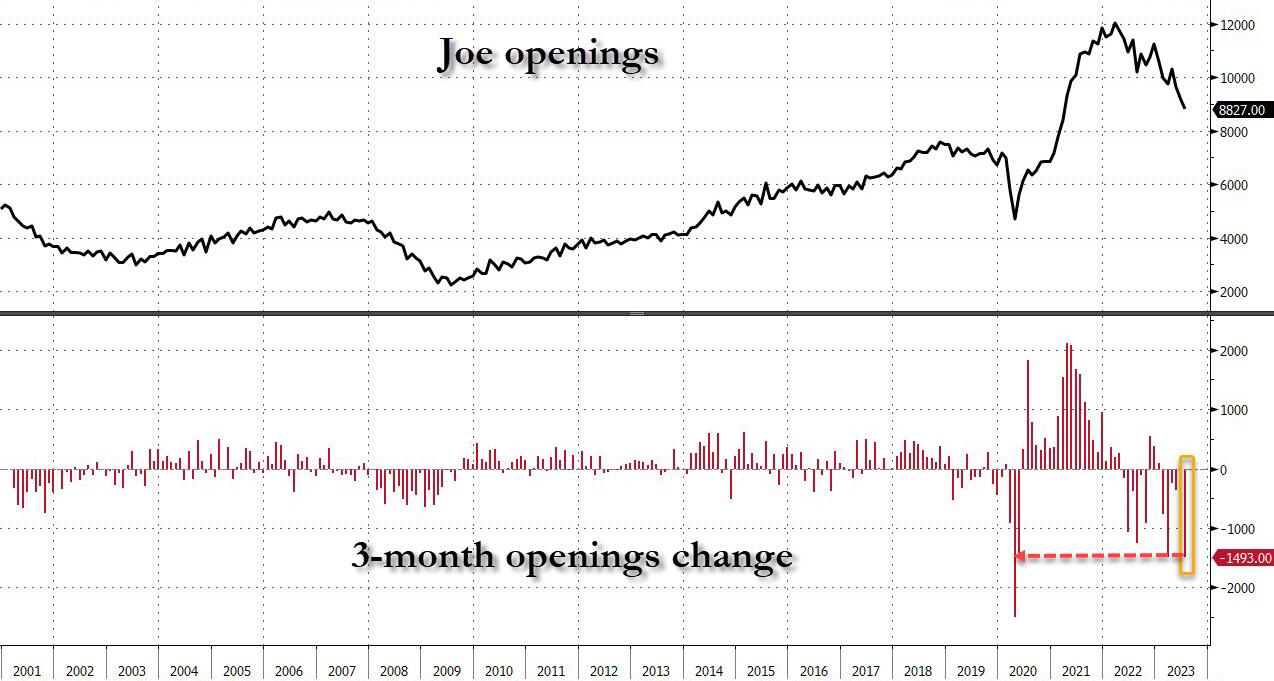
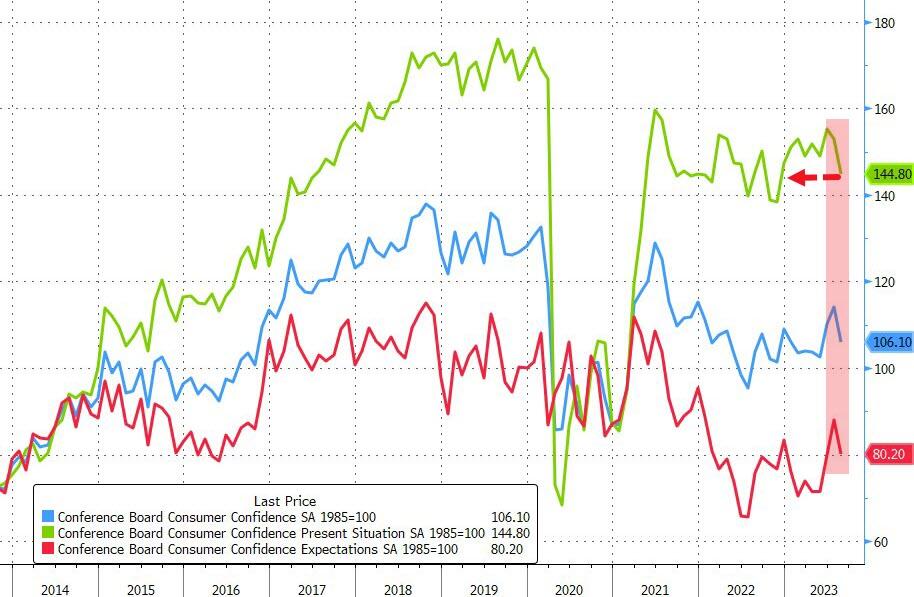
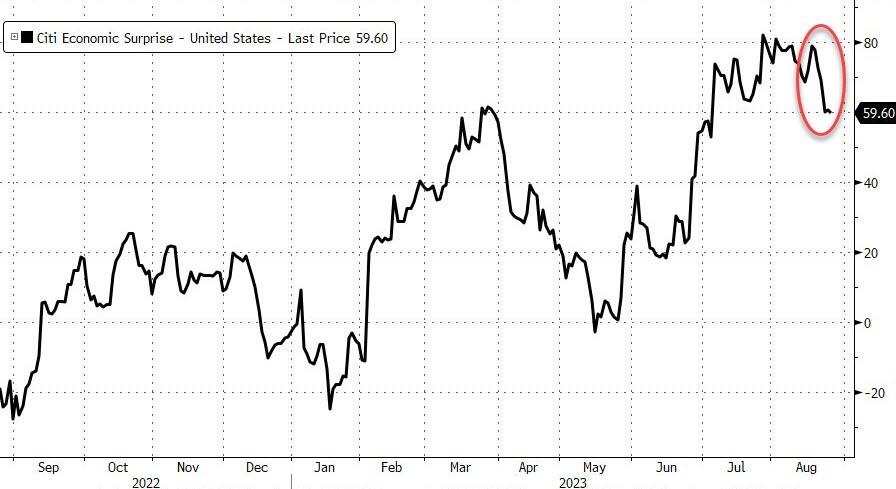
The labor market showed mixed signals, as initial jobless claims dropped to 2023 lows despite a surge in layoffs, but continuing claims rose above 1.7 million last week. The economic recovery seems to have hit a speed bump in August, as various indicators showed the biggest monthly decline since May 2022. The data was also inconsistent, with some measures showing strength and others showing weakness.
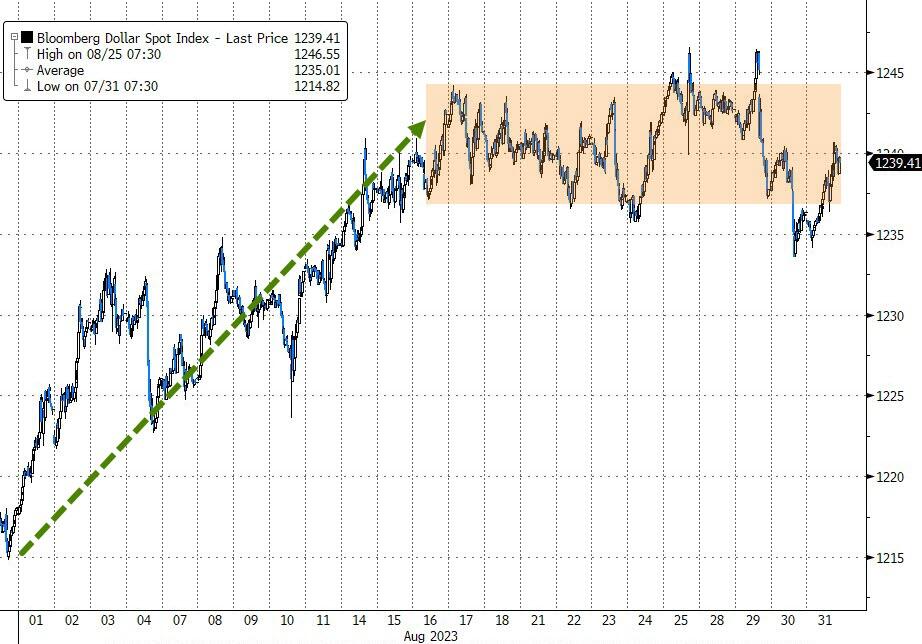
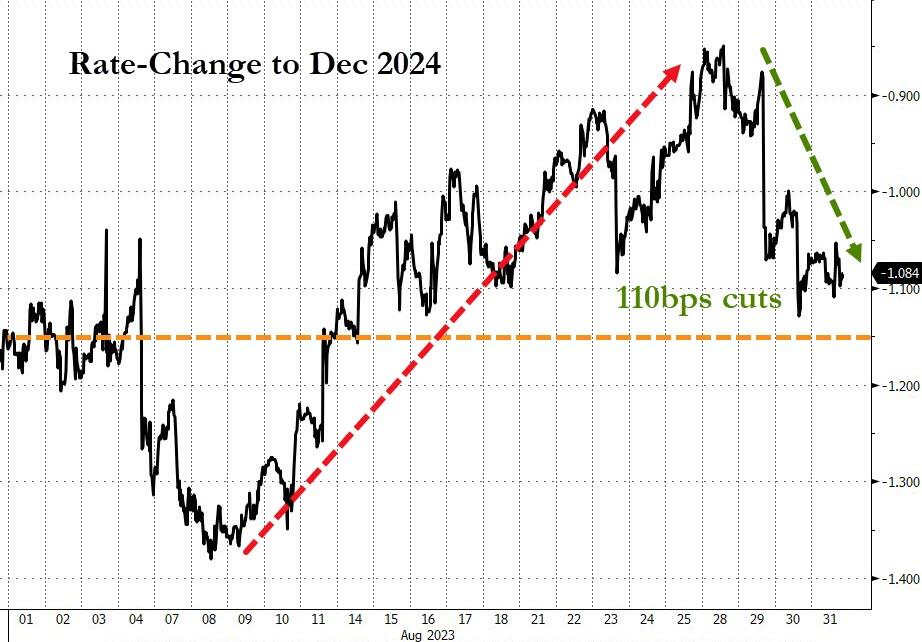
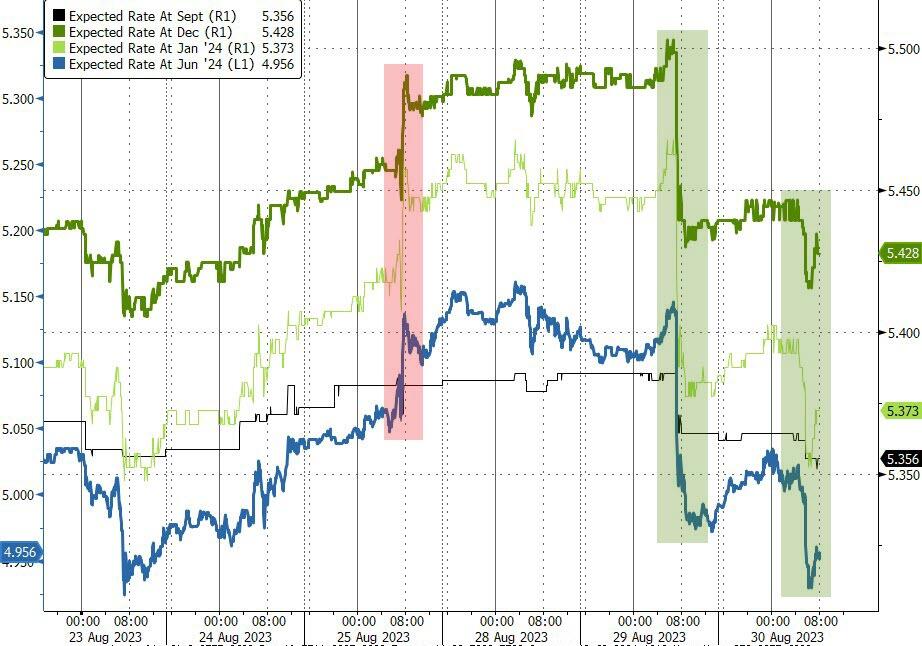
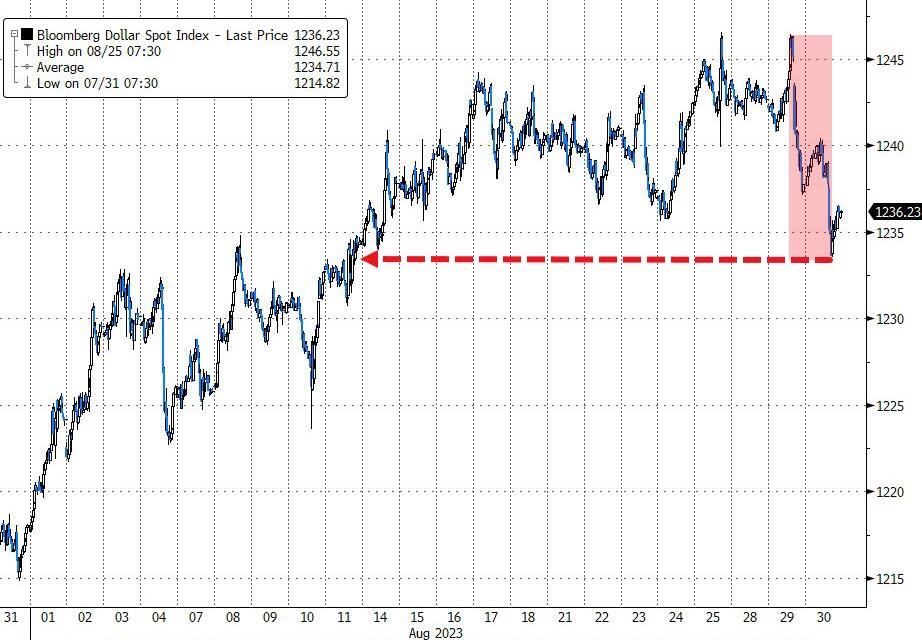
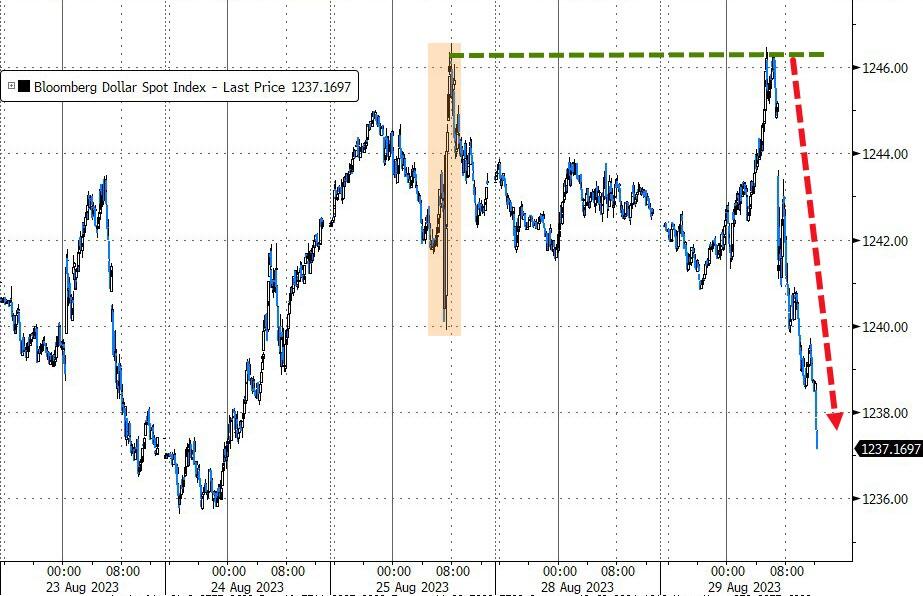
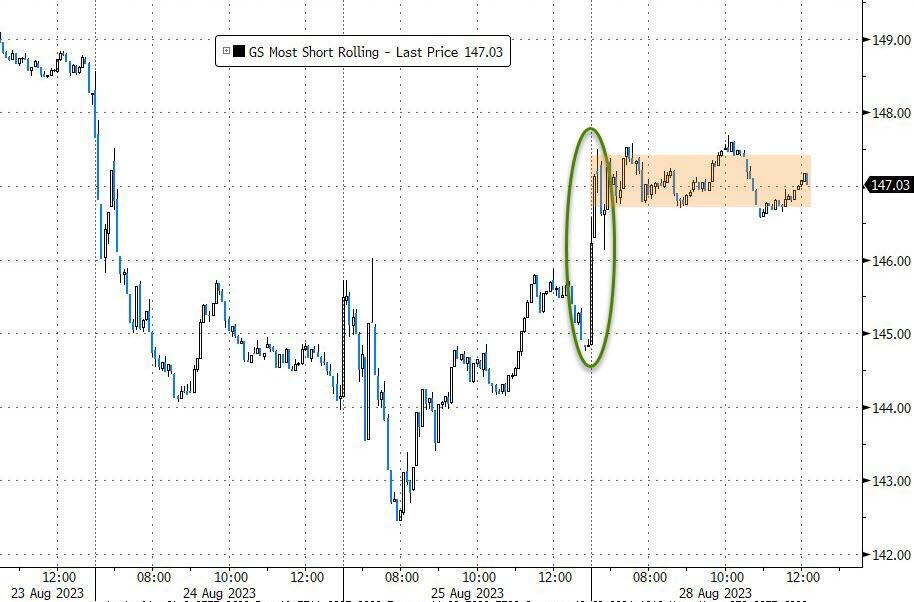
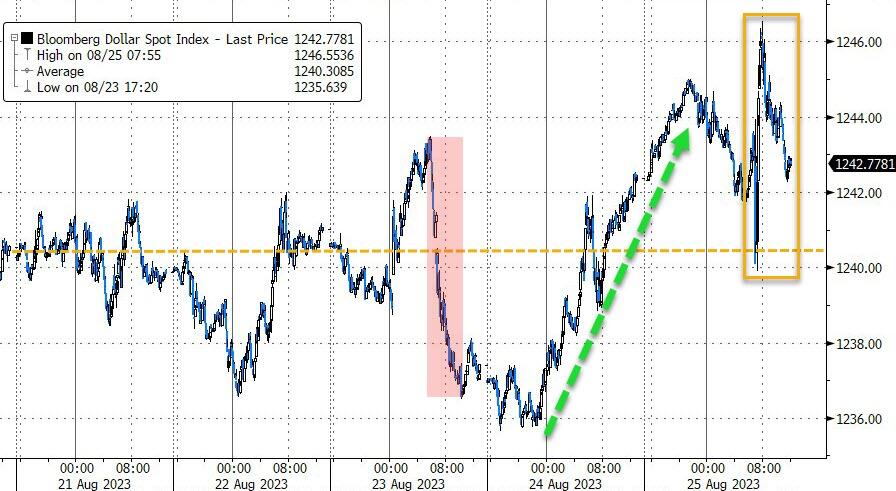
The dollar had a strong month, rising the most since February, but has been trading sideways for the last two weeks. The Fed has been talking tough about tapering and hiking rates, but the market is not buying it. The market is pricing in 1.1% of rate cuts by the end of next year, which could be a big mistake if the Fed follows through on its hawkish rhetoric.
The bottom line is that the market is facing a lot of uncertainty and volatility, and we need to be prepared for more swings ahead.
Read More