
ETF Tracker StatSheet
You can view the latest version here.
THE ECONOMY IS JUST RIGHT, BUT WILL IT LAST?
- Moving the markets
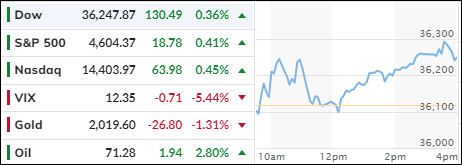
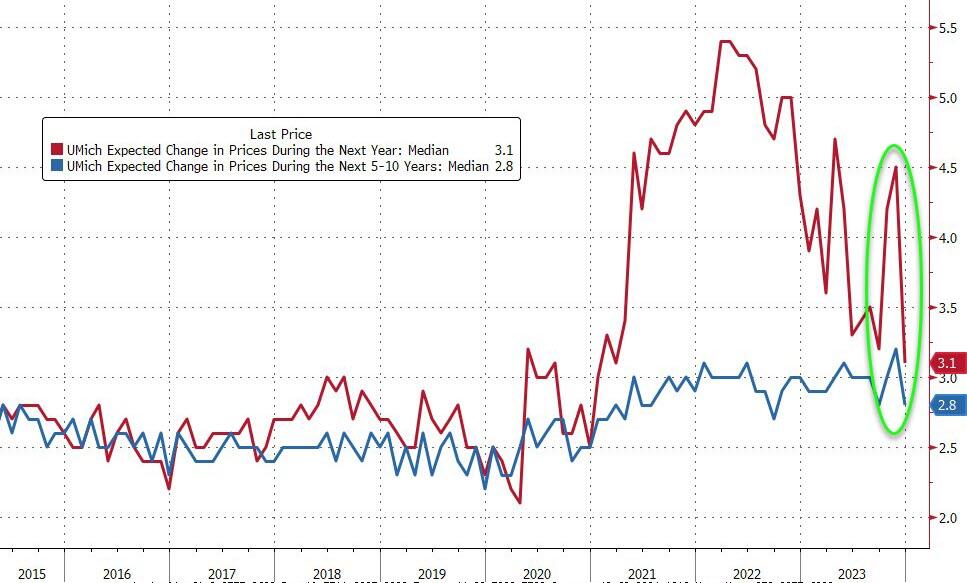
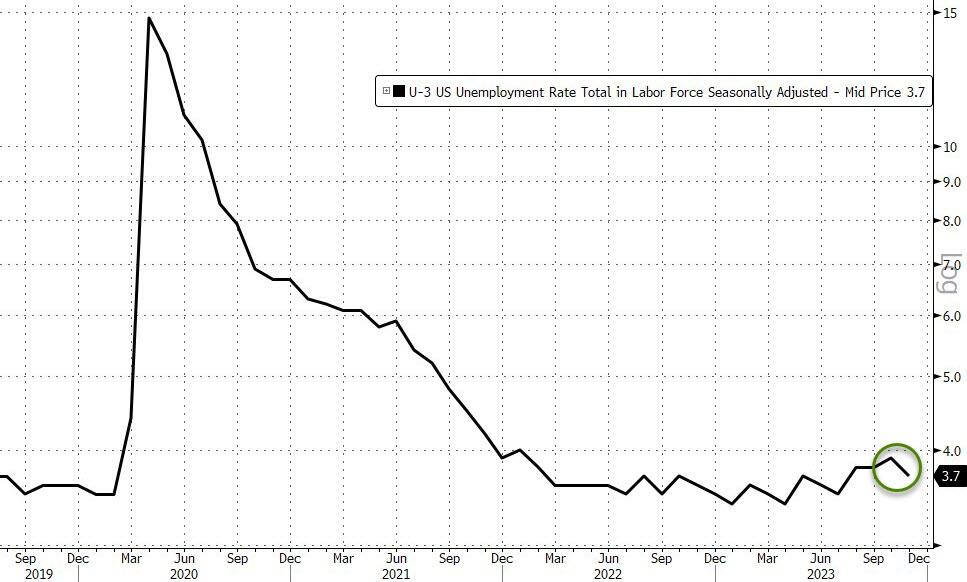
The stock market had a good day after two reports showed that the economy is doing well but not too well. The November jobs report and the University of Michigan consumer survey both indicated that the economy is growing at a steady pace and inflation is easing. This is what the Fed and many investors want: a soft landing, not a crash or a boom.
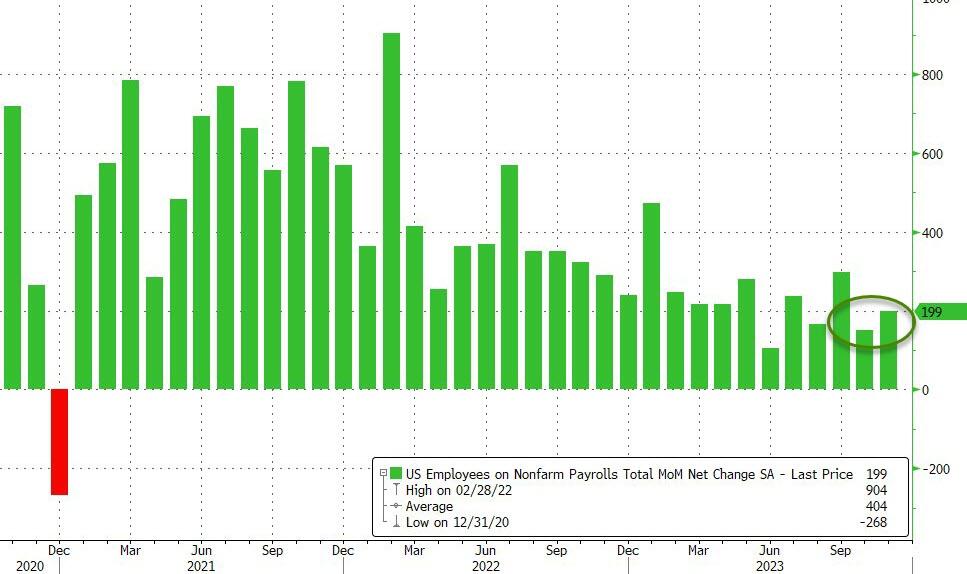
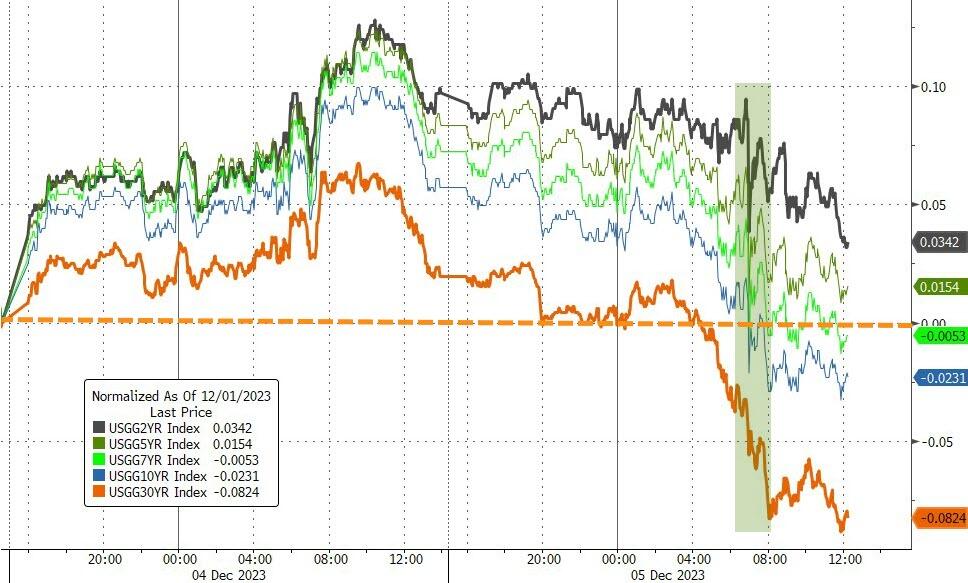
The unemployment rate dropped to 3.7% in November, beating expectations. The economy added 199,000 jobs, more than forecasted and more than in October.
These numbers could have worried some people that the economy is overheating, and the Fed will have to raise interest rates more aggressively. But some optimistic traders think the opposite: that the Fed will start cutting rates as soon as March.
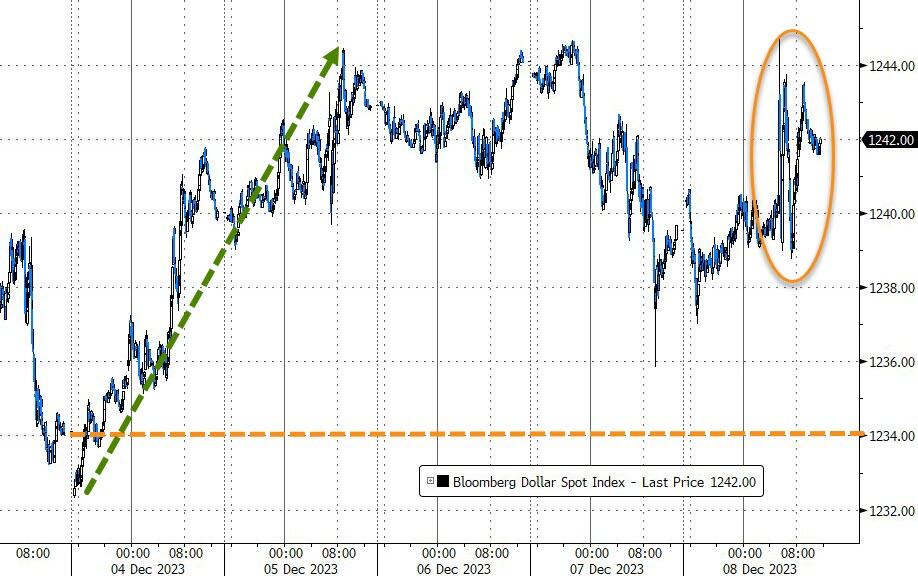
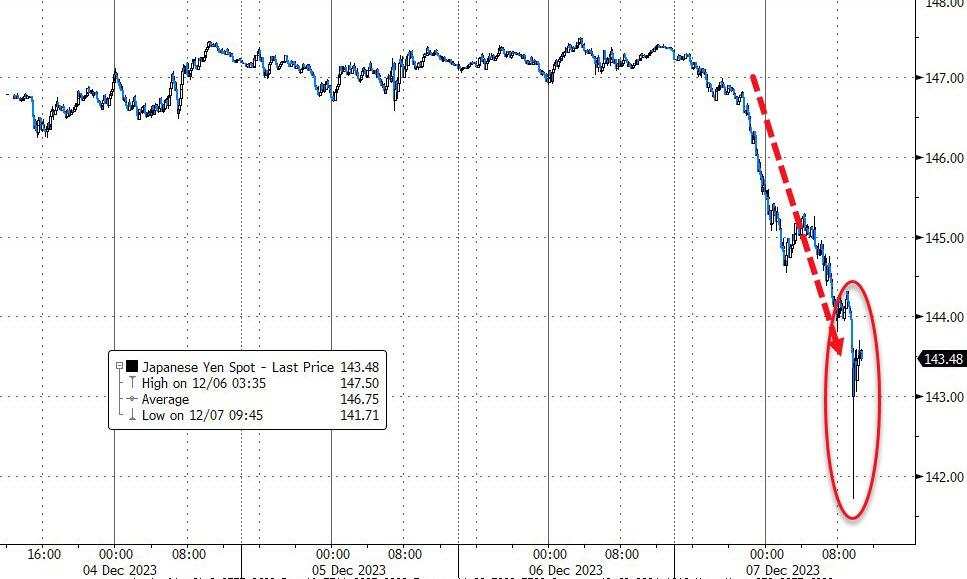
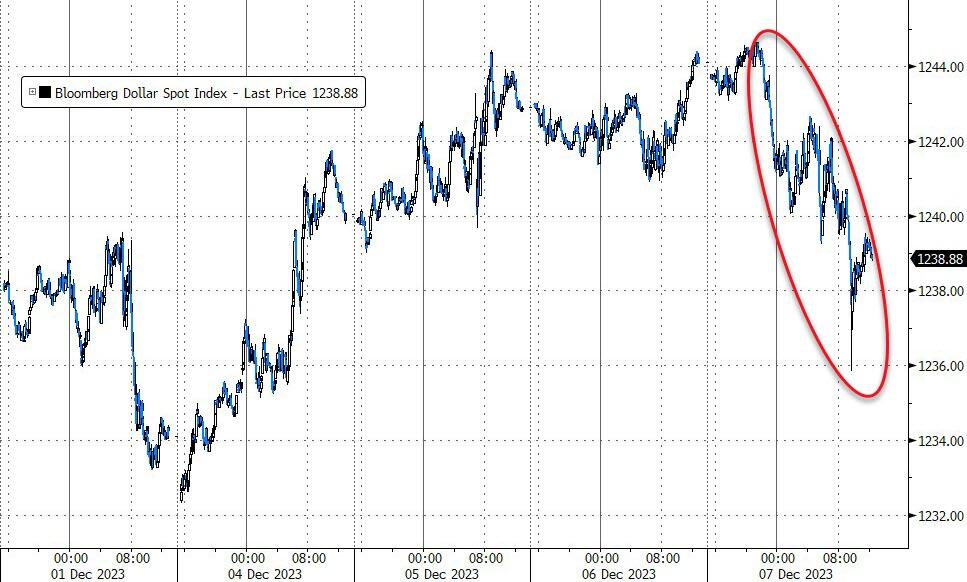
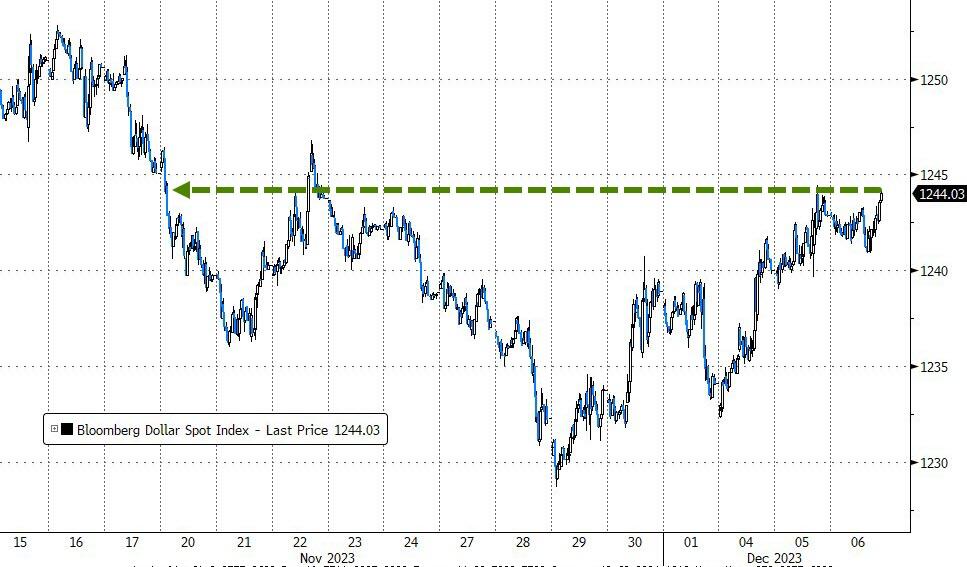
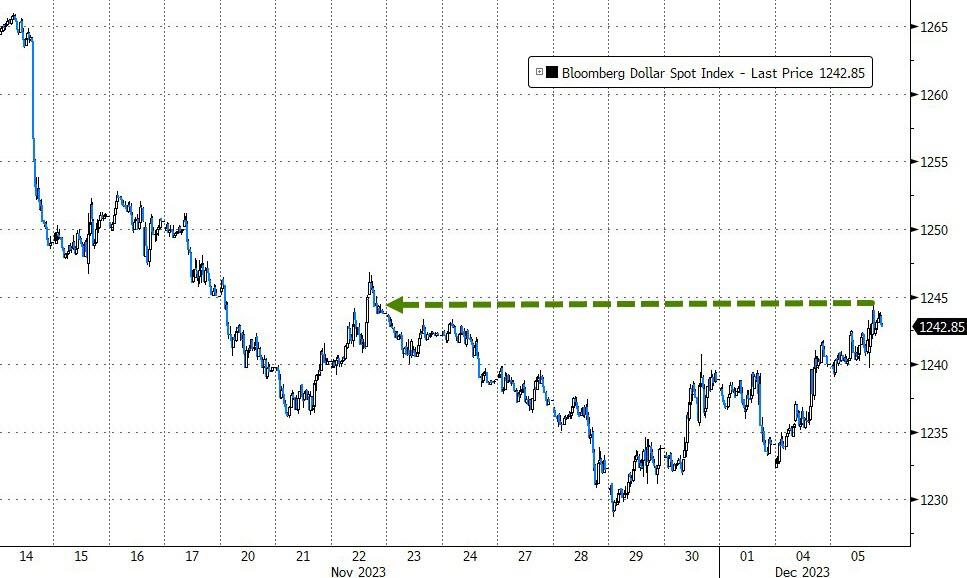
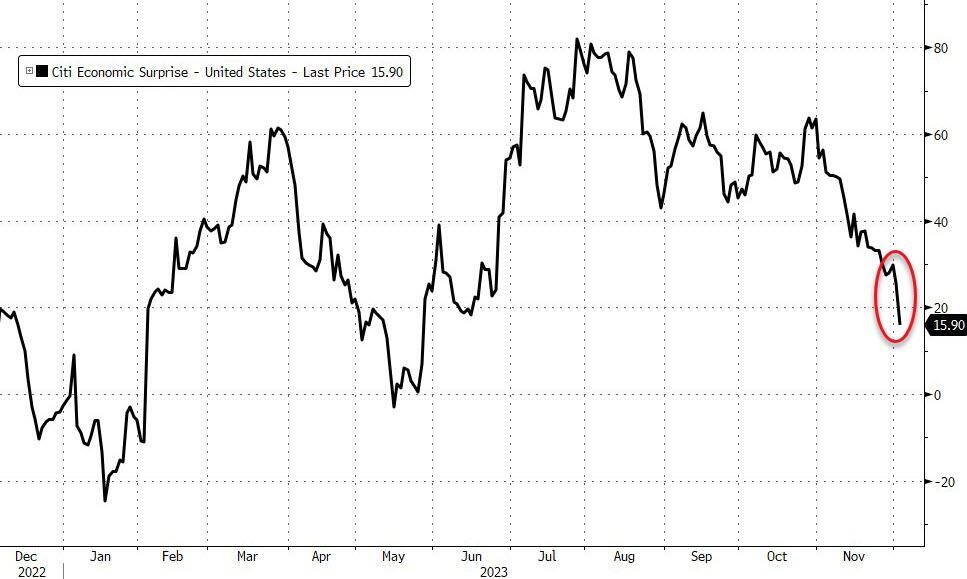
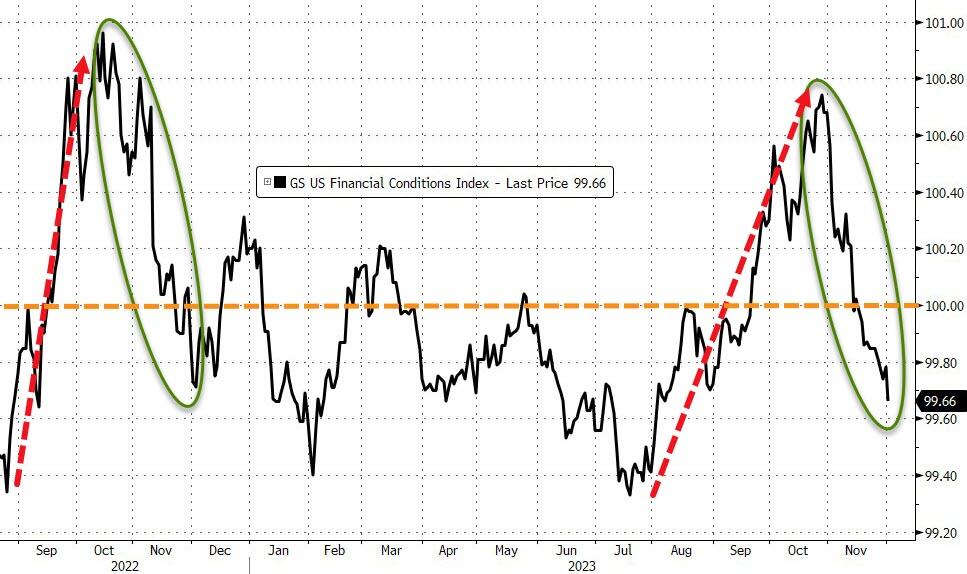
We’ll have to wait and see if they are right or if inflation will come back to haunt us, which I believe it will. The Fed has been raising rates for a while now, and that has pushed up the dollar and pushed down commodities.
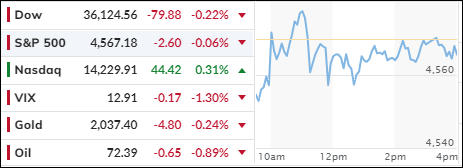
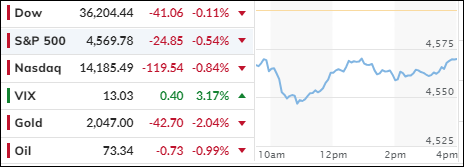
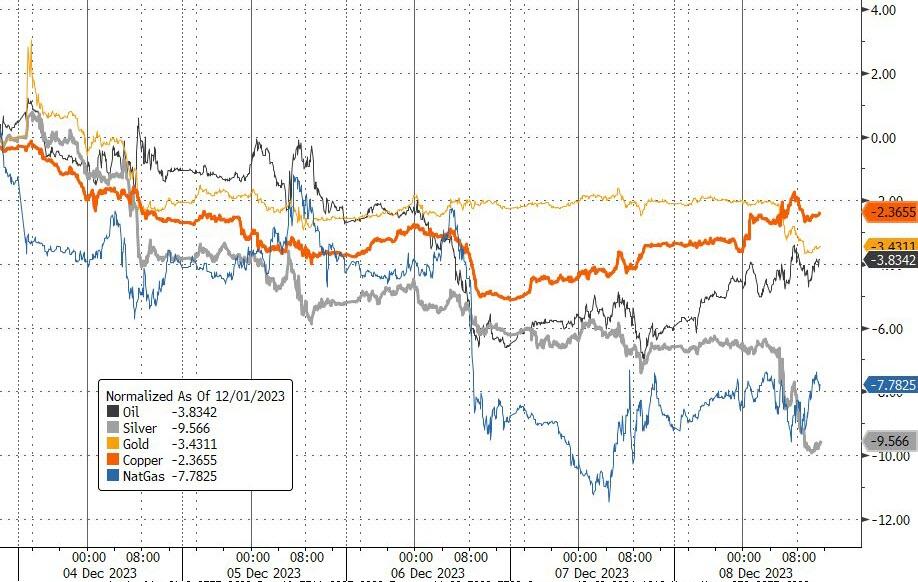
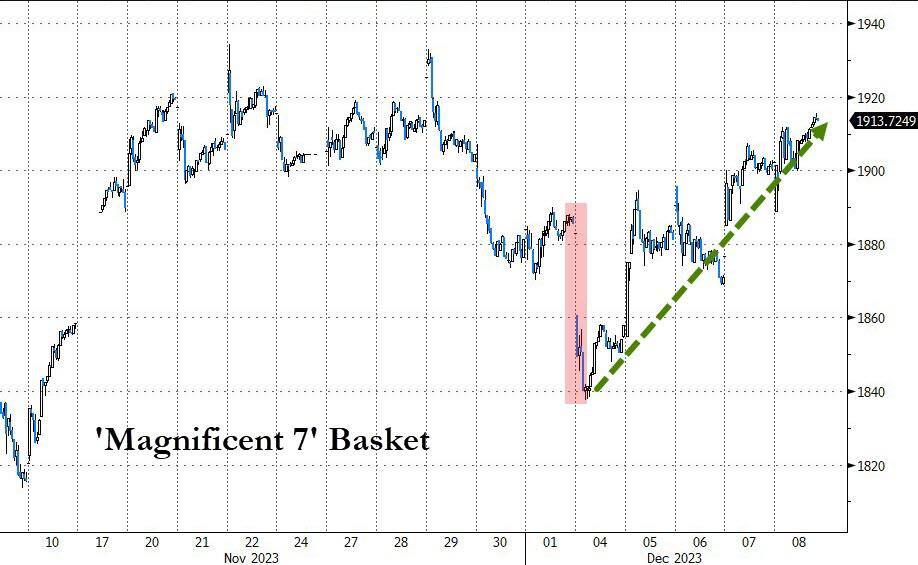
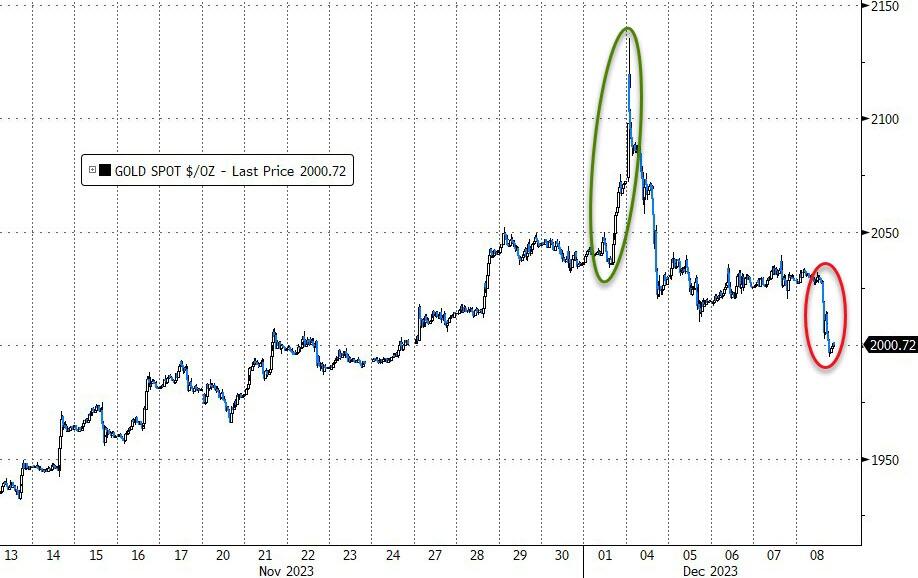
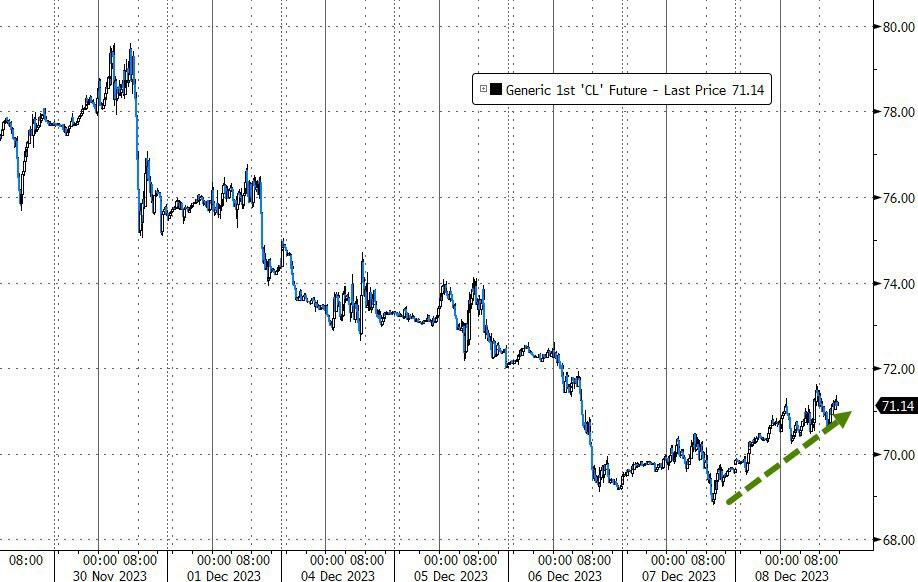
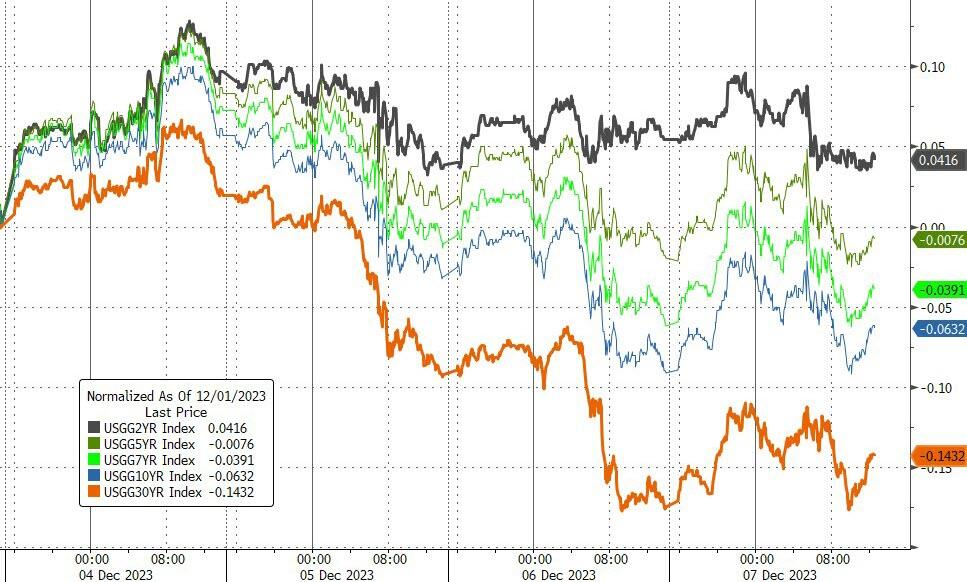
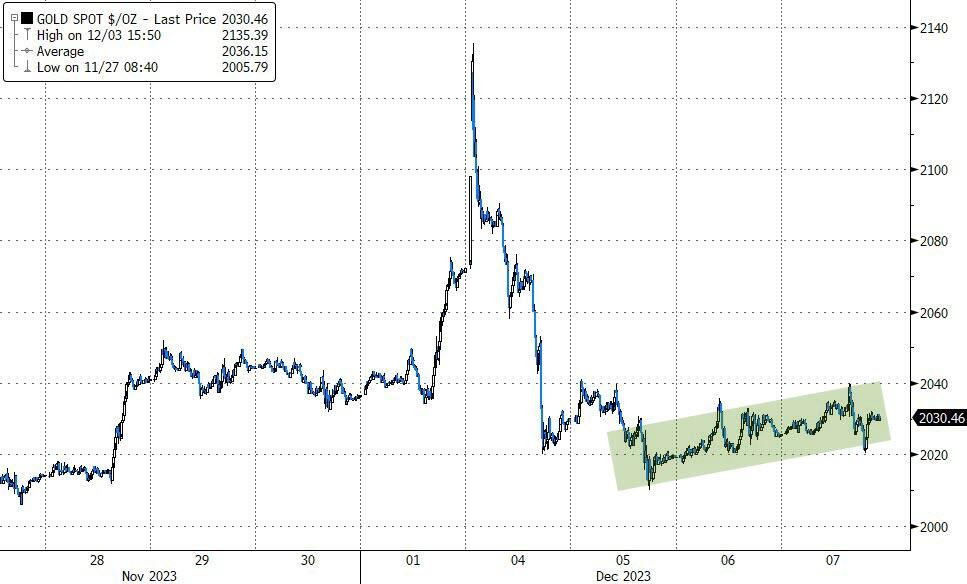
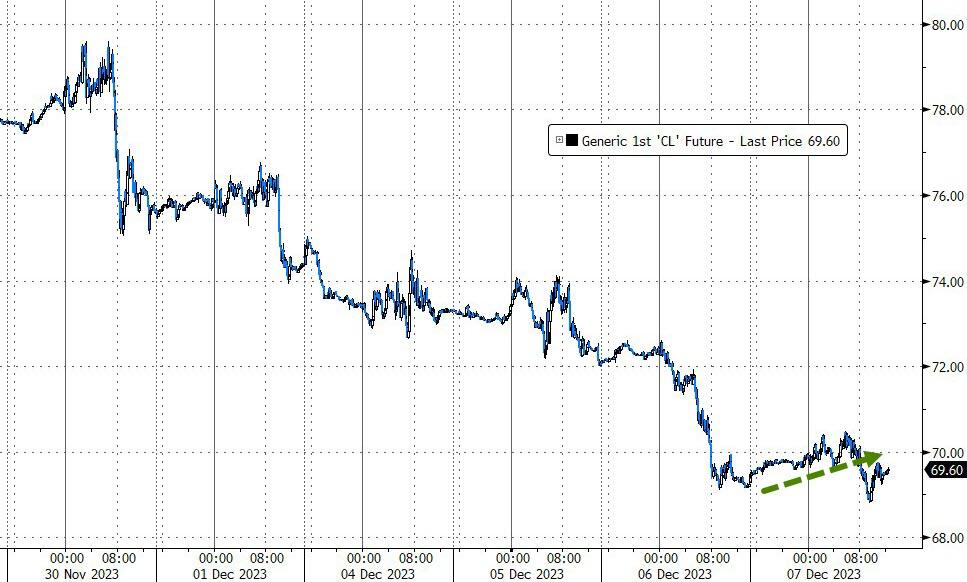
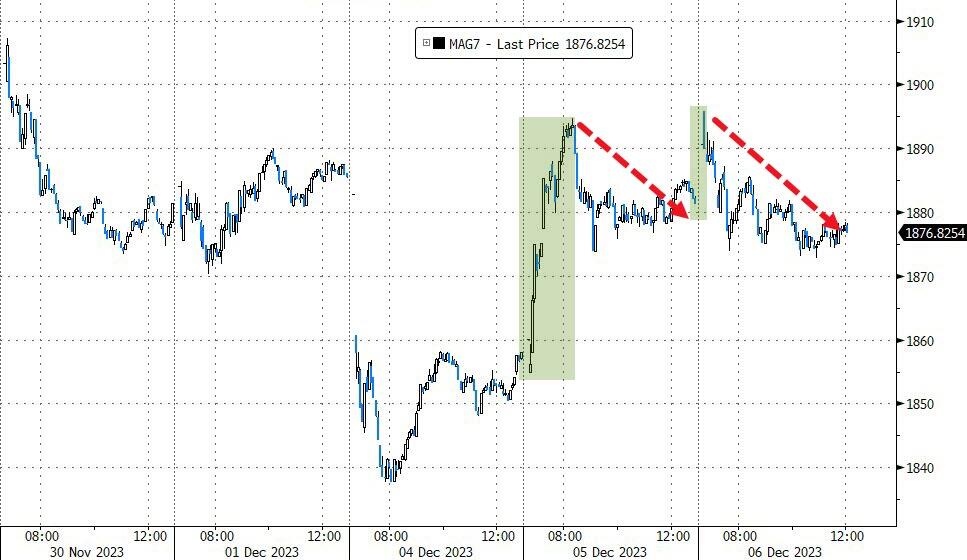
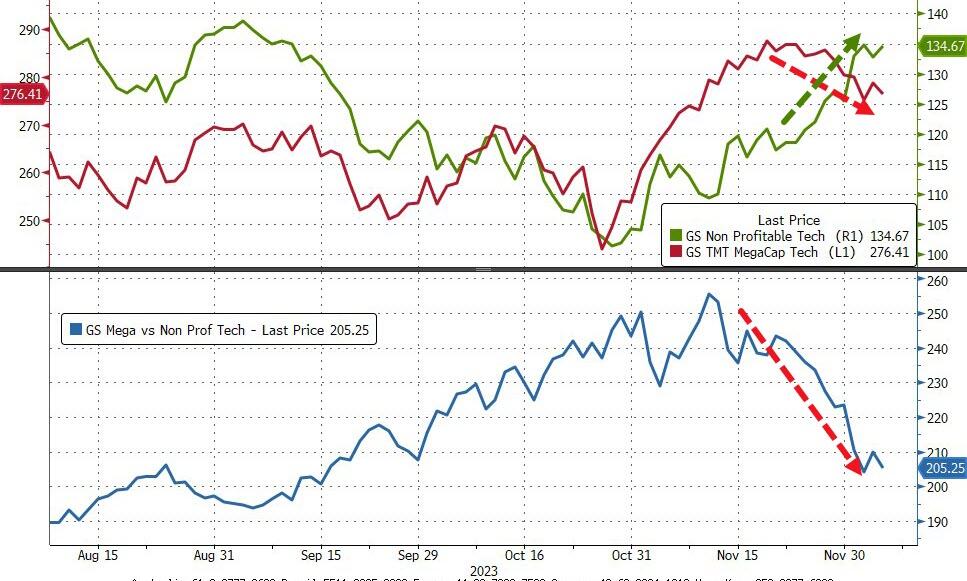
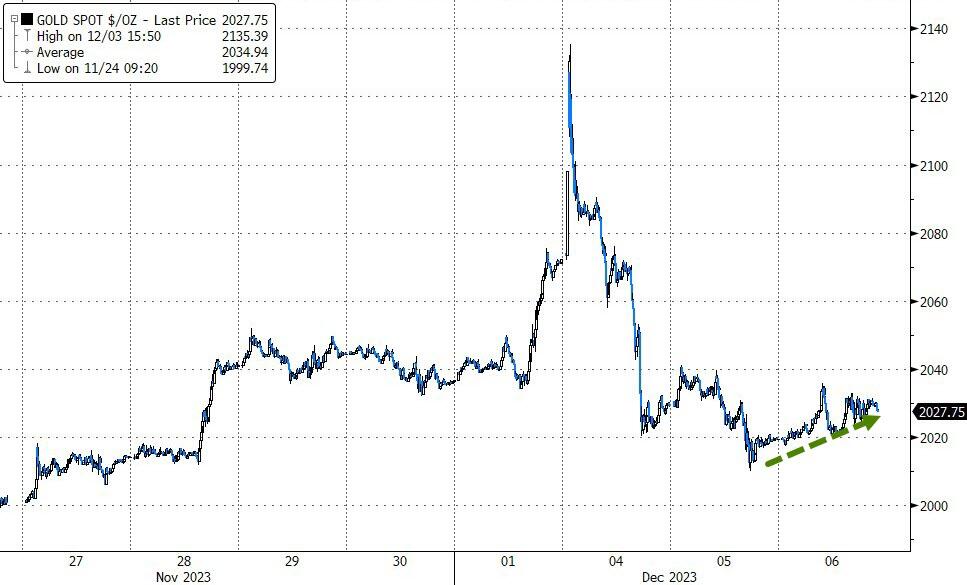
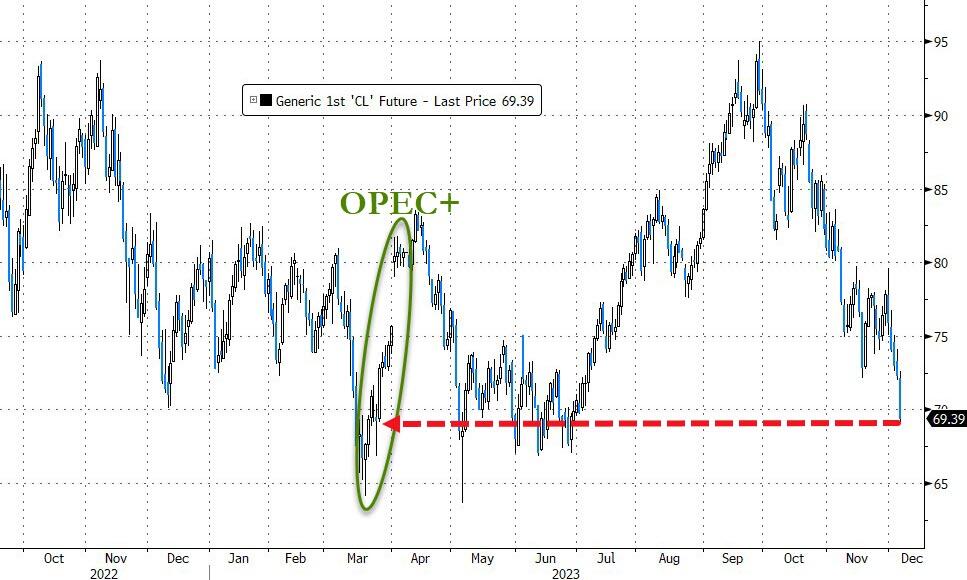
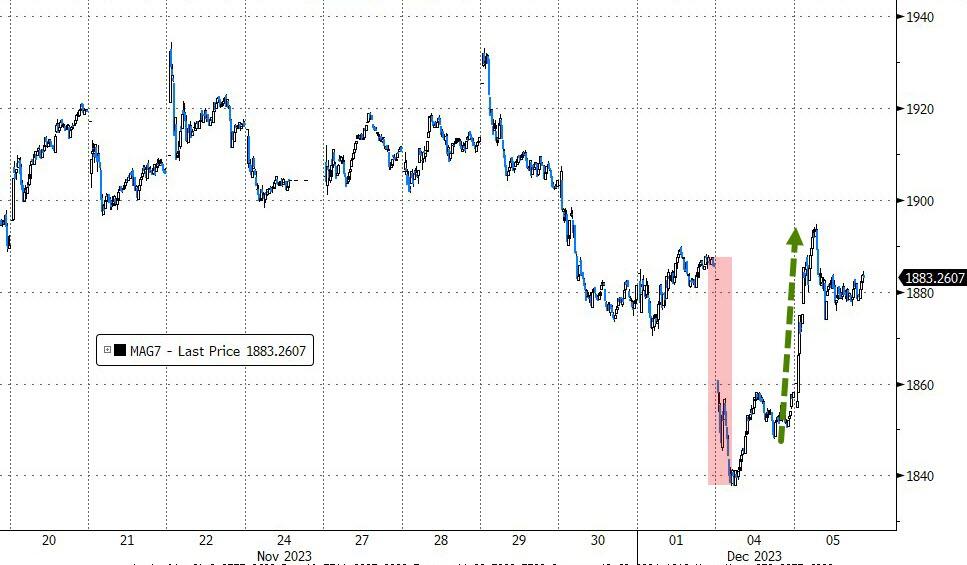
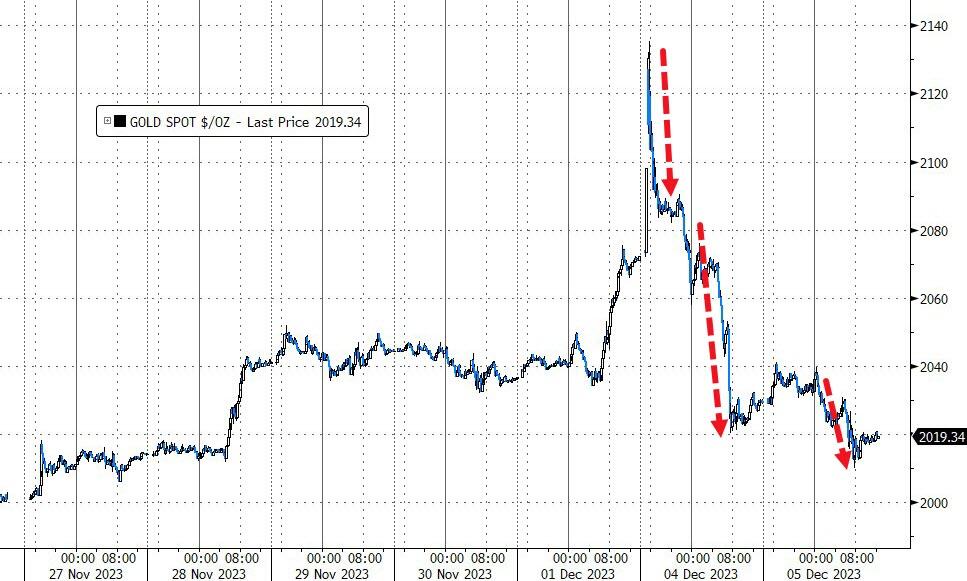
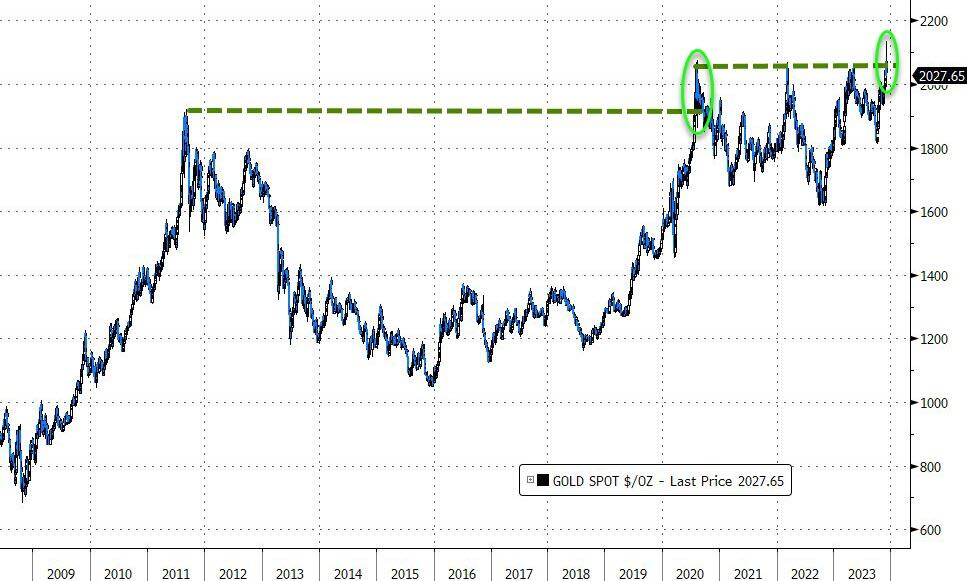
It has also made bonds less attractive and stocks more volatile. This week, stocks swung wildly, with small caps and big tech doing better than the rest. Gold fell but held above $2,000, while oil bounced back from a six-day slump.
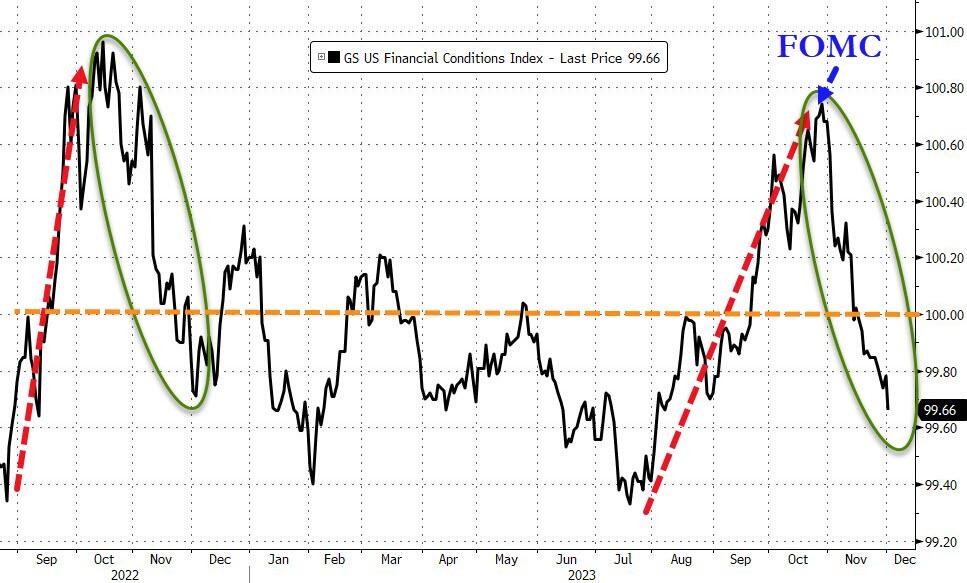
So, what’s next for the market? Will it keep rising or fall off a cliff? Will the Fed ease or tighten? Will inflation stay low or spike up?
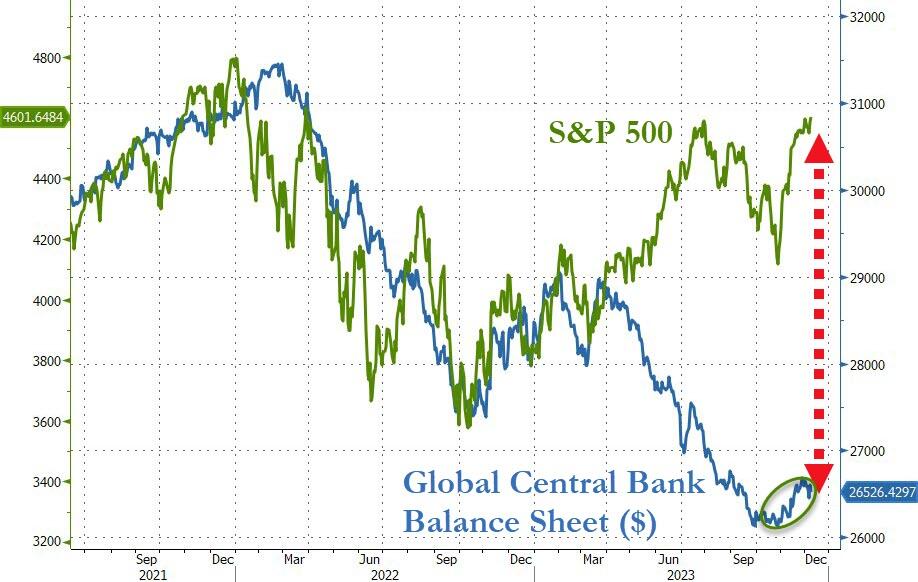
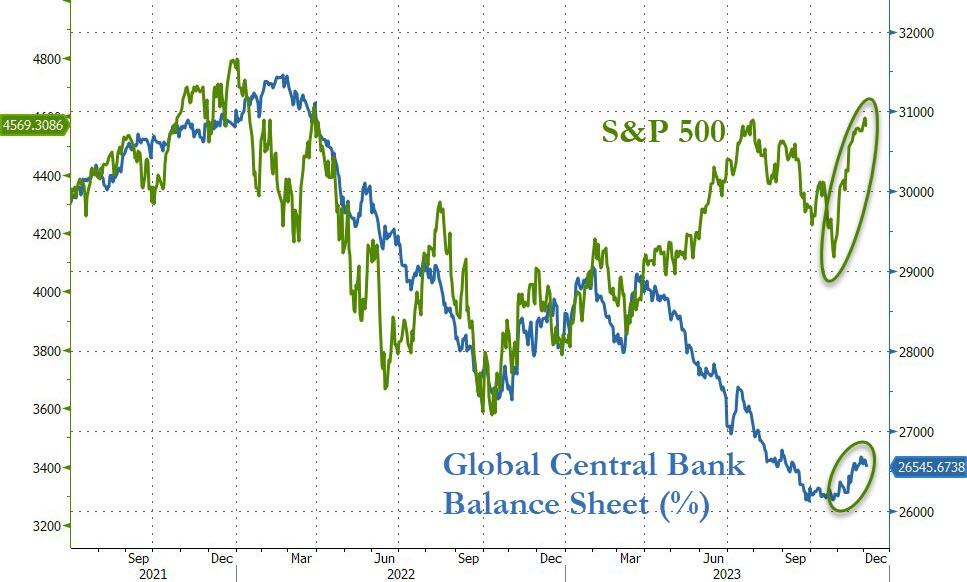
These are the questions that keep traders awake at night. And the answers are not easy to find. As ZeroHedge asked: “Which comes first—the equity market collapse or global central bank balance sheet explosion?”
This chart shows the dilemma, but my guess is the former.
Read More