
- Moving the markets
The stock market seems to be living in a paradox these days. Weak economic data, which usually spells trouble for equities, has been boosting them instead. Why? Because investors are hoping that the Fed will ease its monetary policy in response to the slowdown.
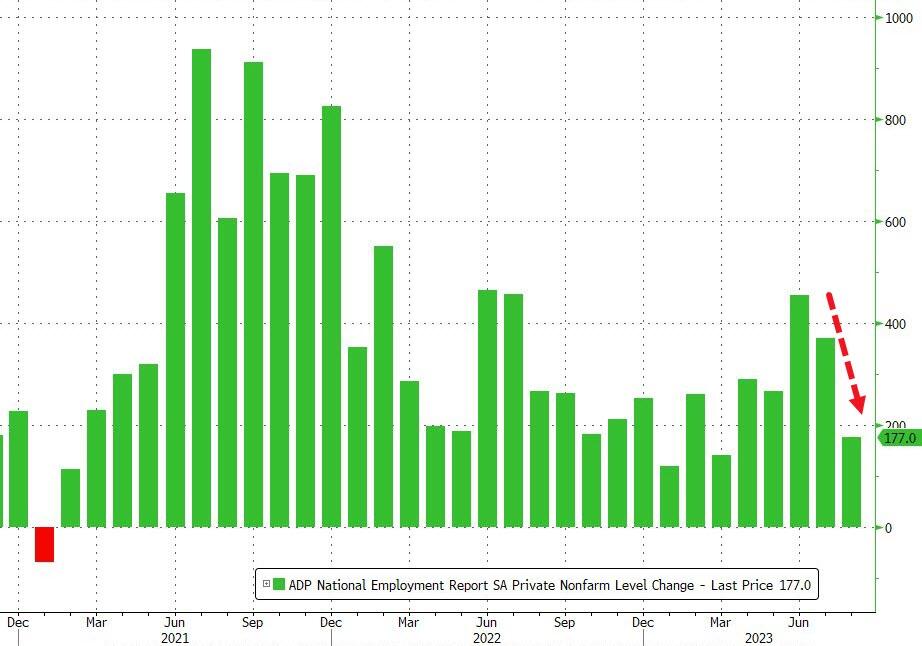
On Wednesday, traders got another dose of bad news. ADP reported that private employers added only 177k jobs in August, much lower than the revised 371k in July. This signaled a cooling off in the labor market and lowered the expectations of a rate hike.
Meanwhile, the annual GDP growth rate was also revised down to 2.1% from 2.4%, adding to the gloomy picture of the economy.
This was the second day in a row that investors shrugged off poor economic data and pushed stocks higher. On Tuesday, the major U.S. indexes rallied after disappointing consumer confidence figures and a sharp drop in job openings for July. This sparked hope that the Fed could be more dovish in its upcoming meetings.
Some analysts call this a ‘bad news is good news’ environment, which tends to happen when investors are worried about rates and Fed policy. Any softness in economic data reduces the upward pressure on yields, and that helps equities.
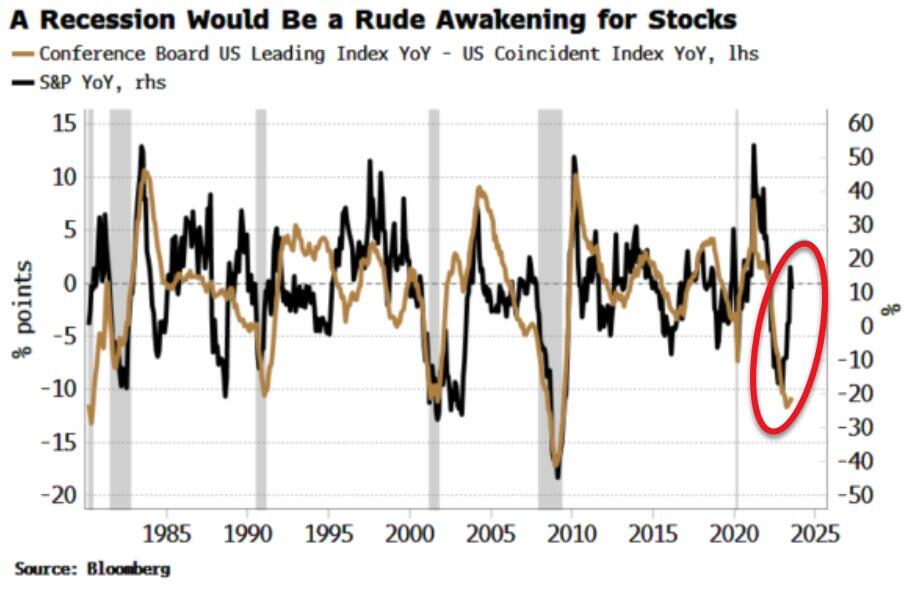
But this paradoxical situation may not last long, as Bloomberg’s Simon White noted. He pointed out the divergence between the S&P 500 index and the Leading Economic Index, which measures future economic activity. The S&P 500 has been rising while the LEI has been falling, suggesting that stocks are out of sync with the recession risks.
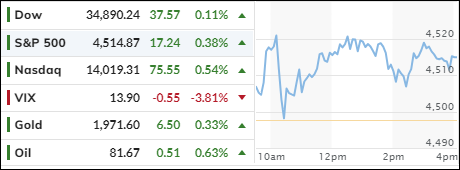
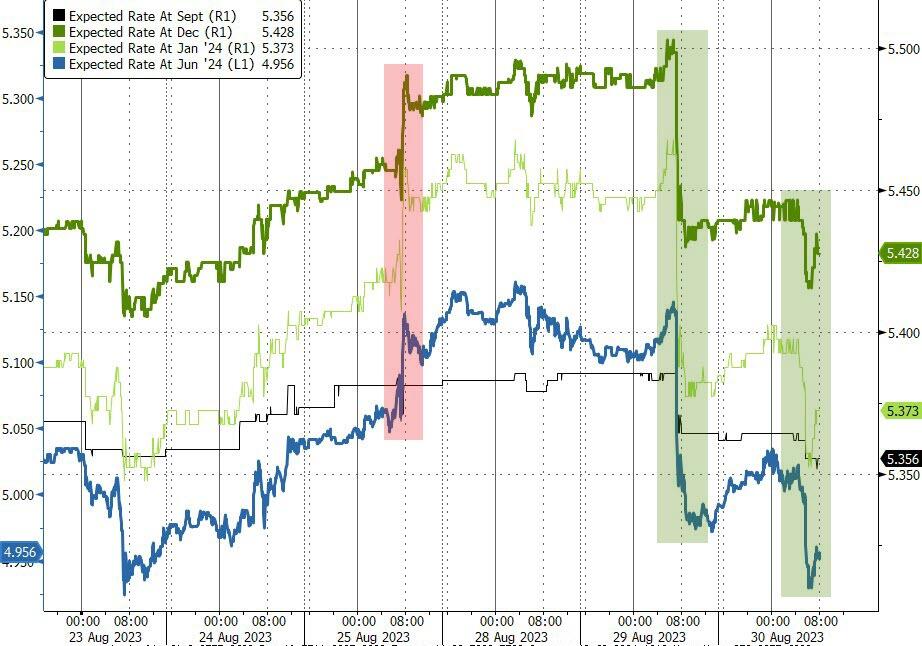
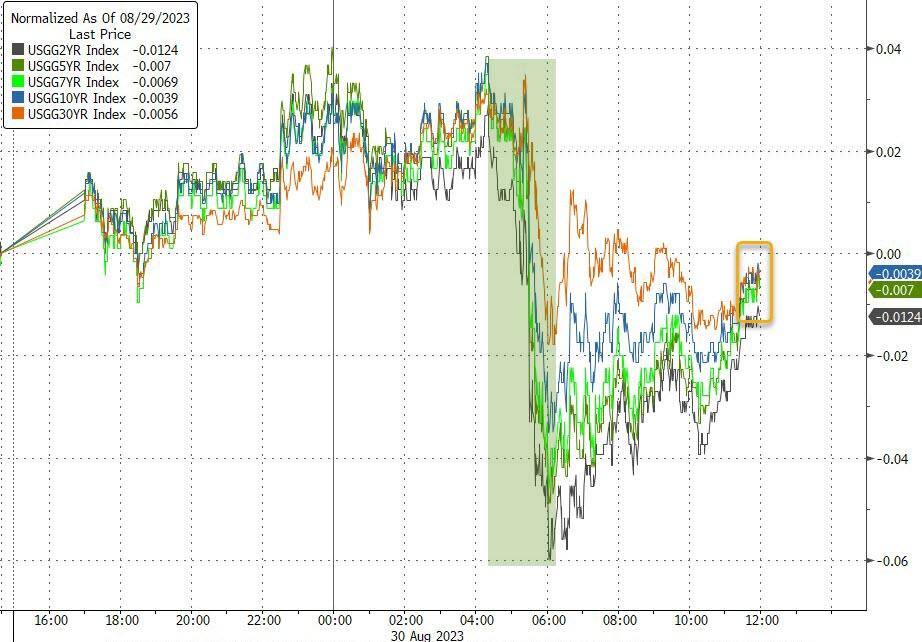
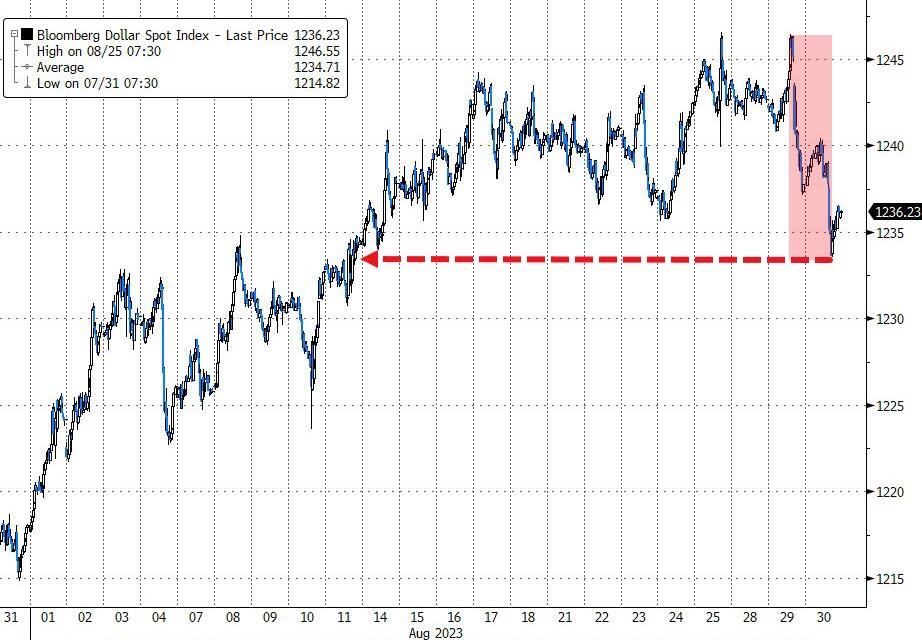
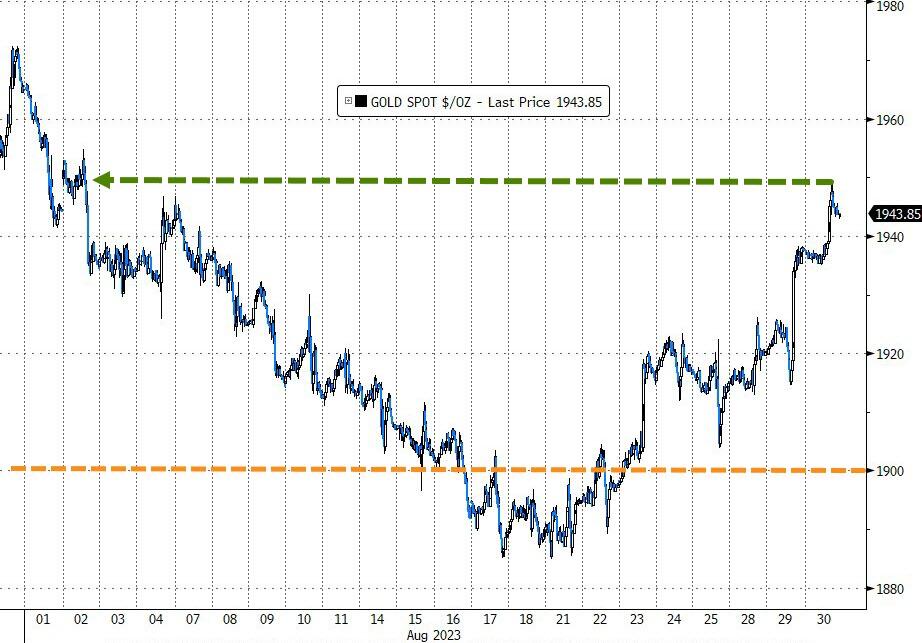
The bond market also showed signs of volatility, as yields swung wildly but closed lower on Wednesday. The dollar weakened again, giving a boost to gold prices.
So, what does this all mean for us trend followers?
It means that we need to be cautious and prepared for any surprises. The market may be enjoying the bad news for now, but it may not be able to ignore reality for long.
2. “Buy” Cycle Suggestions
The current Buy cycle began on 12/1/2022, and I gave you some ETF tips based on my StatSheet back then. But if you joined me later, you might want to check out the latest StatSheet, which I update and post every Thursday at 6:30 pm PST.
You should also think about how much risk you can handle when picking your ETFs. If you are more cautious, you might want to go for the ones in the middle of the M-Index rankings. And if you don’t want to go all in, you can start with a 33% exposure and see how it goes.
We are in a crazy time, with the economy going downhill and some earnings taking a hit. That will eventually drag down stock prices too. So, in my advisor’s practice, we are looking for some value, growth and dividend ETFs that can weather the storm. And of course, gold is always a good friend.
Whatever you invest in, don’t forget to use a trailing sell stop of 8-12% to protect yourself from big losses.
3. Trend Tracking Indexes (TTIs)
The stock market closed higher again, as investors hoped that weak economic data would prompt the Fed to ease its monetary policy. However, this optimism may be short-lived, as the reality of the economic slowdown could soon catch up with the market.
Our TTIs, which measure the direction and strength of the market trends, moved further into positive territory, indicating bullish sentiment for the time being.
This is how we closed 08/30/2023:
Domestic TTI: +3.38% above its M/A (prior close +3.06%)—Buy signal effective 12/1/2022.
International TTI: +4.81% above its M/A (prior close +4.65%)—Buy signal effective 12/1/2022.
All linked charts above are courtesy of Bloomberg via ZeroHedge.
Contact Ulli