
ETF Tracker StatSheet
You can view the latest version here.
US JOBS REPORT: MORE QUESTIONS THAN ANSWERS

[Chart courtesy of MarketWatch.com]
- Moving the markets
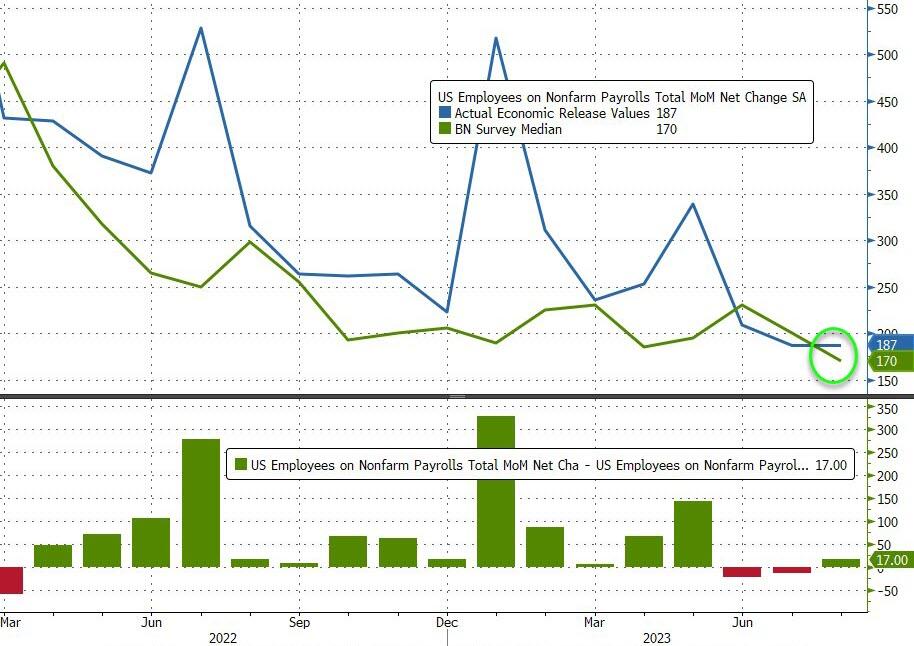
The US jobs report for August was a mixed bag that left investors scratching their heads. On one hand, the unemployment rate jumped to 3.8%, the highest since January, suggesting a slowdown in the labor market. On the other hand, the economy added 187k jobs, beating the forecast of 170k, indicating some resilience in hiring.
Some market bulls saw this as a sign that the Fed might pause its rate hikes, which initially boosted stock prices. But a closer look at the data revealed some worrying trends. According to ZeroHedge, every monthly payroll report in 2023 has been revised down, raising doubts about the reliability of the numbers. Moreover, 670k full-time jobs were lost in two months, while 1 million part-time jobs were added. That’s not a healthy picture for workers.
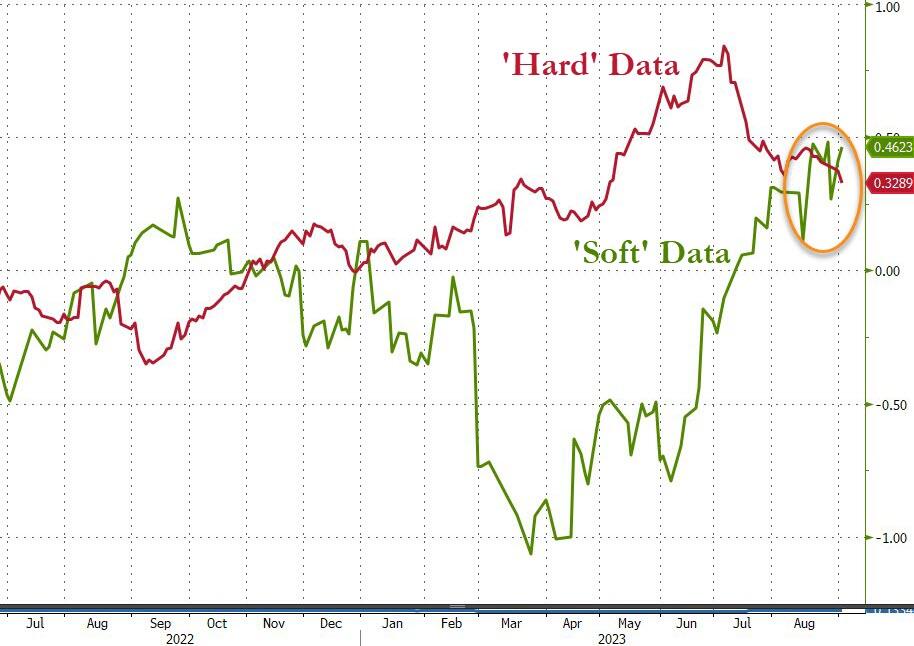
The manufacturing sector also showed signs of weakness, as the July data was worse than June’s. This revived the fears of stagflation, a situation where inflation rises while growth slows down. The ‘hard’ data, such as industrial production and retail sales, fell to four-month lows, while the ‘soft’ data, such as consumer confidence and business sentiment, rose to near-record highs. This suggests a disconnect between reality and expectations.
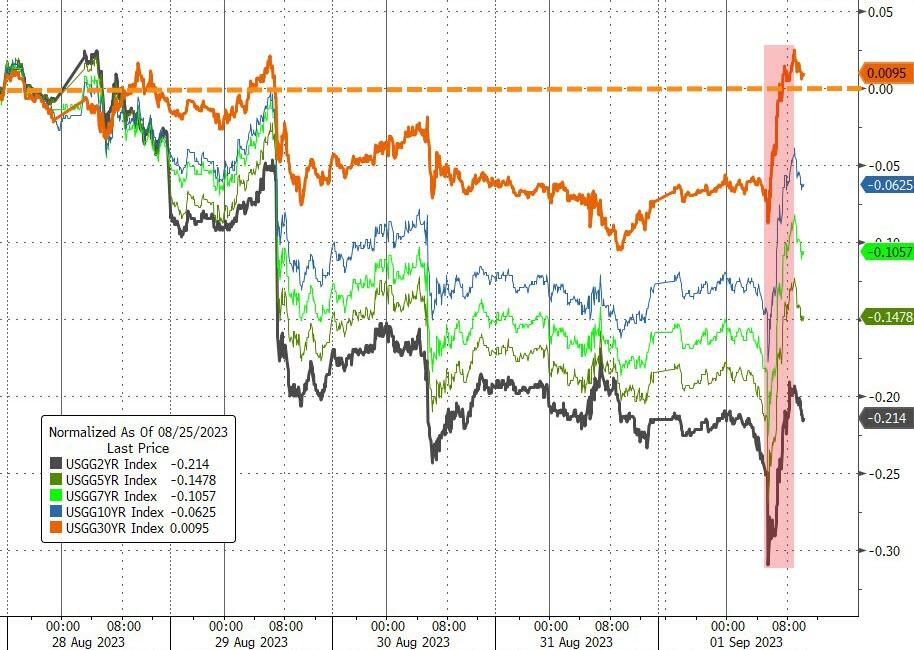
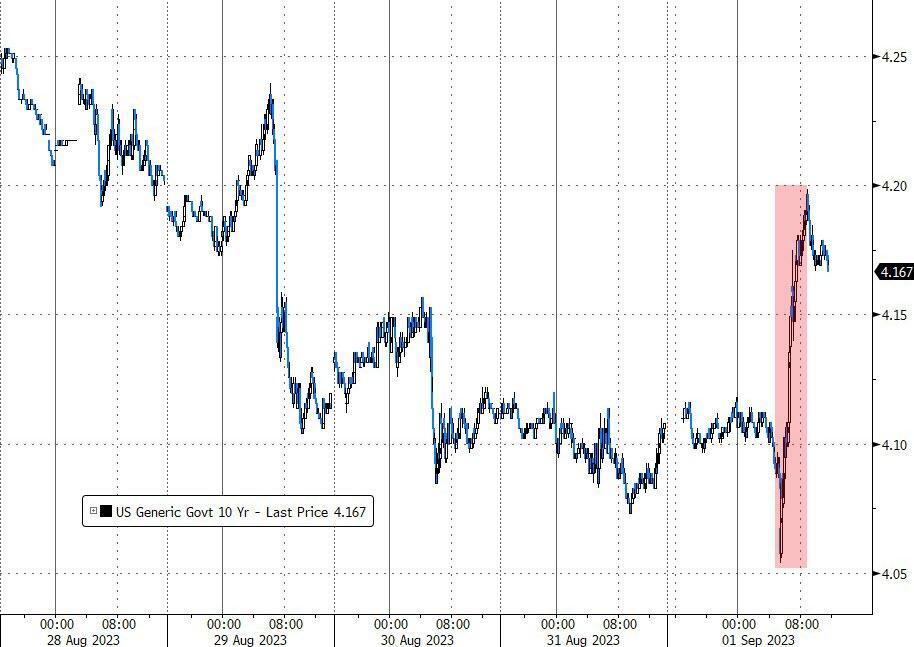
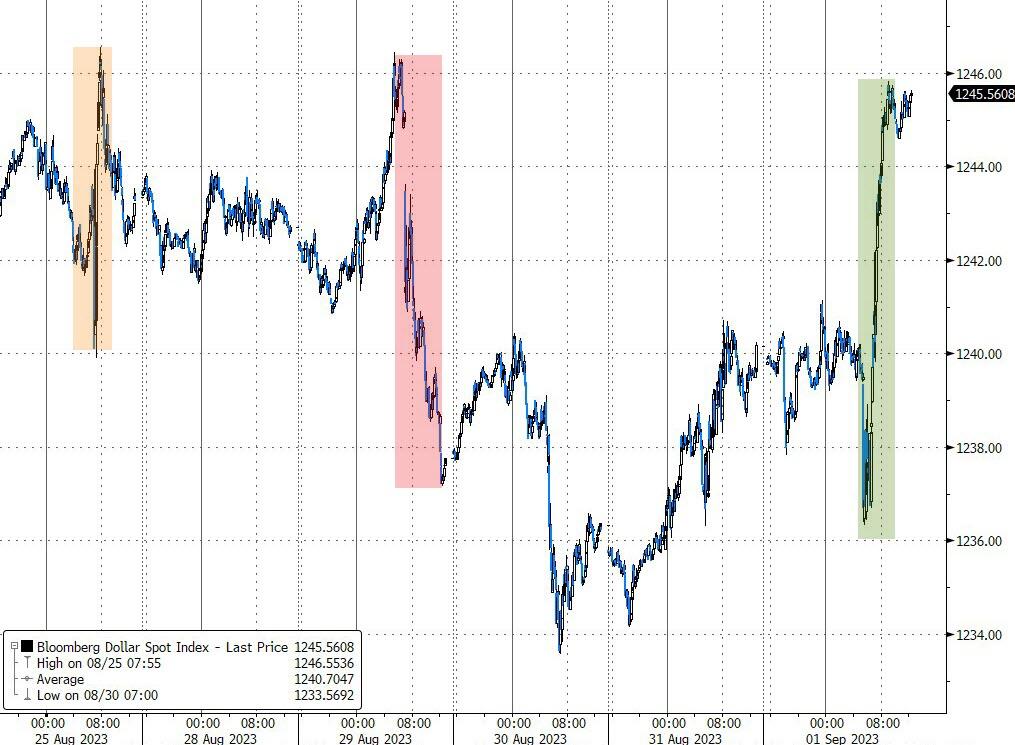
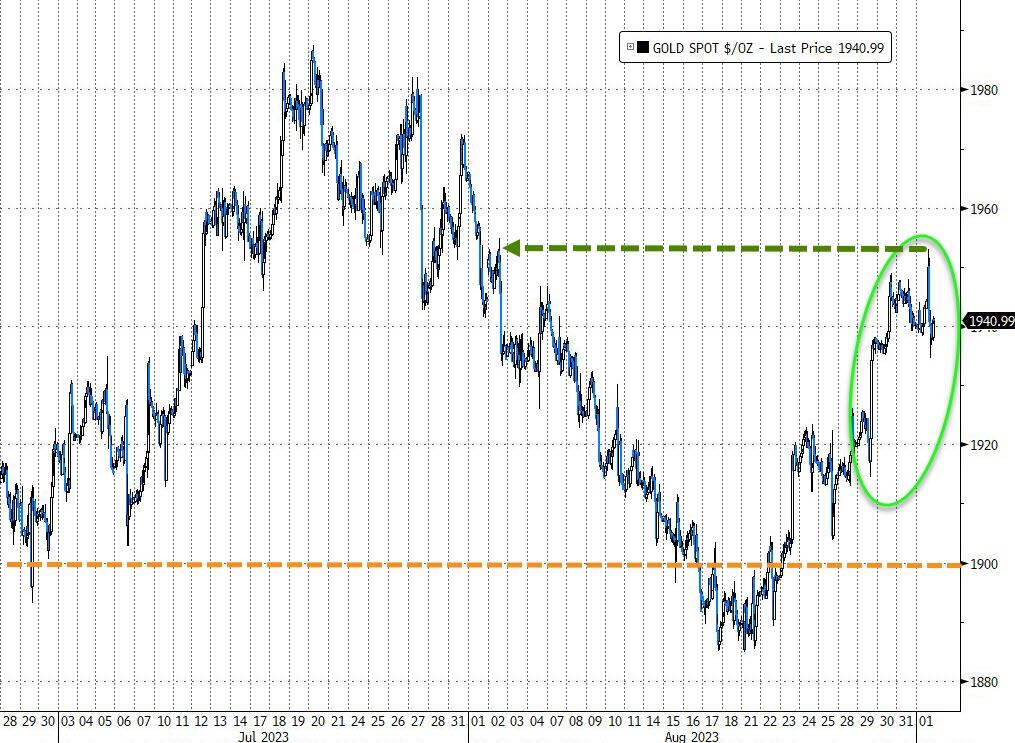
The stock market rally was also short-lived, as a sudden spike in bond yields dampened the mood. The 10-year Treasury yield jumped to 4.2%, the highest since March, making bonds more attractive than stocks. The dollar edged up slightly against other currencies, while gold continued its upward trend and reached one-month highs.
The August jobs report showed that the US economy is facing some headwinds and uncertainties. Stagflation could be looming on the horizon, and equities could face more volatility.
How will equities cope with this challenging environment?
2. “Buy” Cycle Suggestions
The current Buy cycle began on 12/1/2022, and I gave you some ETF tips based on my StatSheet back then. But if you joined me later, you might want to check out the latest StatSheet, which I update and post every Thursday at 6:30 pm PST.
You should also think about how much risk you can handle when picking your ETFs. If you are more cautious, you might want to go for the ones in the middle of the M-Index rankings. And if you don’t want to go all in, you can start with a 33% exposure and see how it goes.
We are in a crazy time, with the economy going downhill and some earnings taking a hit. That will eventually drag down stock prices too. So, in my advisor’s practice, we are looking for some value, growth and dividend ETFs that can weather the storm. And of course, gold is always a good friend.
Whatever you invest in, don’t forget to use a trailing sell stop of 8-12% to protect yourself from big losses.
3. Trend Tracking Indexes (TTIs)
The S&P 500 started the day with a strong gain, but it quickly reversed and fell into negative territory. However, the index recovered some of its losses and ended the day slightly higher than the previous close.
Our Domestic TTI, which tells us when to buy or sell domestic ETFs based on their long-term trend, also followed a similar pattern, and closed with a small increase.
This is how we closed 09/01/2023:
Domestic TTI: +3.38% above its M/A (prior close +3.02%)—Buy signal effective 12/1/2022.
International TTI: +4.46% above its M/A (prior close +4.53%)—Buy signal effective 12/1/2022.
All linked charts above are courtesy of Bloomberg via ZeroHedge.
———————————————————-
WOULD YOU LIKE TO HAVE YOUR INVESTMENTS PROFESSIONALLY MANAGED?
Do you have the time to follow our investment plans yourself? If you are a busy professional who would like to have his portfolio managed using our methodology, please contact me directly to get more details.
Contact Ulli