Weekly StatSheet For The ETF Tracker Newsletter – Updated Through 07/25/2024

Ulli ETF StatSheet Contact

ETF Data updated through Thursday, July 25, 2024
How to use this StatSheet:

  1. Out of the 1,800+ ETFs out there, I only pick the ones that trade over $5 million per day (HV ETFs), so you don’t get stuck with a lemon that nobody wants to buy or sell.
  1. Trend Tracking Indexes (TTIs)

These are the main indicators that tell you when to buy or sell Domestic and International ETFs (section 1 and 2). They do that by comparing their position to their long-term M/A (Moving Average). If they cross above, and stay there, it’s a green light to buy. If they fall below, and keep going, it’s a red light to sell. And to make sure you don’t lose your shirt if things go south, I also use a 12% trailing stop loss on all positions in these categories.

  1. All other investment areas don’t have a TTI and should be traded based on the position of each ETF relative to its own trend line (%M/A). That’s why I call them “Selective Buy.” In other words, if an ETF goes above its own trend line, you can buy it. But don’t forget to use a trailing sell stop of 12%, or less if you’re feeling nervous.

If some of these words sound like Greek to you, please check out the Glossary of Terms and new subscriber information in section 9.

  1. DOMESTIC EQUITY ETFs: BUY— since 11/21/2023
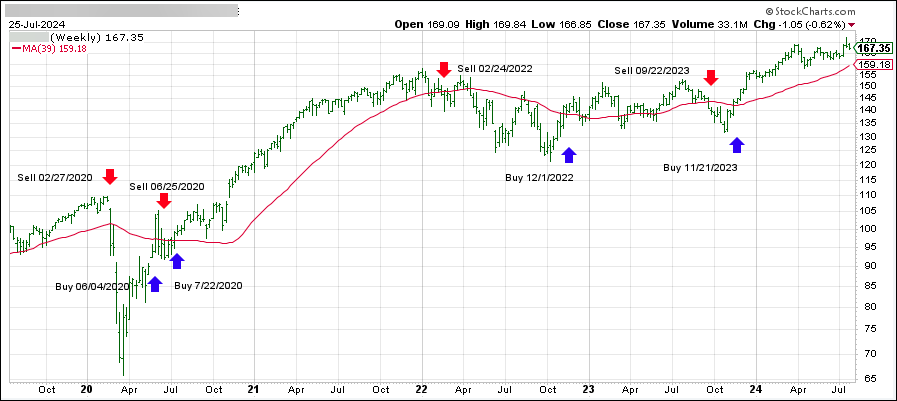
Click on chart to enlarge

This is our main compass, the Domestic Trend Tracking Index (TTI-green line in the above chart). It has broken above its long-term trend line (red) by +5.73% and is in “Buy” mode as posted.

Read More
Surprising GDP Report Shakes Market Expectations

Ulli Market Commentary Contact

[Chart courtesy of MarketWatch.com]

  1. Moving the market

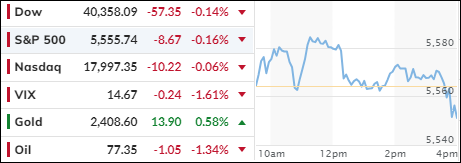
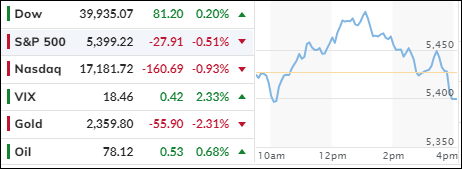
The rotation out of technology stocks continued early today, with the Nasdaq experiencing another drop, albeit more moderate than before.

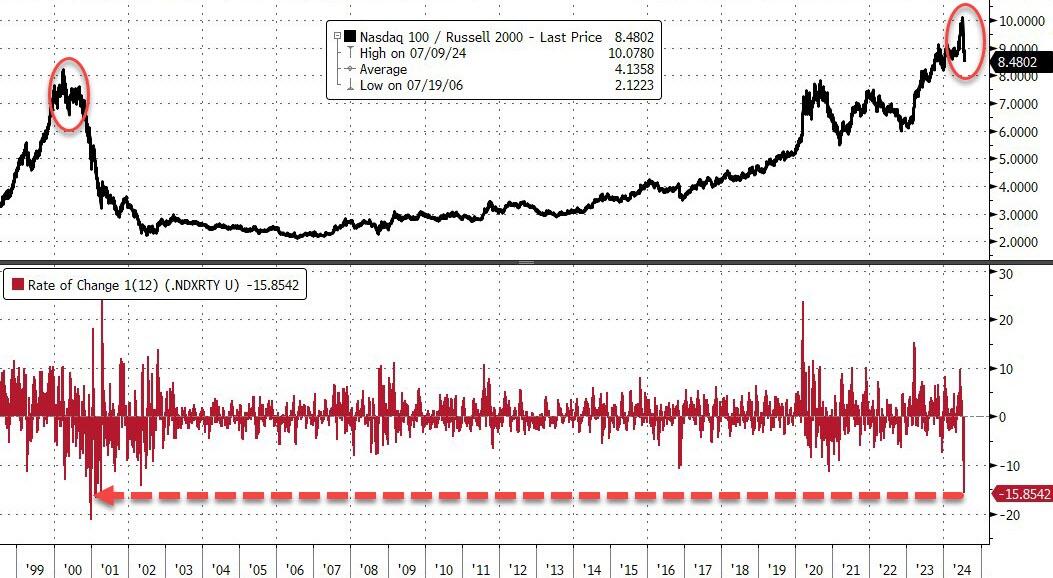
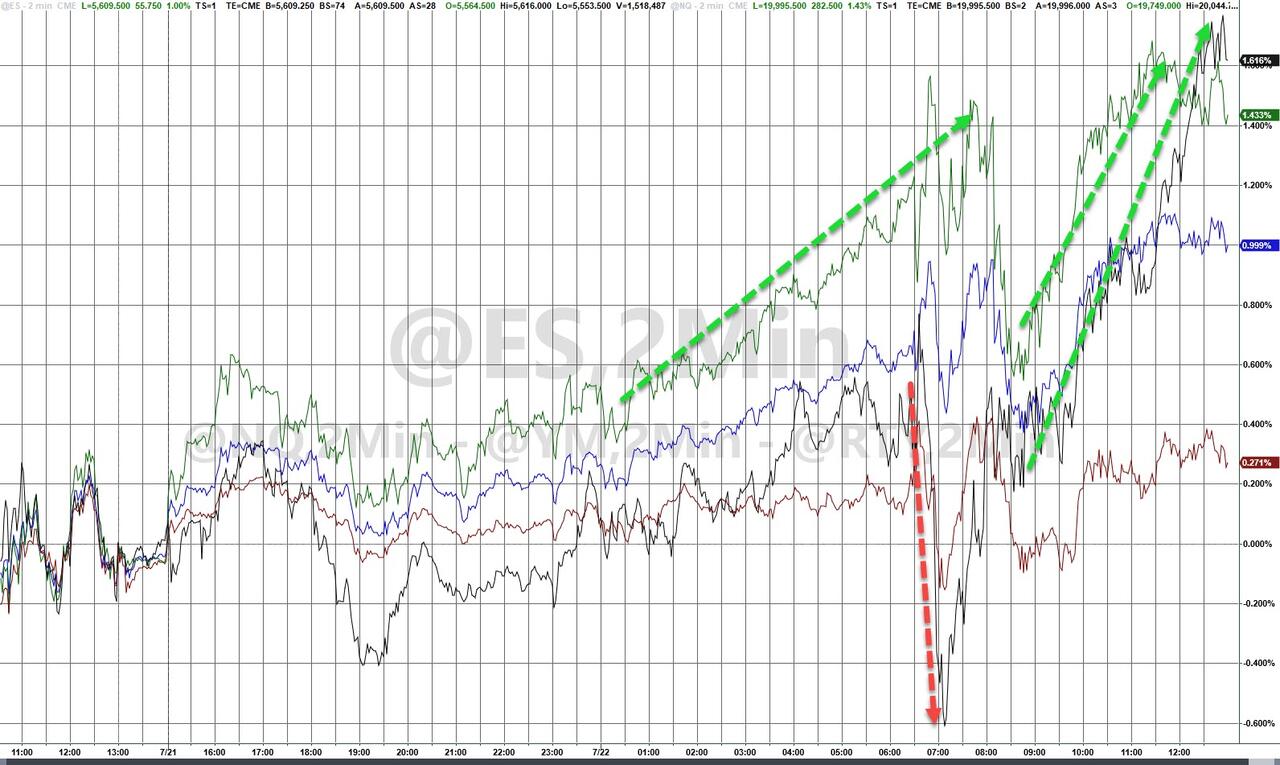
The indexes initially found some stability and rallied, but ultimately lost momentum by the close. The Nasdaq lagged, while Small Caps rallied, the S&P 500 sold off again, and only the Dow managed to eke out a meager gain. According to ZH, this marks the biggest underperformance of the Nasdaq compared to the Russell 2000 since the peak of the dotcom boom.

Traders sold off the year-to-date tech winners, dragging down the information technology and communications sectors. Nvidia and other mega-cap stocks, including Alphabet and Microsoft, slumped again as the fallout from disappointing earnings continued.

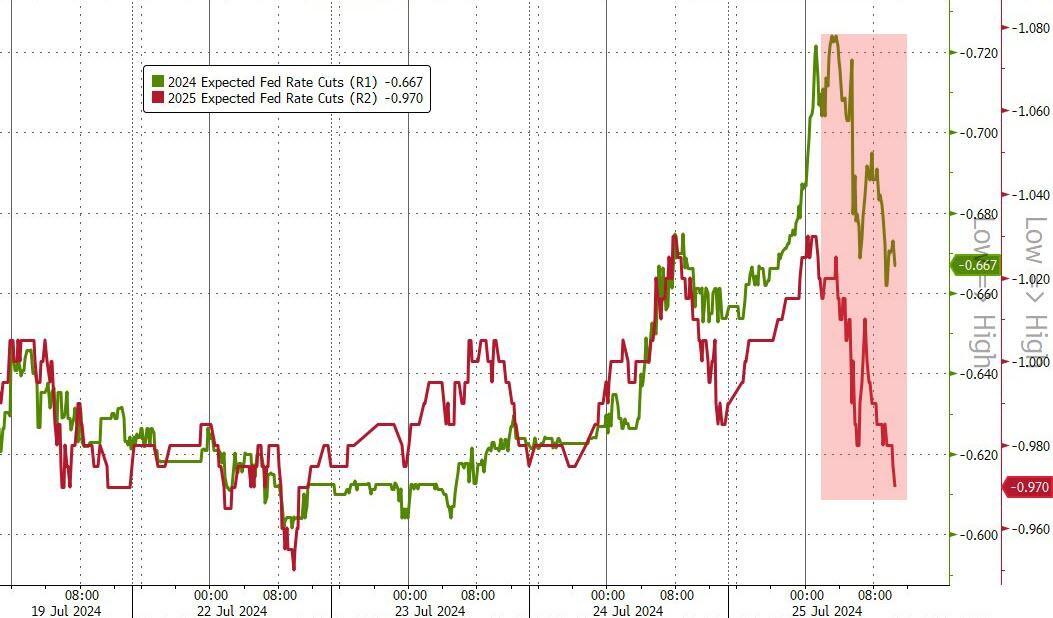
Adding to the confusion was the second quarter GDP report, which showed the economy allegedly growing at 2.8%, significantly higher than the expected 2.1%. This unexpected “good news” led to a pullback in rate-cut expectations. It will be interesting to see what the revision will reveal.

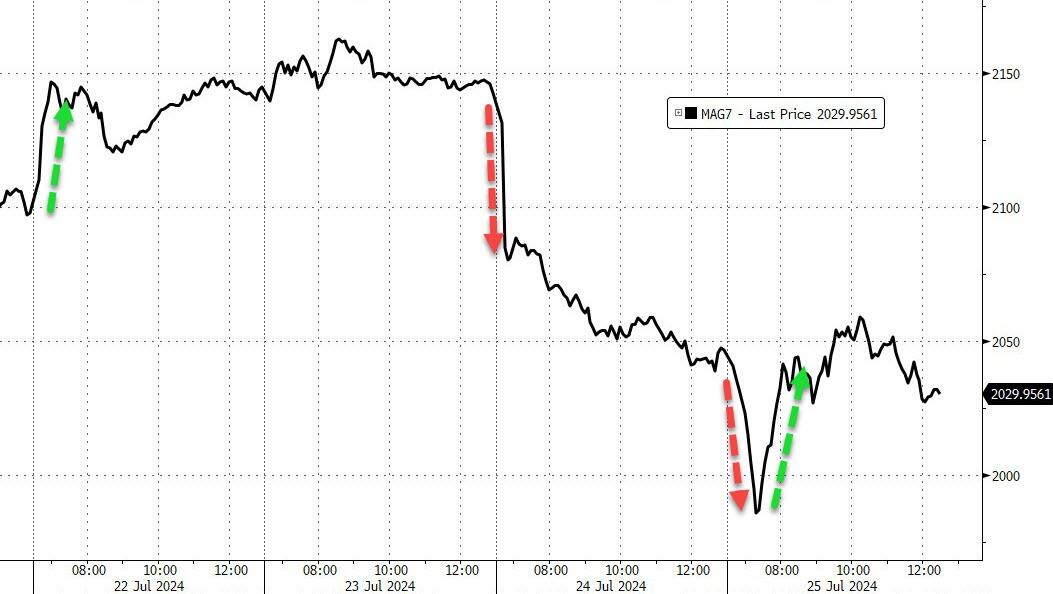
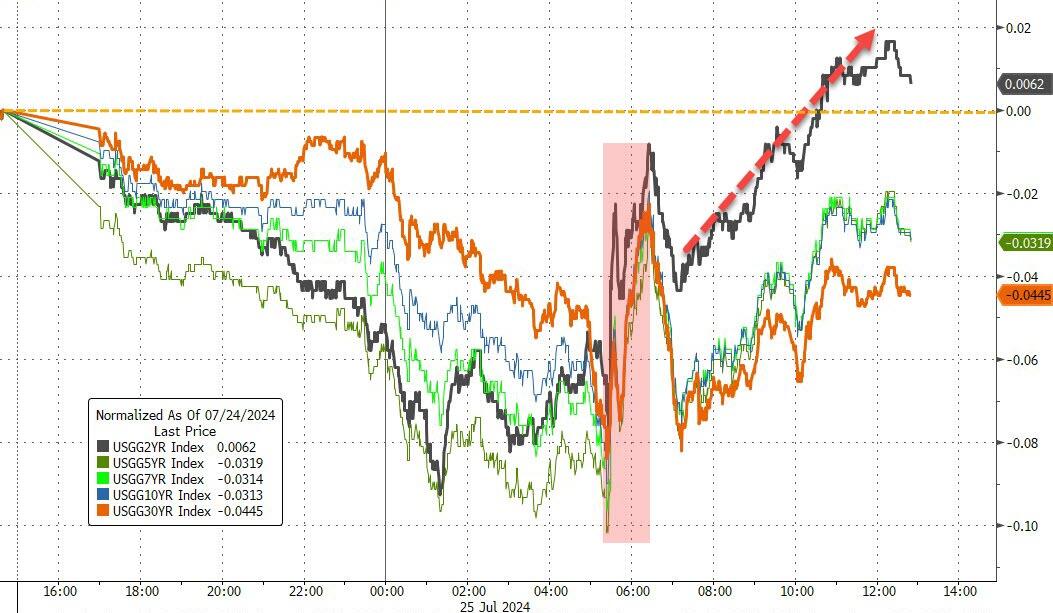
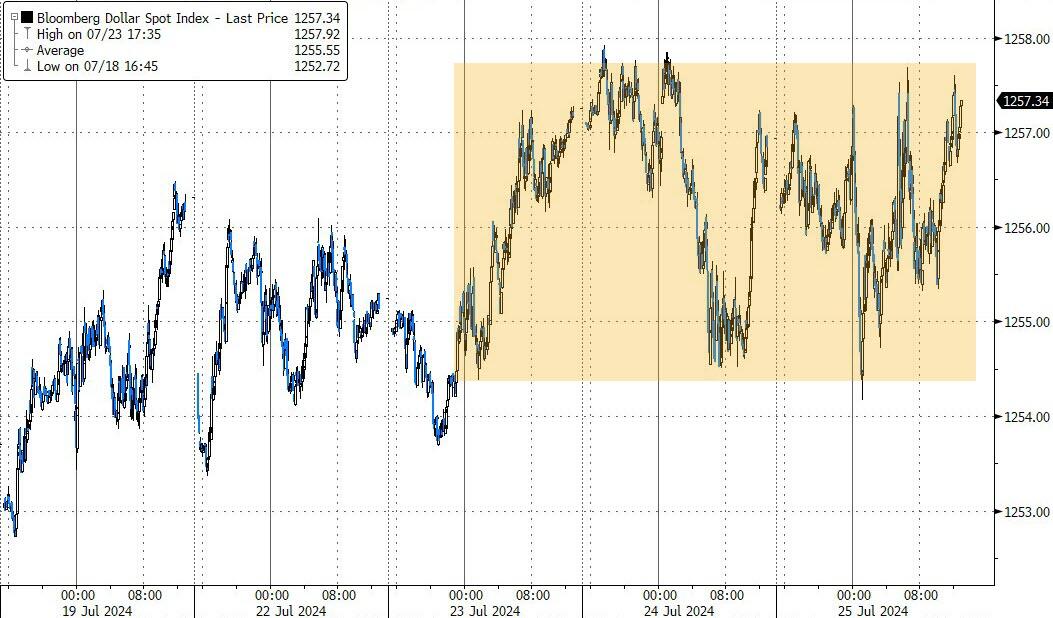
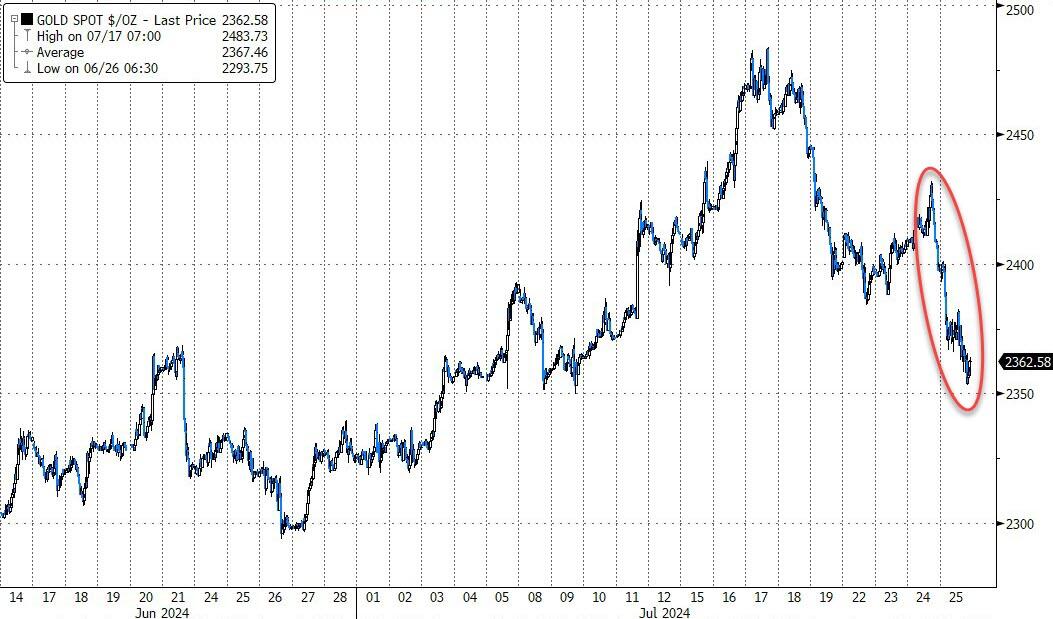
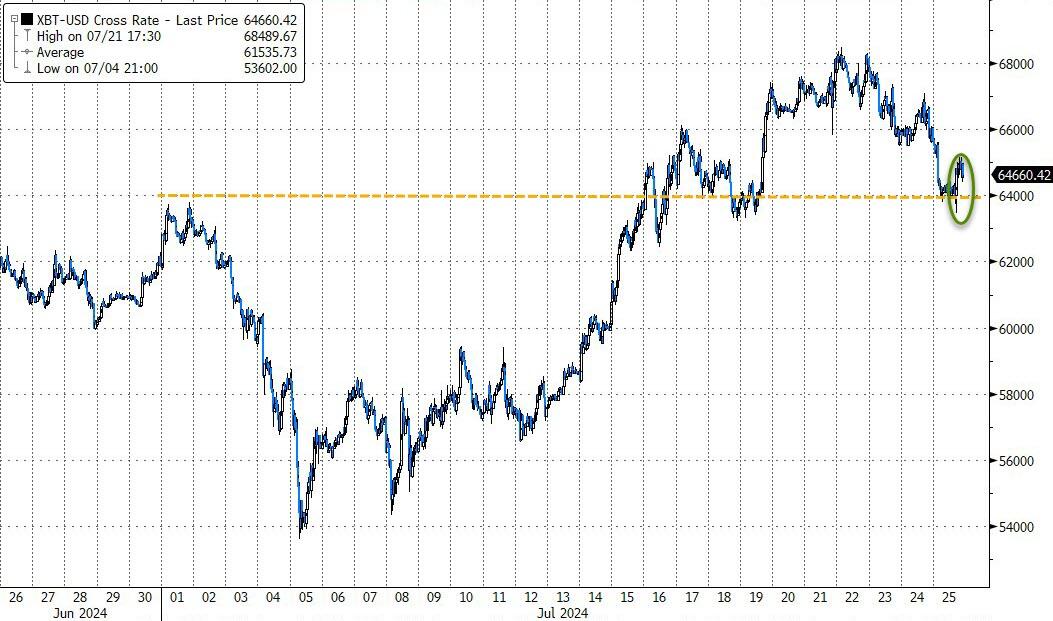
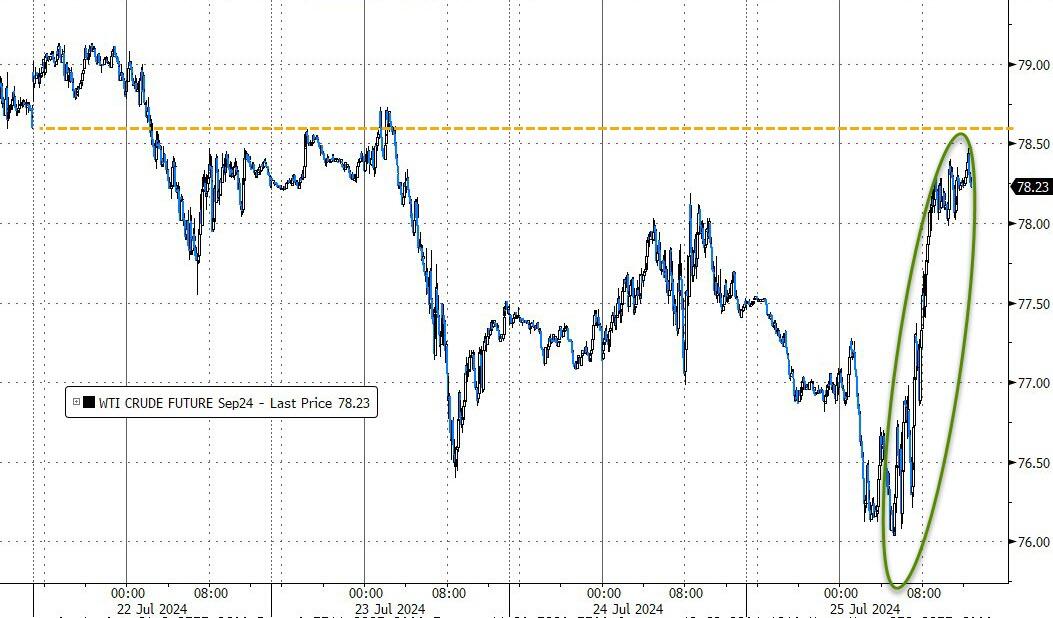
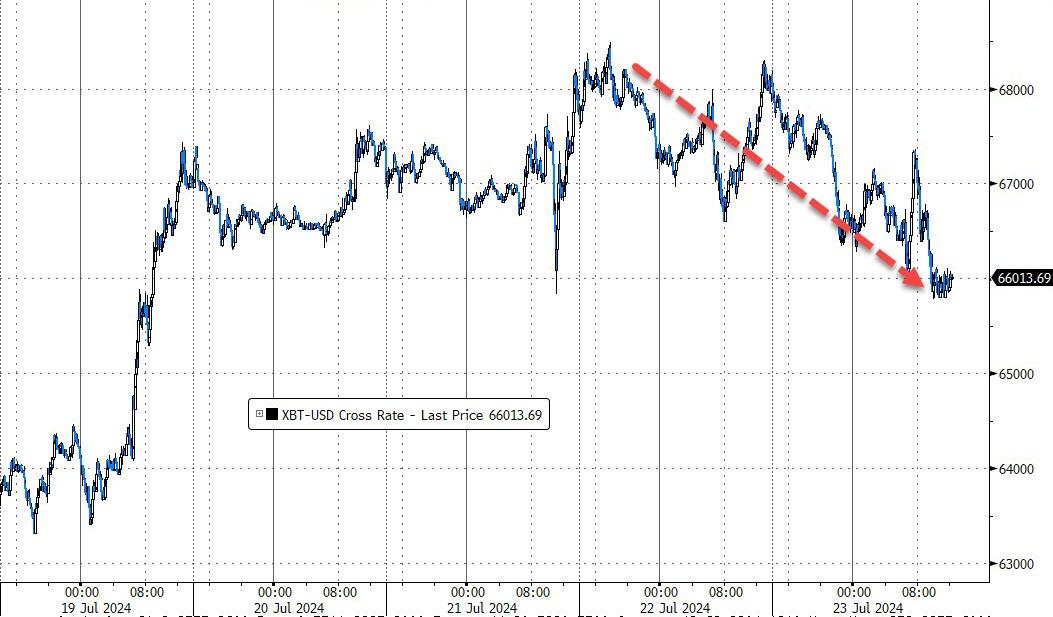
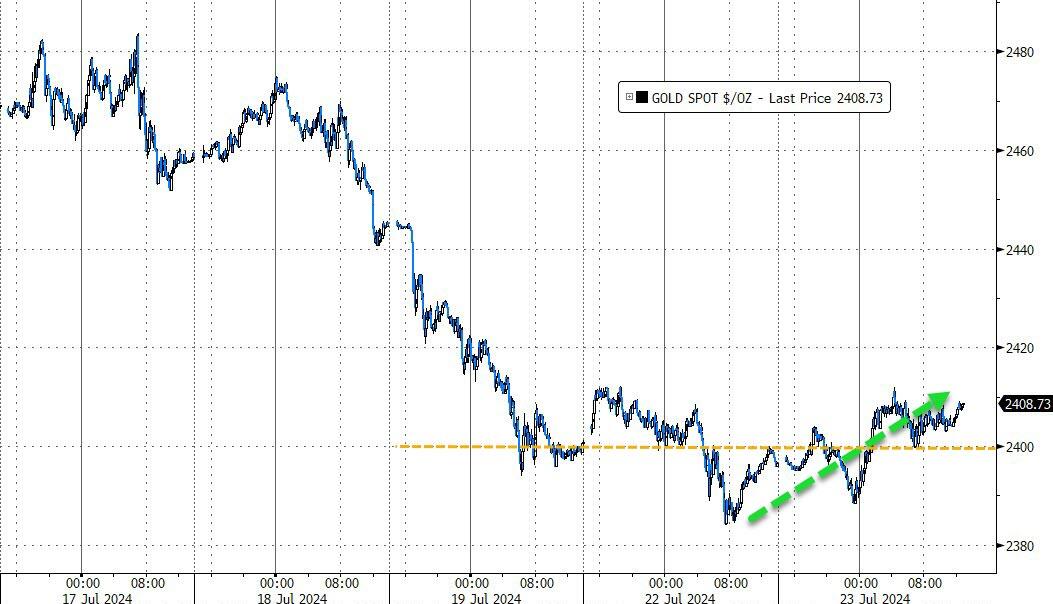
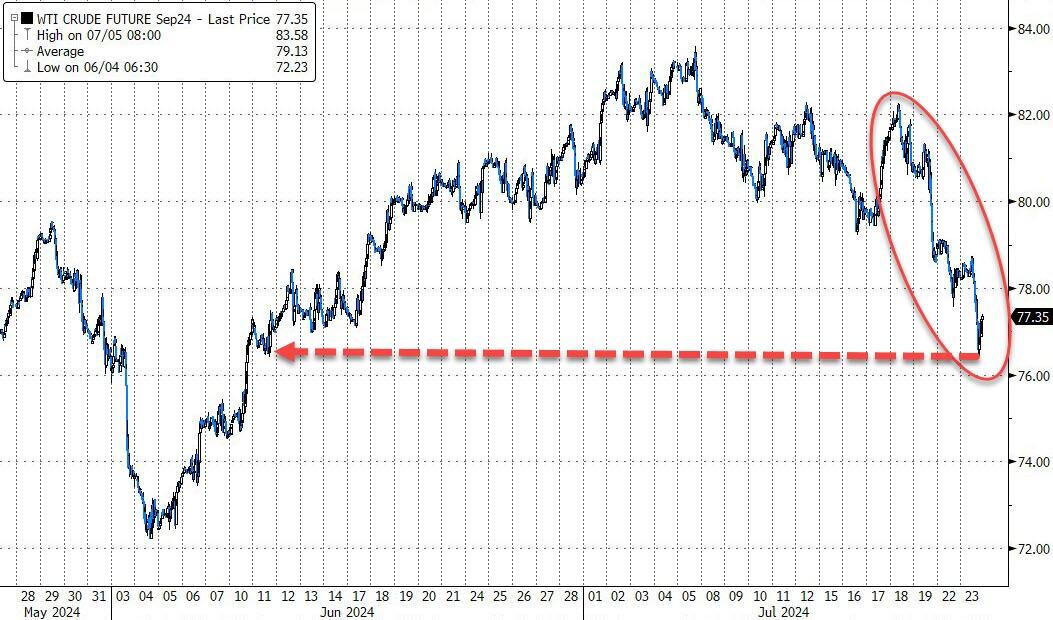
Other notable earnings misses came from Ford and Chipotle, despite Chipotle topping earnings and revenue expectations. The MAG7 stocks fluctuated but ended lower, bond yields were mixed, the dollar remained steady, and gold retreated to the 2,360 level. Bitcoin slipped but found support around $64,000, while crude oil returned to its unchanged level for the week.

I am pondering: Is the weakness in the economy now finally showing up in the markets?

Read More

Mega-Cap Stocks Suffer Largest Daily Loss Since October 2022

Ulli Market Commentary Contact

[Chart courtesy of MarketWatch.com]

  1. Moving the market

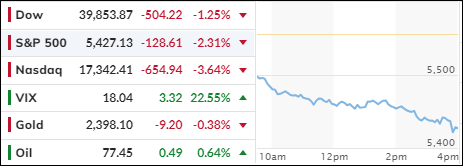
The word of the day was “underwhelming,” as disappointing earnings from Alphabet and Tesla dragged the Nasdaq down by approximately 3.5%, while the S&P 500 slipped by 2.3%. Alphabet’s shares fell by 5%, and Tesla’s stock proved even more volatile, plummeting 11% due to weaker-than-expected results. Major players like Nvidia, Meta, and Microsoft also suffered, with losses ranging from 4% to 6%.

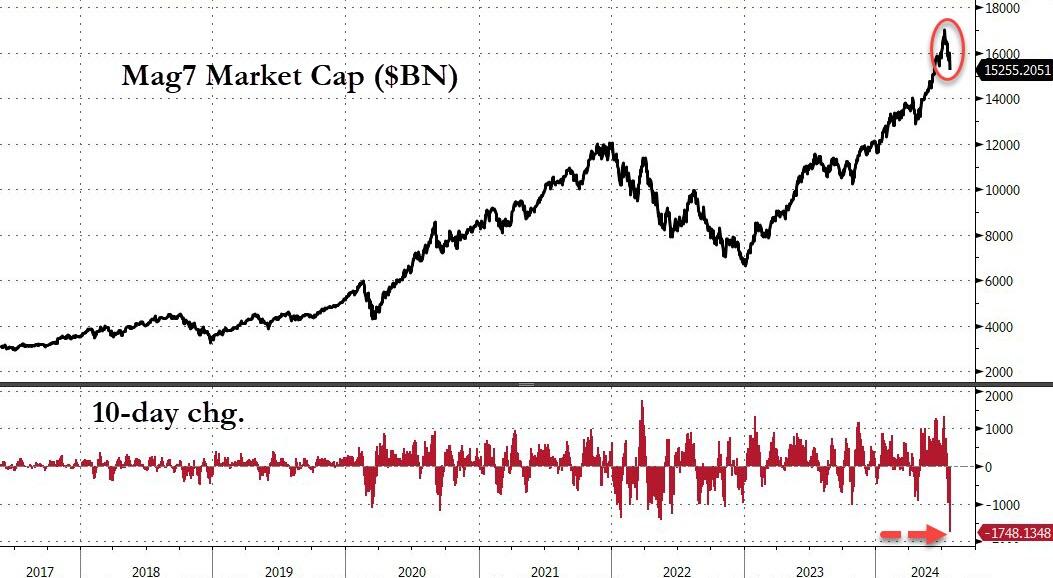
This marked the first significant reaction of mega-cap companies to a weakening economy. Traders are closely monitoring this development, as these companies were primarily responsible for the outsized returns in the first half of 2024.

The results from the MAG7 will likely indicate whether the tech sector has exhausted its momentum or if there is still potential for further gains to sustain bullish sentiment. However, today, this group of stocks experienced its largest daily loss since October 2022, with all seven components closing in the red.

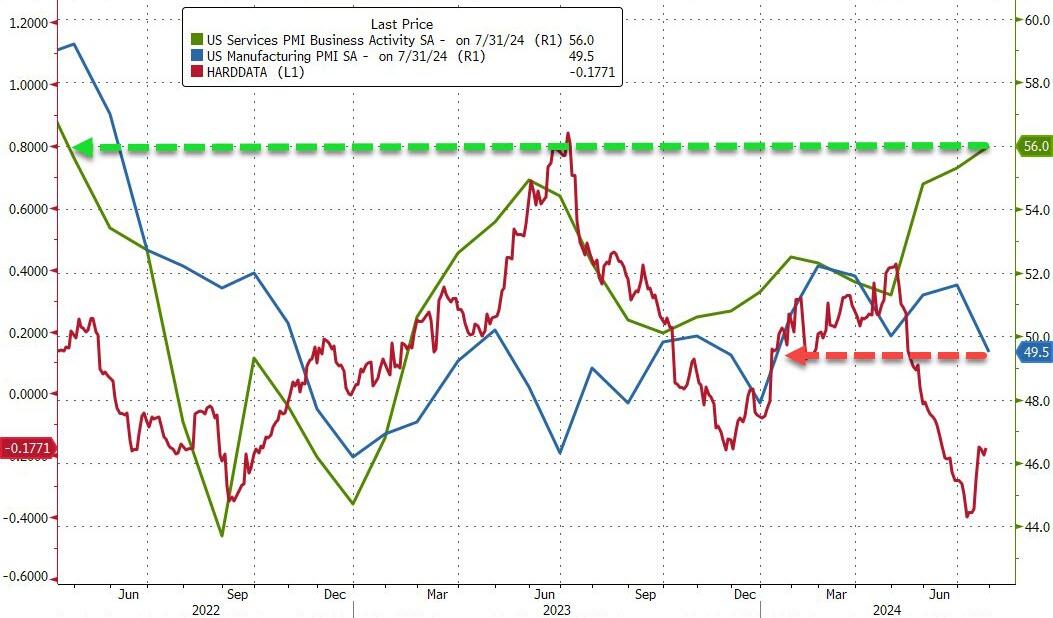
Adding to the market’s woes was a report showing weaker-than-expected manufacturing data, with the output index falling to 49.5 in July, indicating contraction. New orders, production, and inventories declined, making a mockery of the forecasted 51.5 index reading.

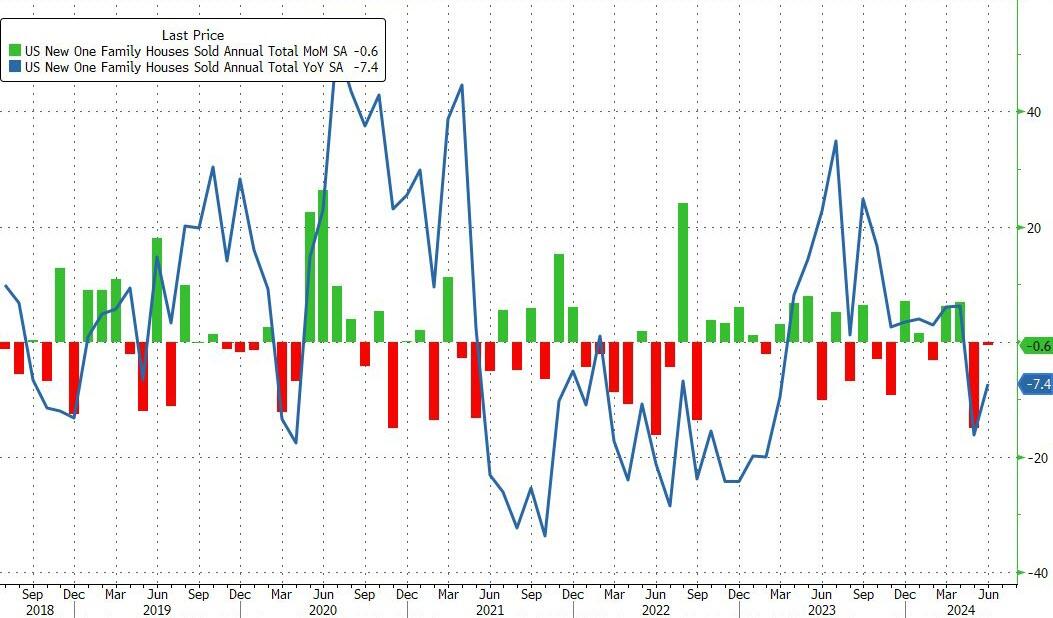
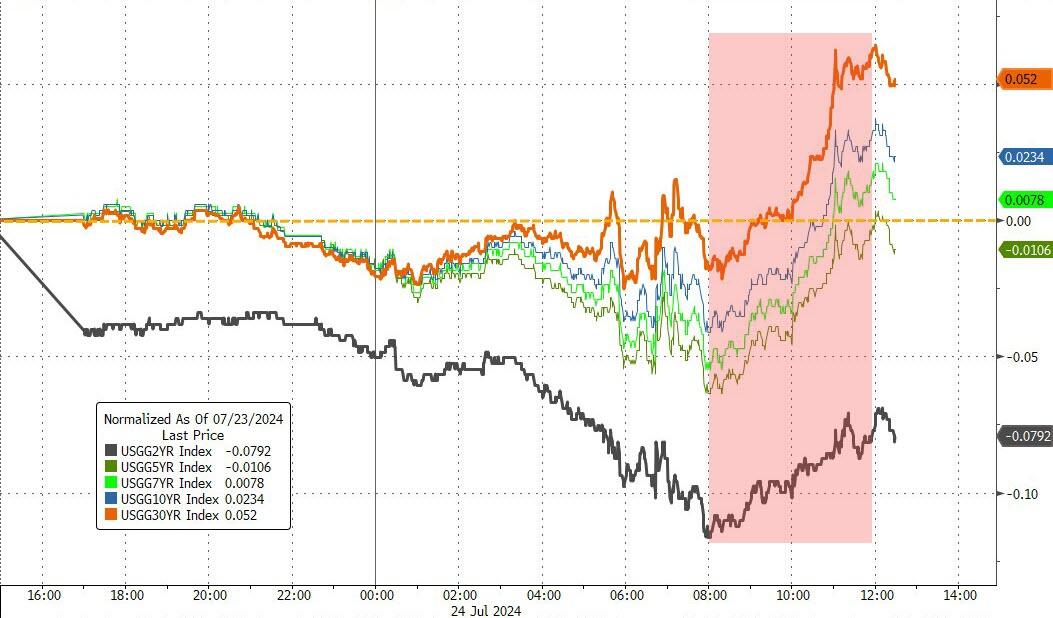
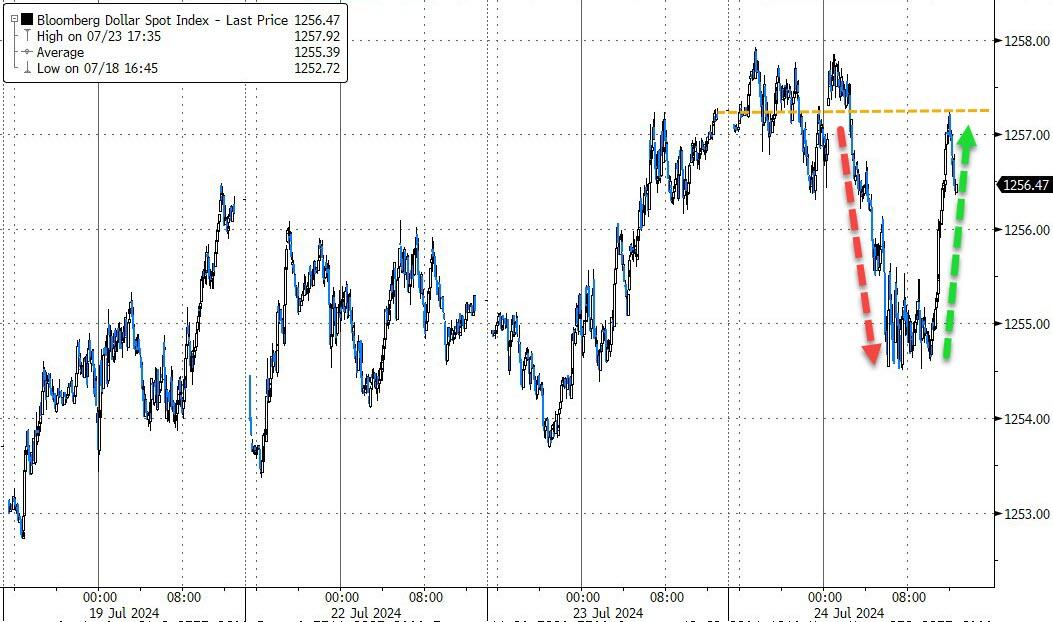
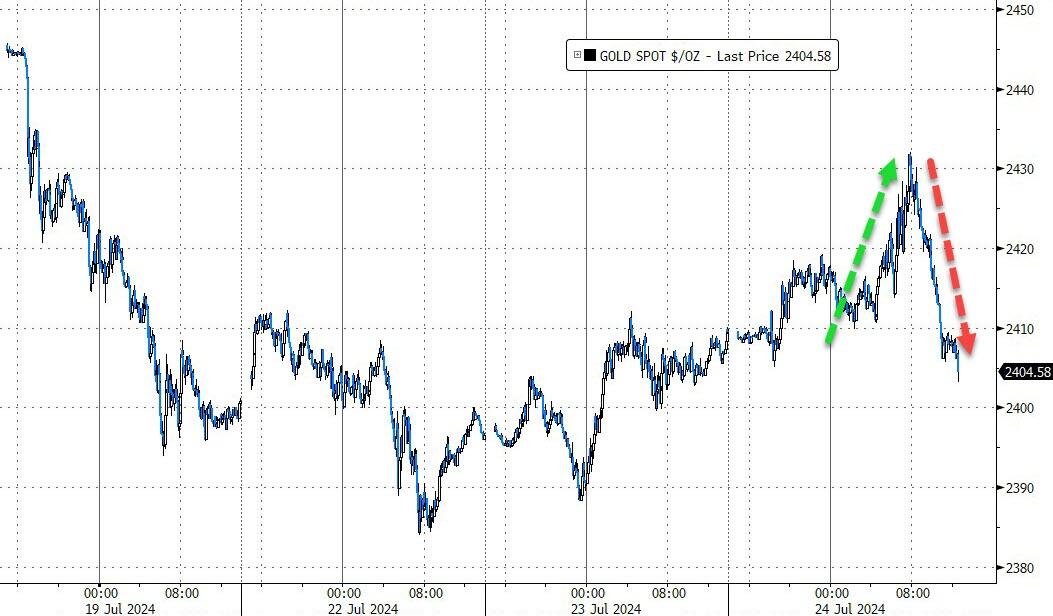
Further compounding the negative sentiment were new home sales for June, which came in lighter than anticipated, with the year-to-date number now at -7.4%. Despite the equity sell-off, bond yields rose, the dollar whipsawed but ended the session unchanged, and gold mirrored the currency’s movement but closed modestly lower.

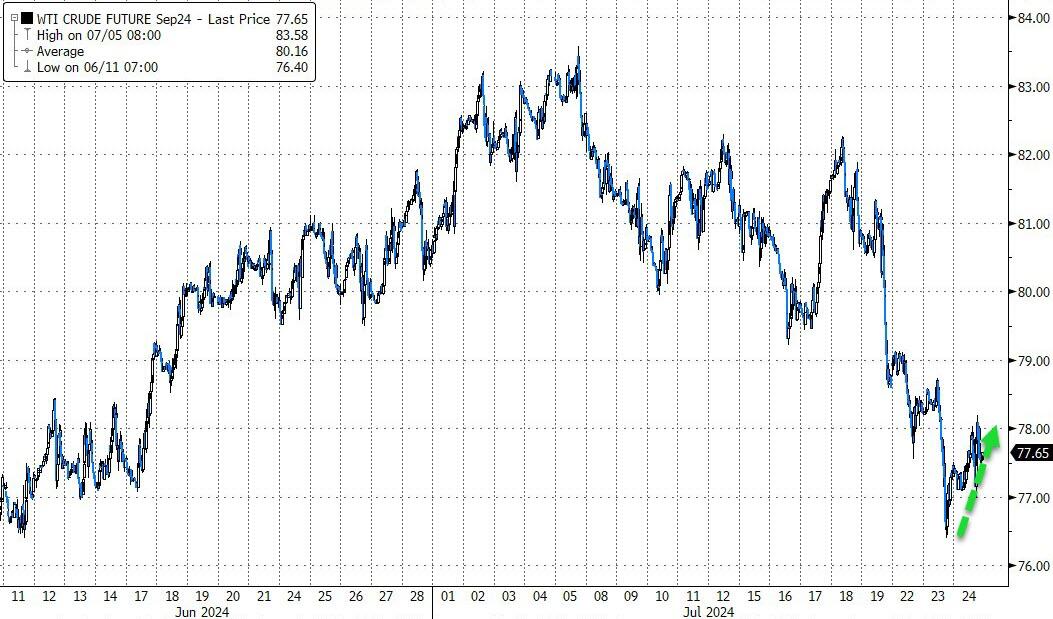
Crude oil prices meandered higher but remained near their six-week lows. Only Bitcoin defied the bearish trend by closing up slightly.

Today’s sharp and broad correction raises an important question:

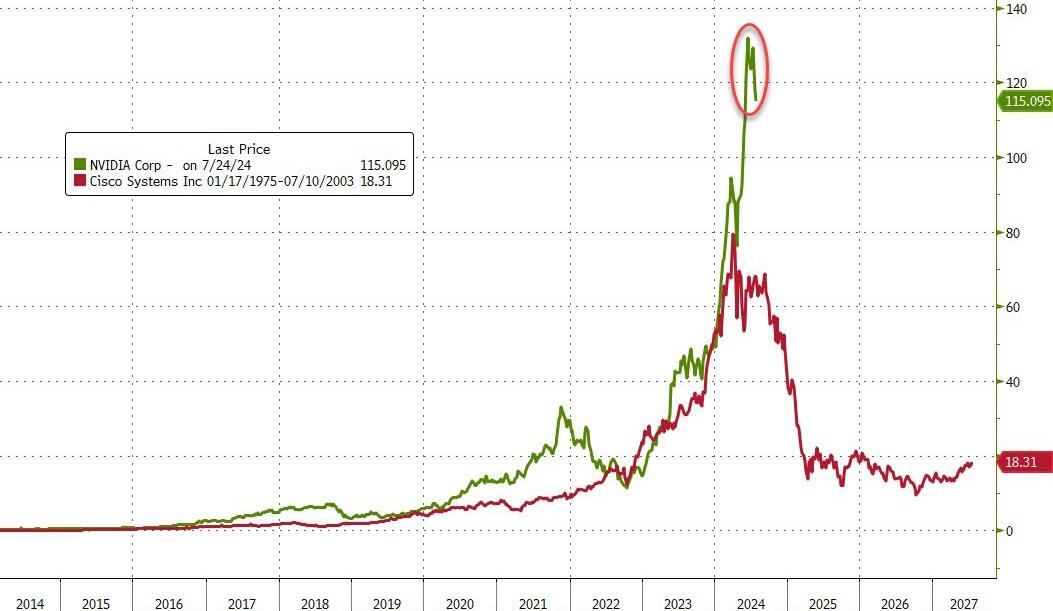
Is the comparison between Cisco Systems and Nvidia still valid?

Read More

Bears Prevail As Major Indexes Dip Despite Earnings Anticipation

Ulli Market Commentary Contact

[Chart courtesy of MarketWatch.com]

  1. Moving the market

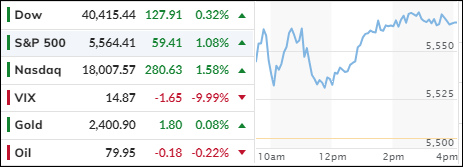
The major indexes maintained yesterday’s upward momentum as we entered today’s session, buoyed by the anticipation of earnings reports from larger companies. However, by the end of the day, the bears prevailed, causing a slight dip into the red.

Upcoming earnings reports from tech giants like Alphabet and Tesla are highly anticipated, offering traders an early glimpse into the sector’s second-quarter performance. Currently, the focus is on earnings season, with traders scrutinizing numerous reports from both the US and Europe.

General Motors exceeded expectations with its results, yet its shares fell by 4%. Conversely, UPS missed both top and bottom-line estimates, resulting in a 12% drop in its stock. Despite these mixed outcomes, 80% of the S&P 500 companies that have reported so far have surpassed expectations.

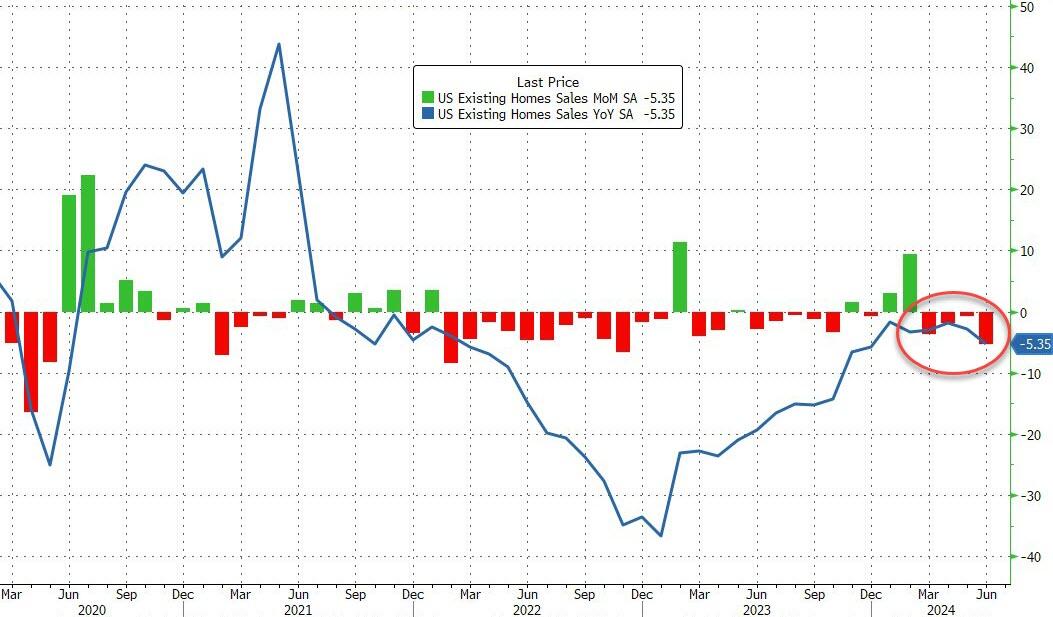
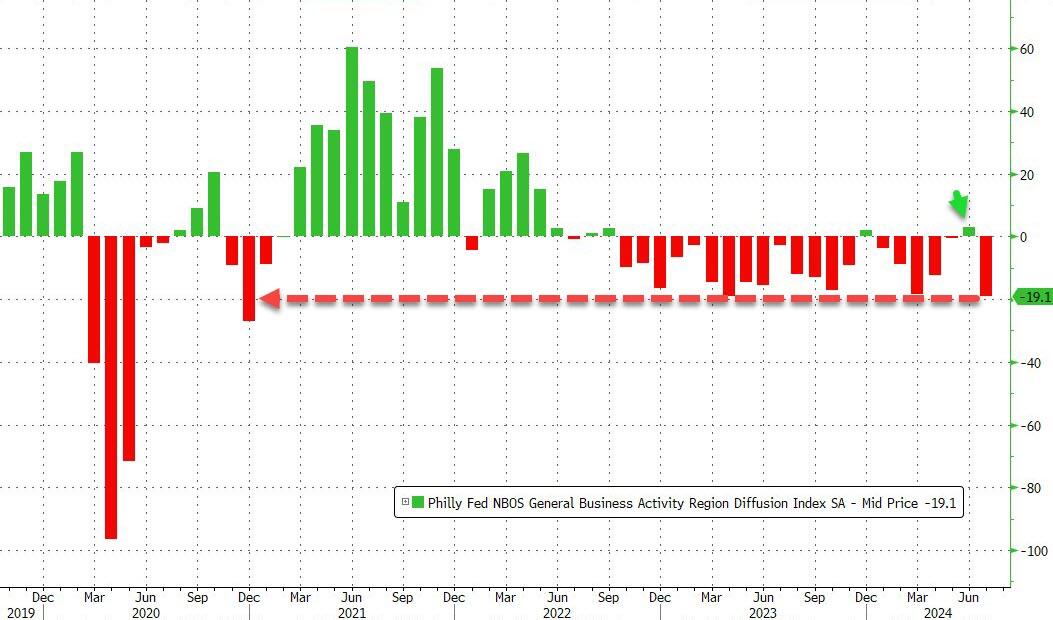
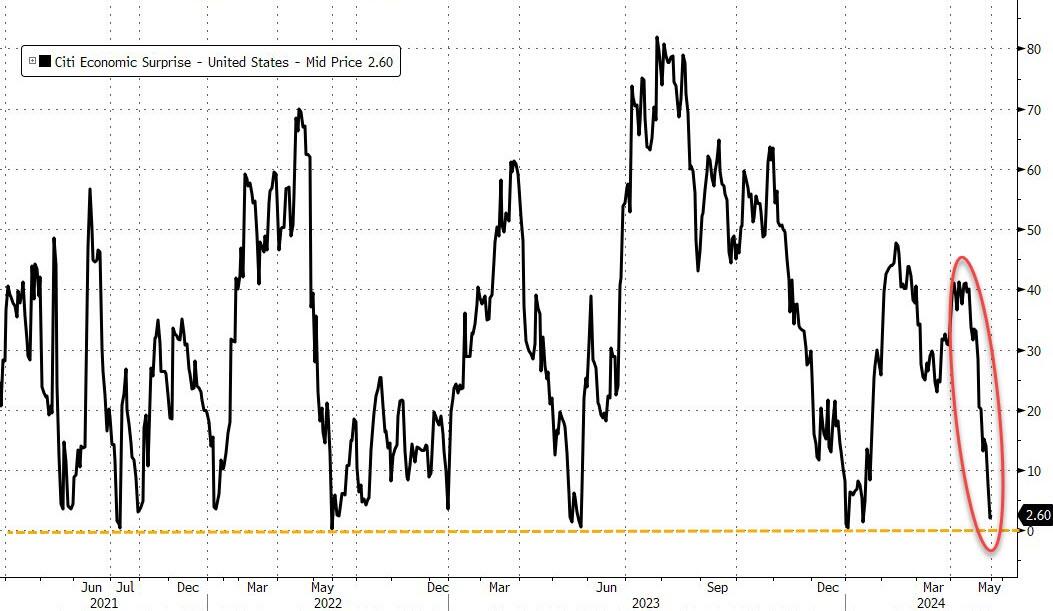
On the economic front, it was a challenging day. Existing home sales in June were worse than expected and have not increased year-over-year since July 2021. Additionally, the Federal Reserve surveys plummeted to near four-year lows in July, further dragging down the Economic Surprise Index.

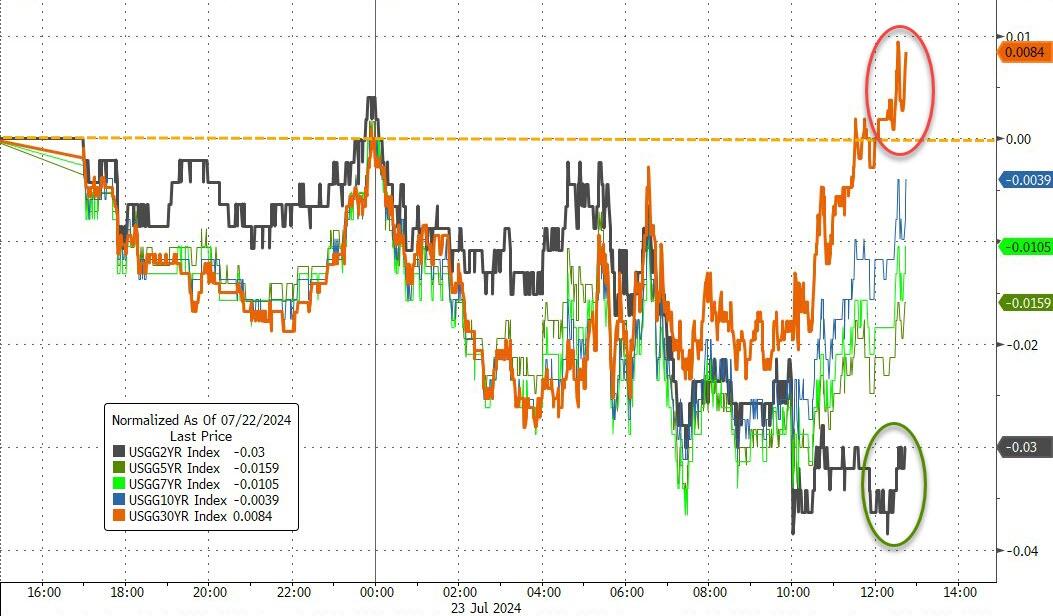
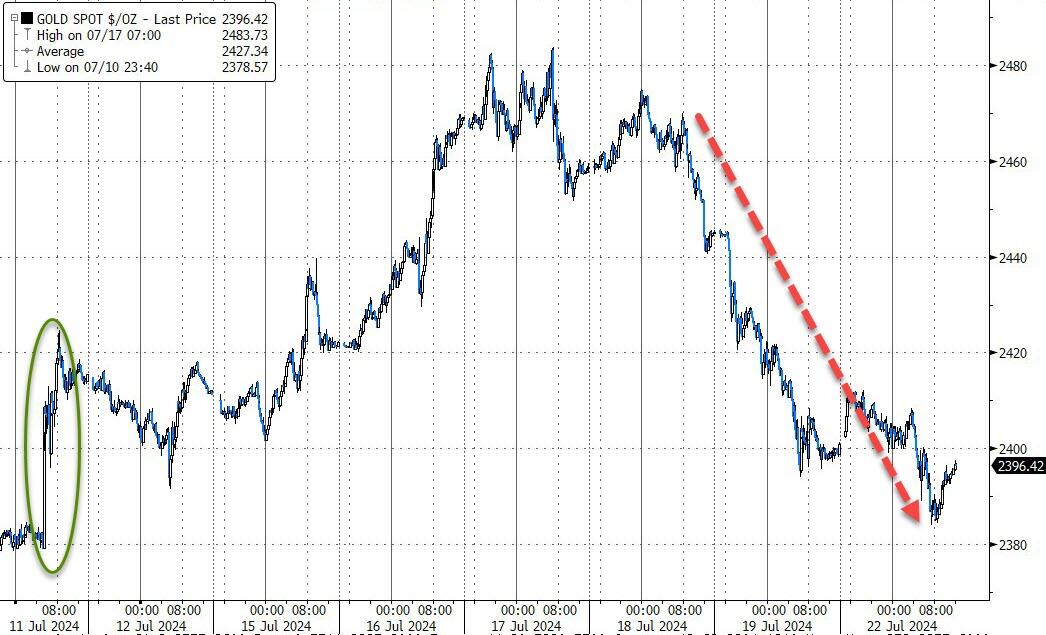
The MAG7 stocks remained stagnant, bond yields were mixed, and Bitcoin relinquished some of its recent gains. Gold managed to achieve modest gains, breaking back above $2,400, while crude oil fell below the $80 mark.

Traders are clearly focused on the upcoming major earnings announcements, which could spark bullish sentiment if the results exceed expectations.

Read More
Tech Sector Rebounds, Lifts Major Indexes

Ulli Market Commentary Contact

[Chart courtesy of MarketWatch.com]

  1. Moving the market

This morning, the tech sector regained some footing after a recent decline, helping to lift the major indexes. Nvidia led the charge with a 4% gain, recovering some of its losses from last week, followed by Meta, Alphabet, and Apple.

Traders are navigating a complex landscape, with factors ranging from Biden’s withdrawal to earnings reports, and central bank policies. The probability of the Federal Reserve cutting rates at their September meeting has now increased to 93%.

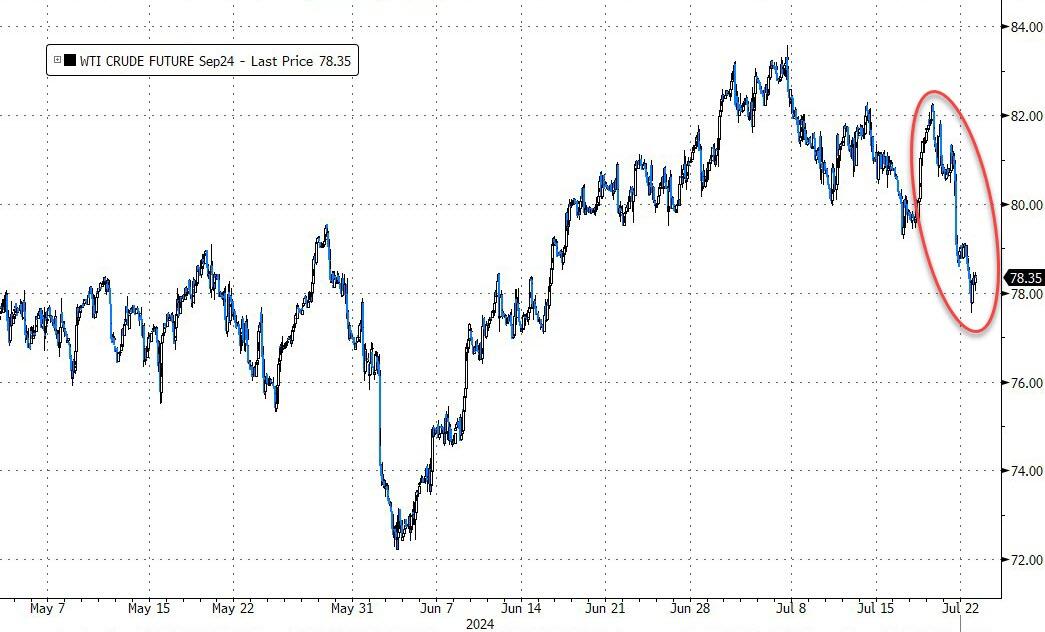
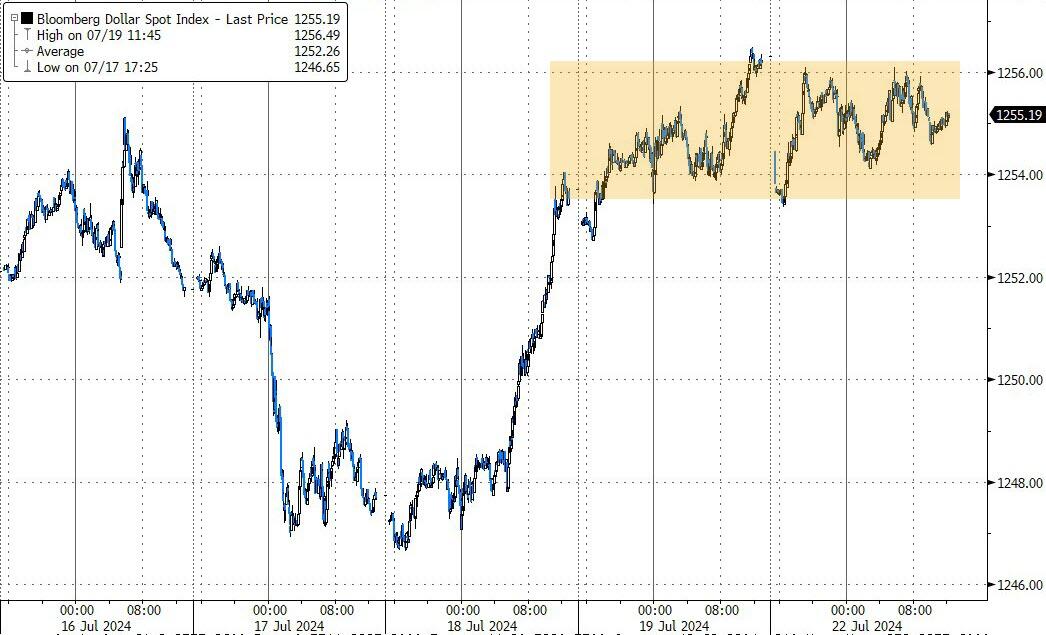
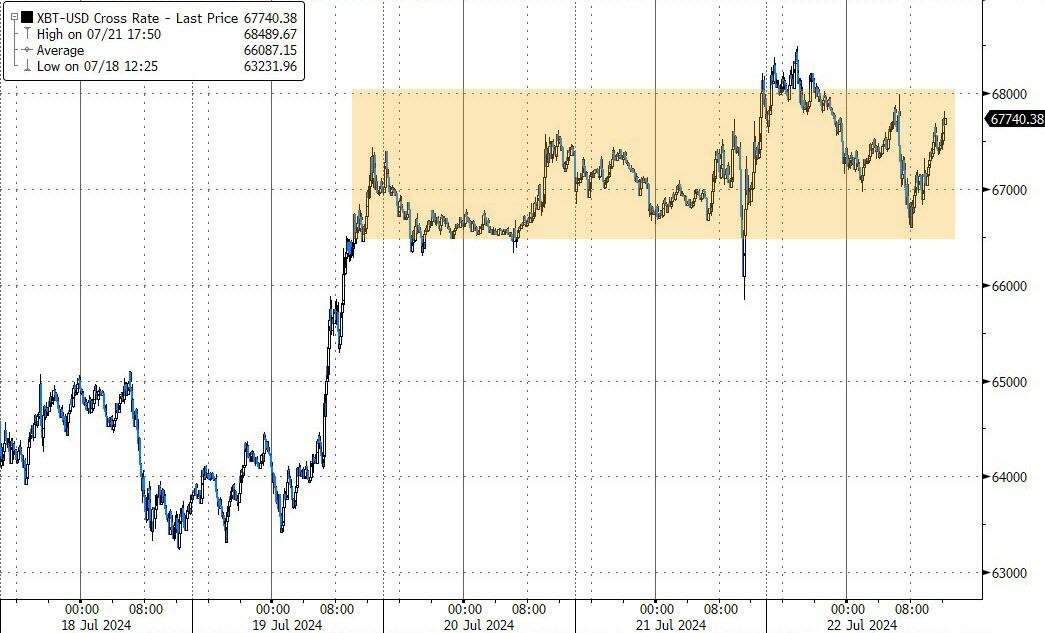
Outside of stocks, the markets were relatively calm. Gold drifted lower, the dollar remained stable, Bitcoin traded within its $67k to $68k range, crude oil slipped below the $80 mark, and bond yields rose moderately.

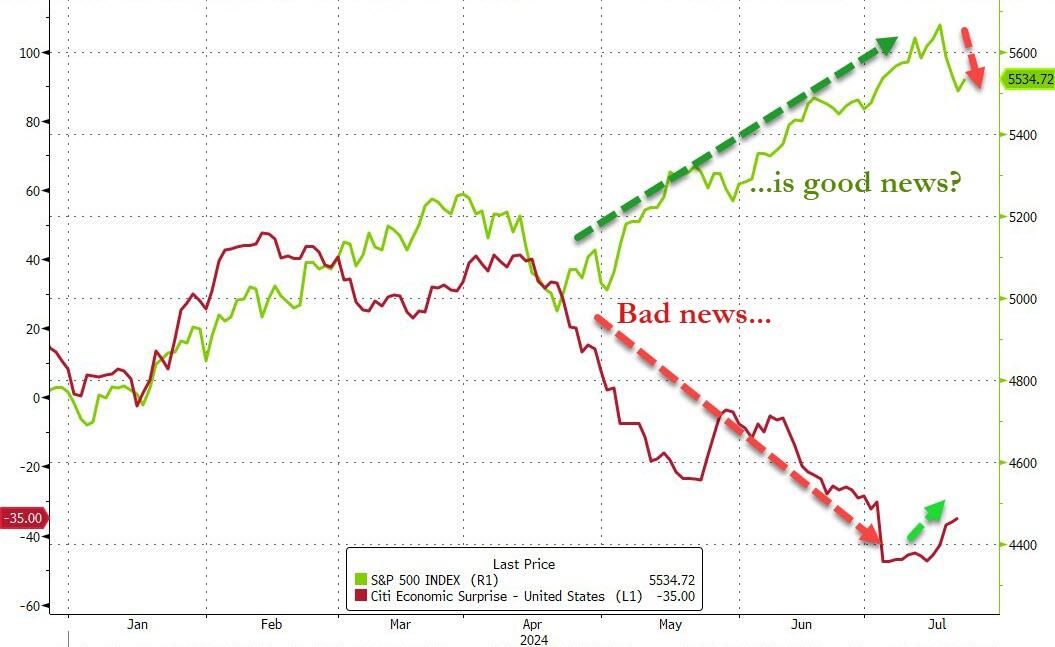
The economy appears to be slowing down, but as we’ve seen before, “bad news can be good news” for the markets.

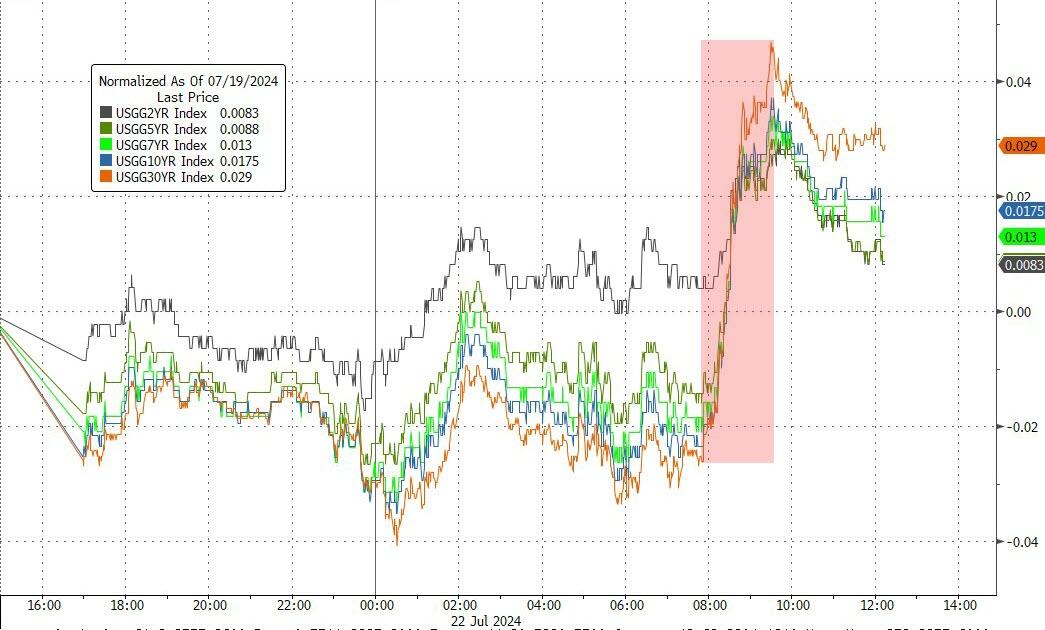
However, this trend could reverse at any time, as illustrated by ZH’s chart.

Read More
ETFs On The Cutline – Updated Through 07/19/2024

Ulli ETFs on the Cutline Contact

Do you want to know which ETFs are hot and which ones are not? Then you need my High-Volume ETF Cutline report. It tells you how close or far each of the 311 ETFs I follow is from its long-term trend line (39-week SMA). These are the ETFs that trade more than $5 million a day, so they are not some obscure funds that nobody cares about.

The report is split into two parts: The winners that are above their trend line (%M/A), and the losers that are below it. The yellow line is the line of shame that separates them. You can see how many ETFs are in each group and how they have changed since the last report (283 vs. 276 current).

Take a peek:

The HV ETF Master Cutline Report

If you are confused by some of the terms we use, don’t panic. I have a helpful Glossary of Terms for you.

If you want to learn more about the Cutline method and how it can make you rich (or at least less poor), read my original post here.