Do you want to know which ETFs are hot and which ones are not? Then you need my High-Volume ETF Cutline report. It tells you how close or far each of the 311 ETFs I follow is from its long-term trend line (39-week SMA). These are the ETFs that trade more than $5 million a day, so they are not some obscure funds that nobody cares about.
The report is split into two parts: The winners that are above their trend line (%M/A), and the losers that are below it. The yellow line is the line of shame that separates them. You can see how many ETFs are in each group and how they have changed since the last report (246 vs. 260 current).
GOLD OUTSHINES S&P 500 YTD AS TRADERS EYE FED’S NEXT MOVE
[Chart courtesy of MarketWatch.com]
Moving the market
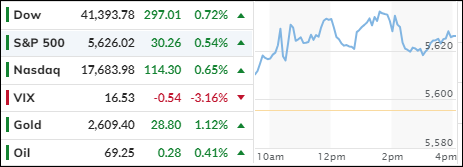
Despite the S&P 500 still being down for the month, it just completed a five-day winning streak, recovering most of the early September losses. The index gained over 4% this week, with the Dow and Nasdaq also making significant comebacks.
Traders are now turning their attention to next week’s Federal Reserve meeting, which concludes on Wednesday. The Central Bank is expected to cut rates by 0.25%, reducing the current target rate of 5.25%. The question remains whether the market will follow the adage “buy the rumor, sell the news” after the emotional buildup leading to this event.
While Wall Street exudes optimism about inflation and the economy, the reality appears starkly different. Store closures, record bankruptcies, and layoffs paint a grim picture, with consumers grappling with high credit card debt and low savings amid rising prices.
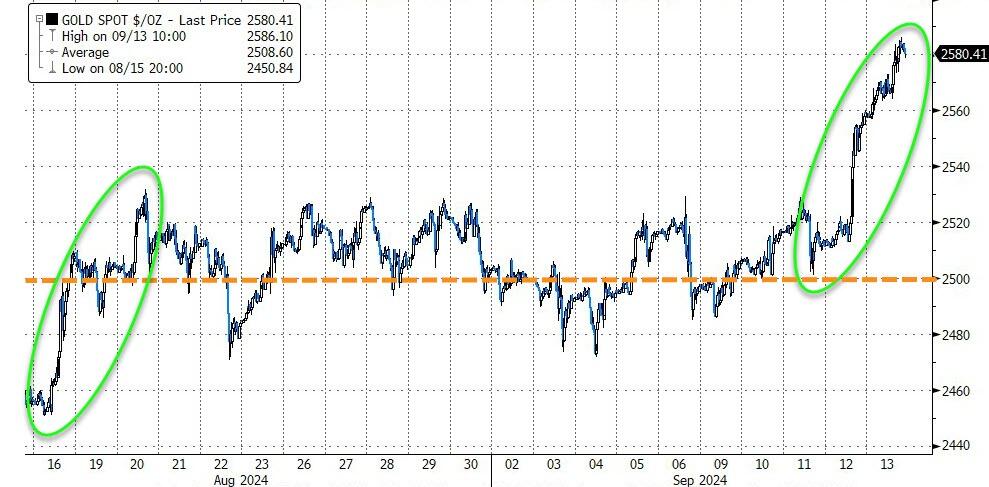
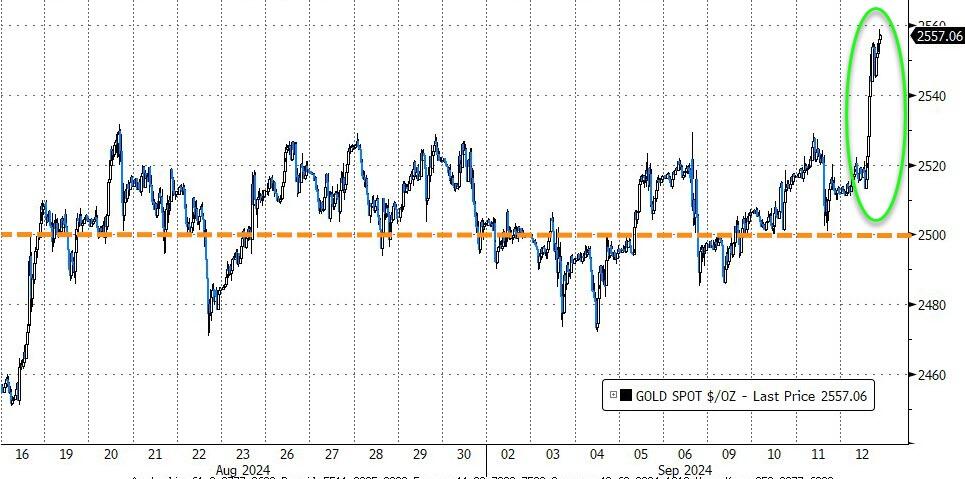
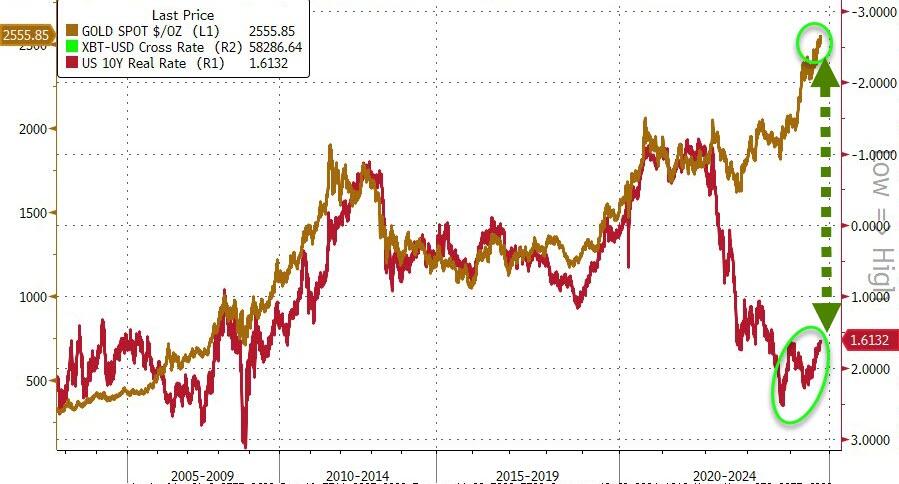
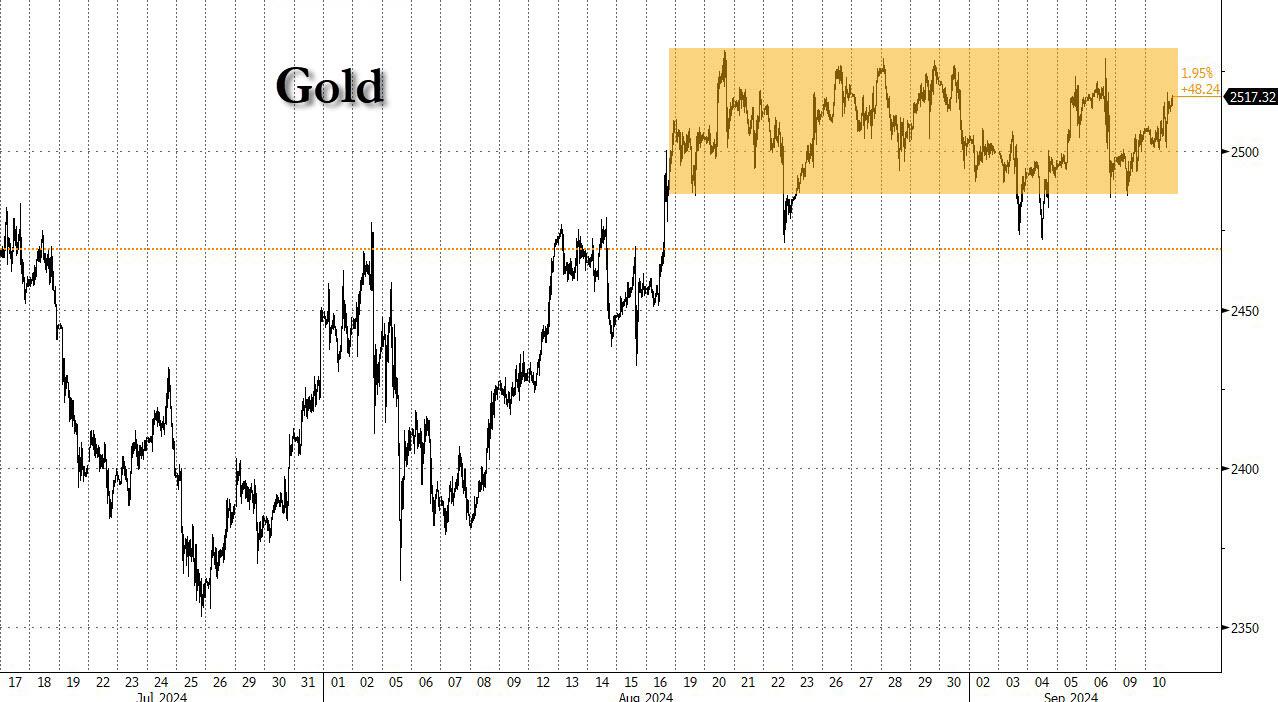
In my view, any rate reduction signals the Fed’s attempt to “save” the economy, which could further fuel inflationary trends. This is evidenced by the rising gold prices, which have outperformed the S&P 500 year-to-date by a substantial margin (24.85% vs. 18.24%).
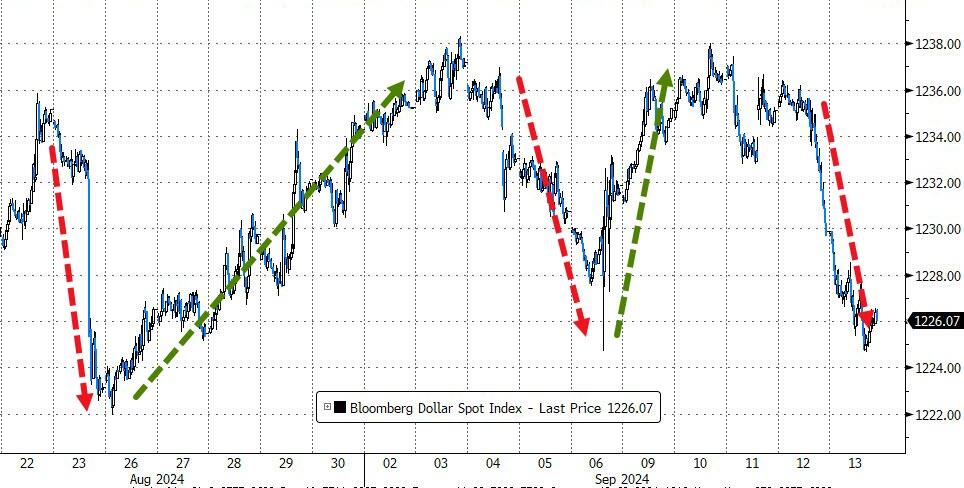
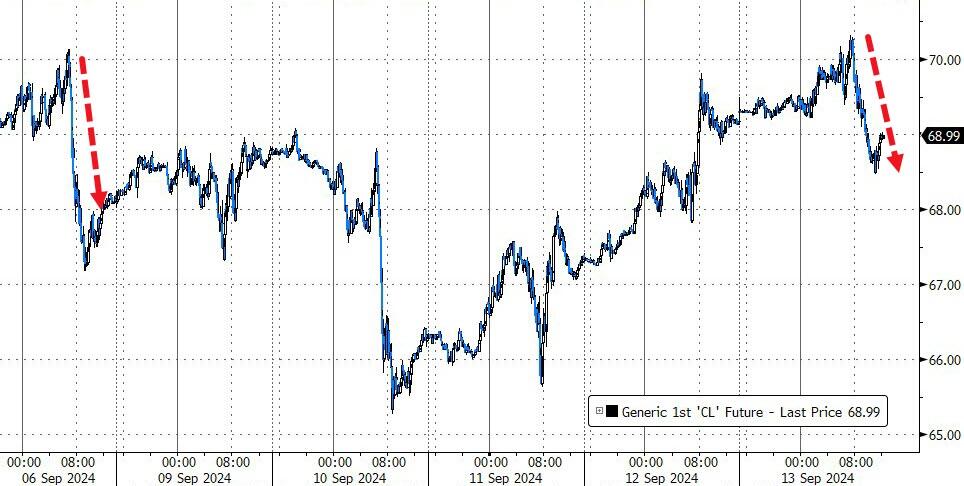
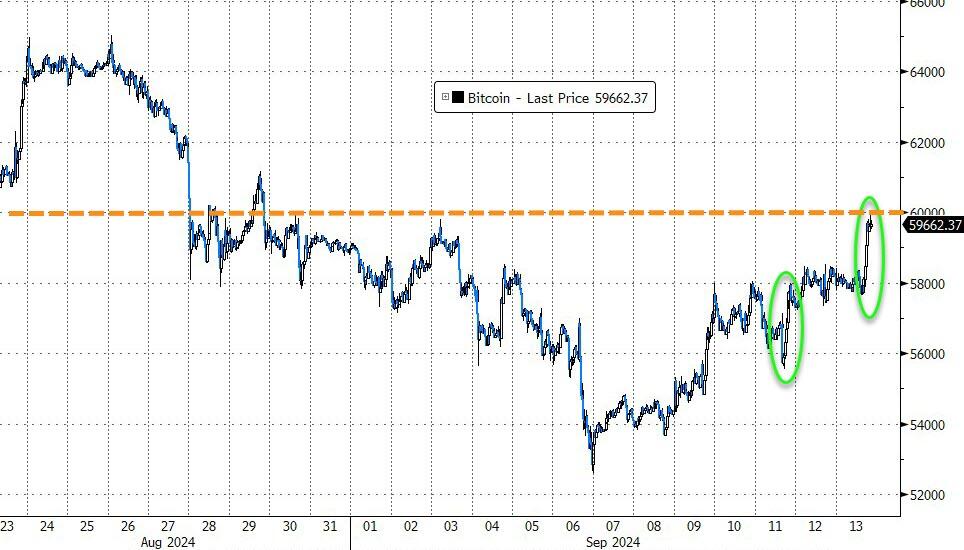
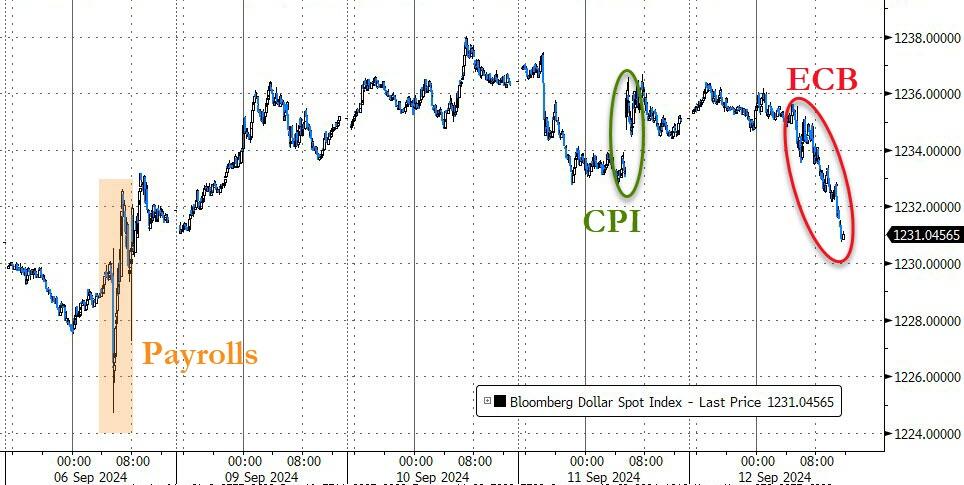
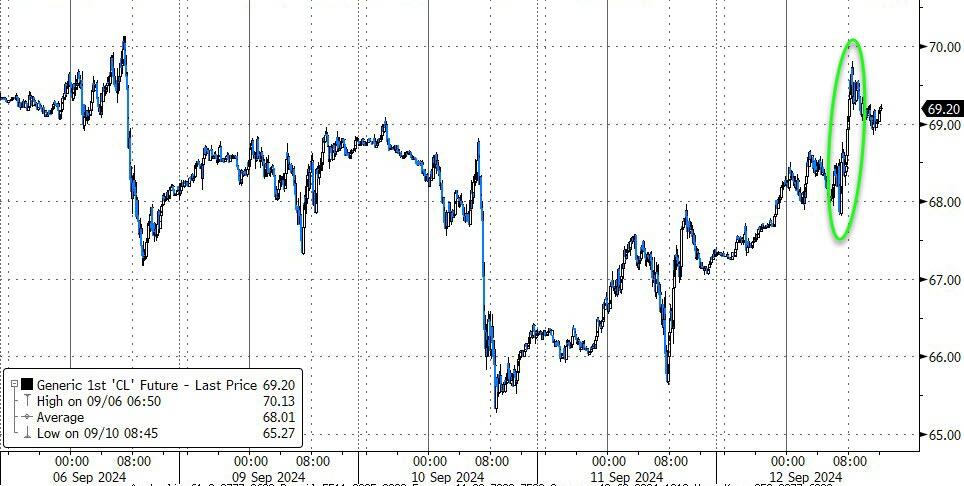
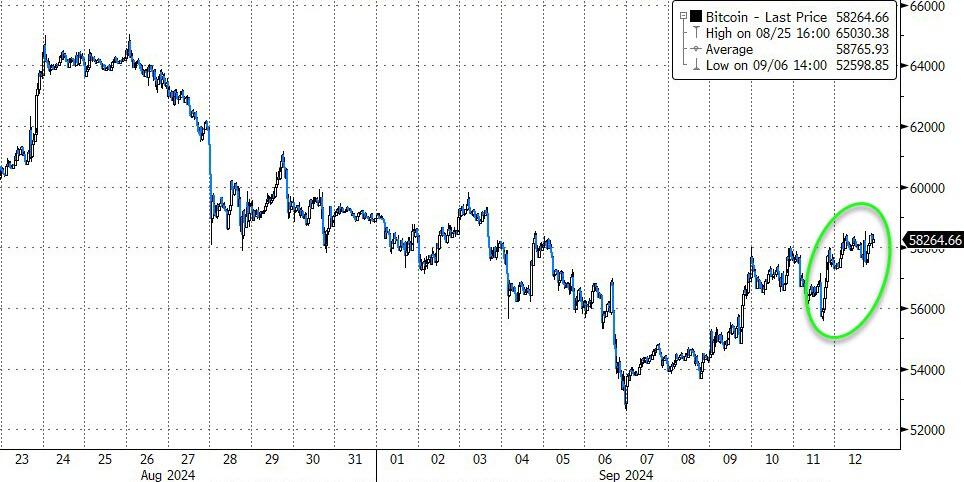
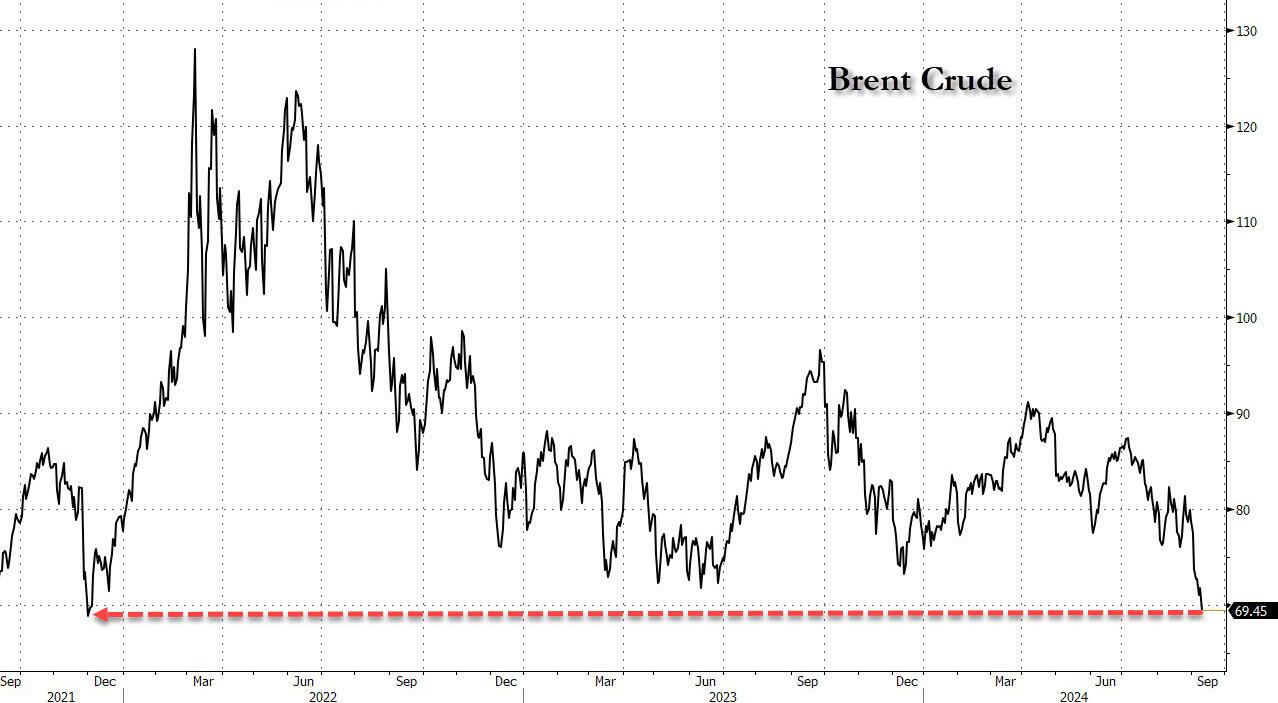
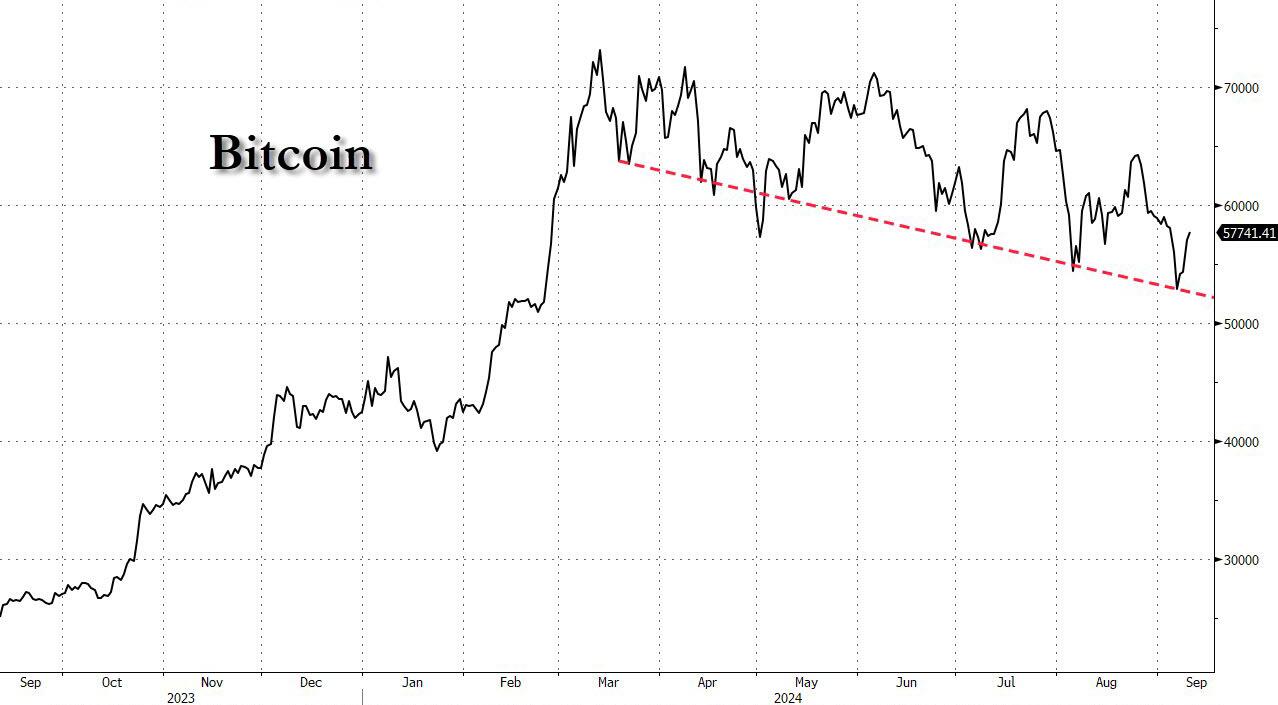
The dollar suffered its sixth down week out of seven, boosting gold to a new record high and its best week in five months. Oil prices dropped today but rose for the week, while Bitcoin surged to its best week in two months, touching the $60k level.
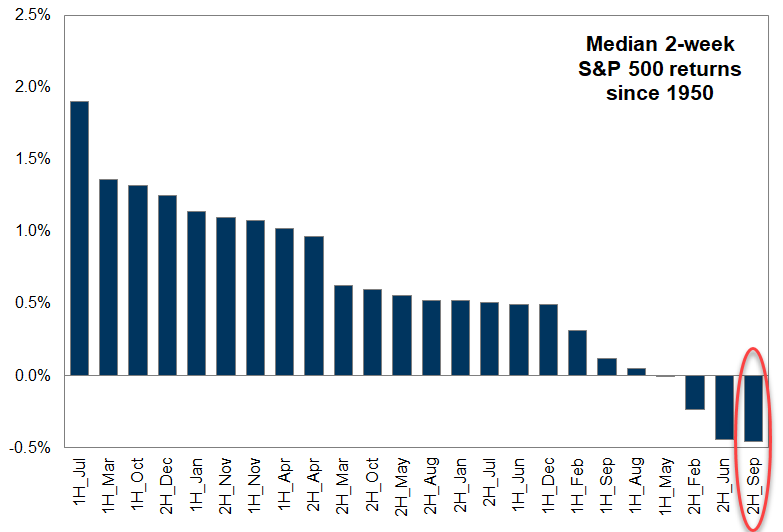
Traders were almost giddy about this week’s comeback, but it remains to be seen if Fed Chair Powell’s anticipated rate cut can overcome seasonal tendencies, which suggest we are entering the market’s worst two-week period of the year.
ETF Data updated through Thursday, September 12, 2024
How to use this StatSheet:
Out of the 1,800+ ETFs out there, I only pick the ones that trade over $5 million per day (HV ETFs), so you don’t get stuck with a lemon that nobody wants to buy or sell.
Trend Tracking Indexes (TTIs)
These are the main indicators that tell you when to buy or sell Domestic and International ETFs (section 1 and 2). They do that by comparing their position to their long-term M/A (Moving Average). If they cross above, and stay there, it’s a green light to buy. If they fall below, and keep going, it’s a red light to sell. And to make sure you don’t lose your shirt if things go south, I also use a 12% trailing stop loss on all positions in these categories.
All other investment areas don’t have a TTI and should be traded based on the position of each ETF relative to its own trend line (%M/A). That’s why I call them “Selective Buy.” In other words, if an ETF goes above its own trend line, you can buy it. But don’t forget to use a trailing sell stop of 12%, or less if you’re feeling nervous.
If some of these words sound like Greek to you, please check out the Glossary of Terms and new subscriber information in section 9.
DOMESTIC EQUITY ETFs: BUY— since 11/21/2023
Click on chart to enlarge
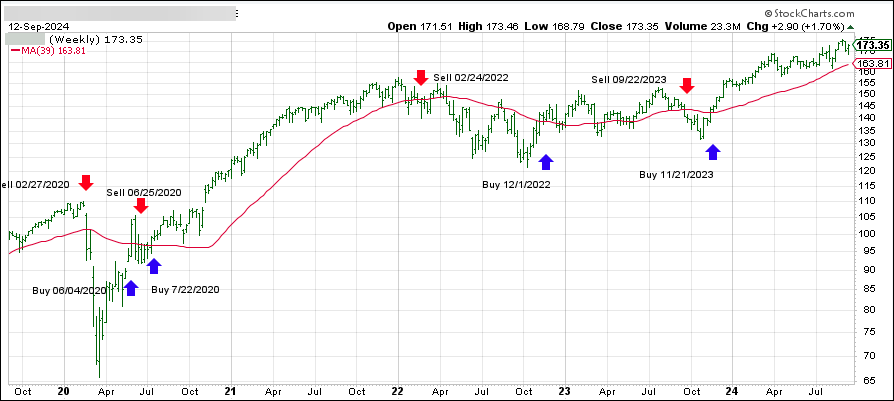
This is our main compass, the Domestic Trend Tracking Index (TTI-green line in the above chart). It has broken above its long-term trend line (red) by +6.13% and is in “Buy” mode as posted.
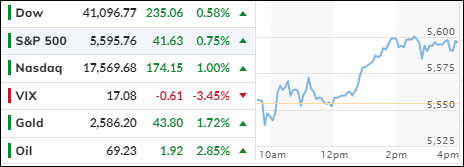
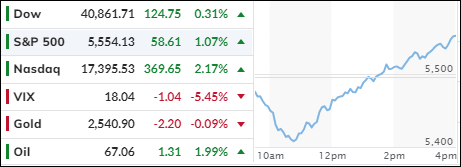
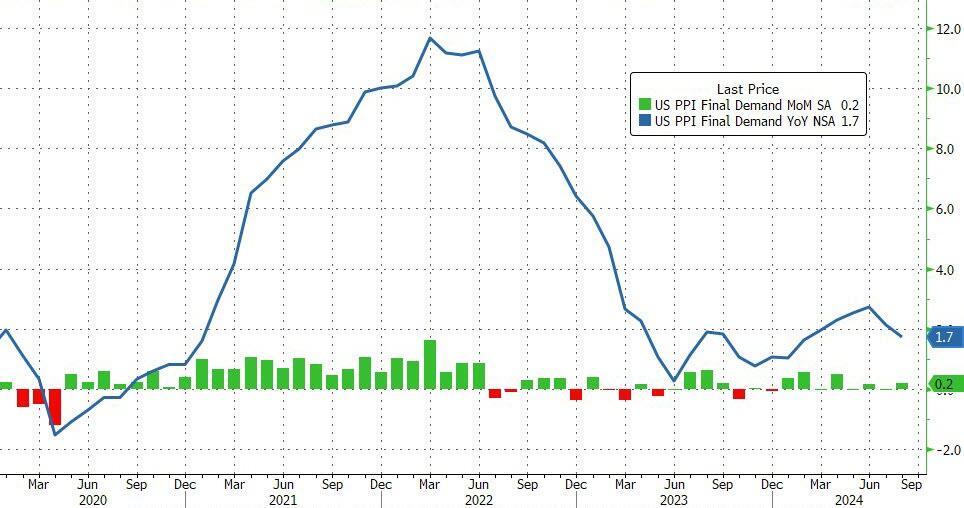
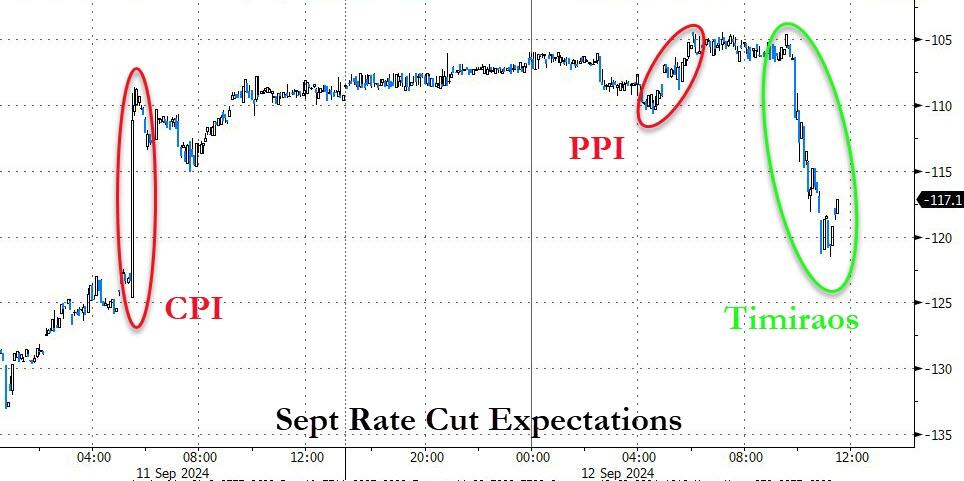
The major indexes initially opened lower but quickly rebounded, as traders ignored the latest Producer Price Index (PPI) report, which showed a 0.2% increase in wholesale prices for August, aligning with expectations.
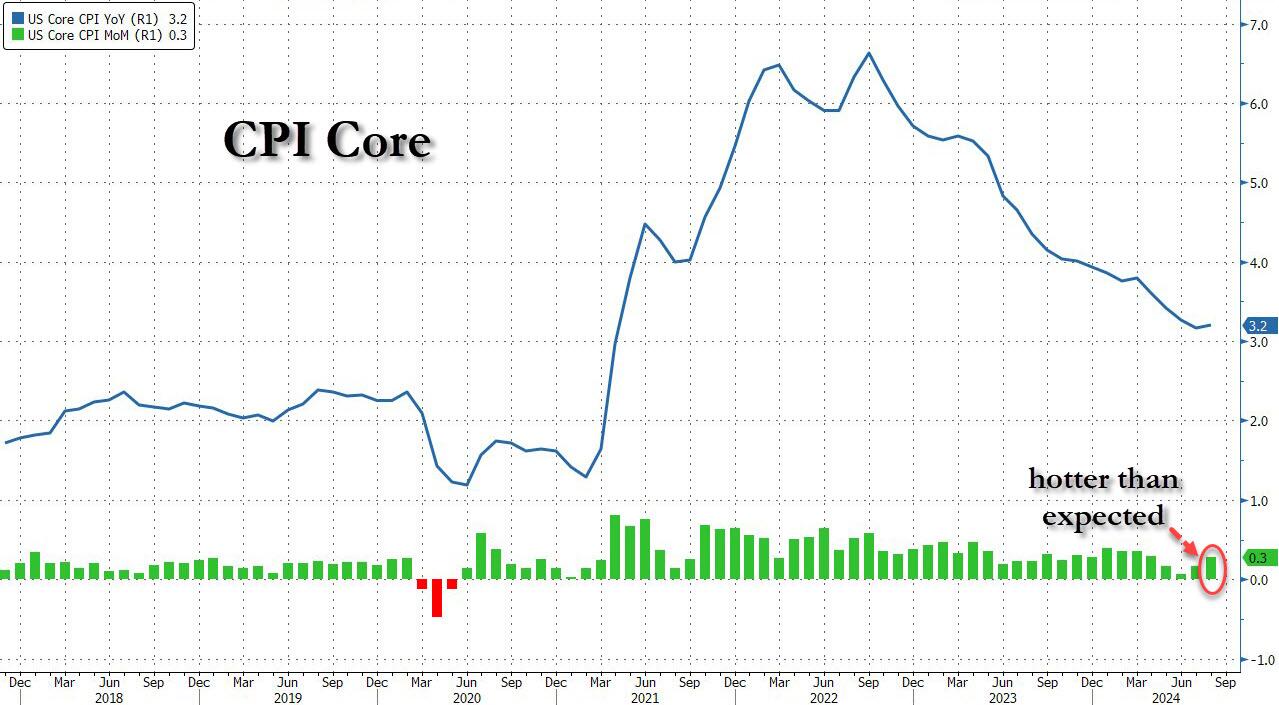
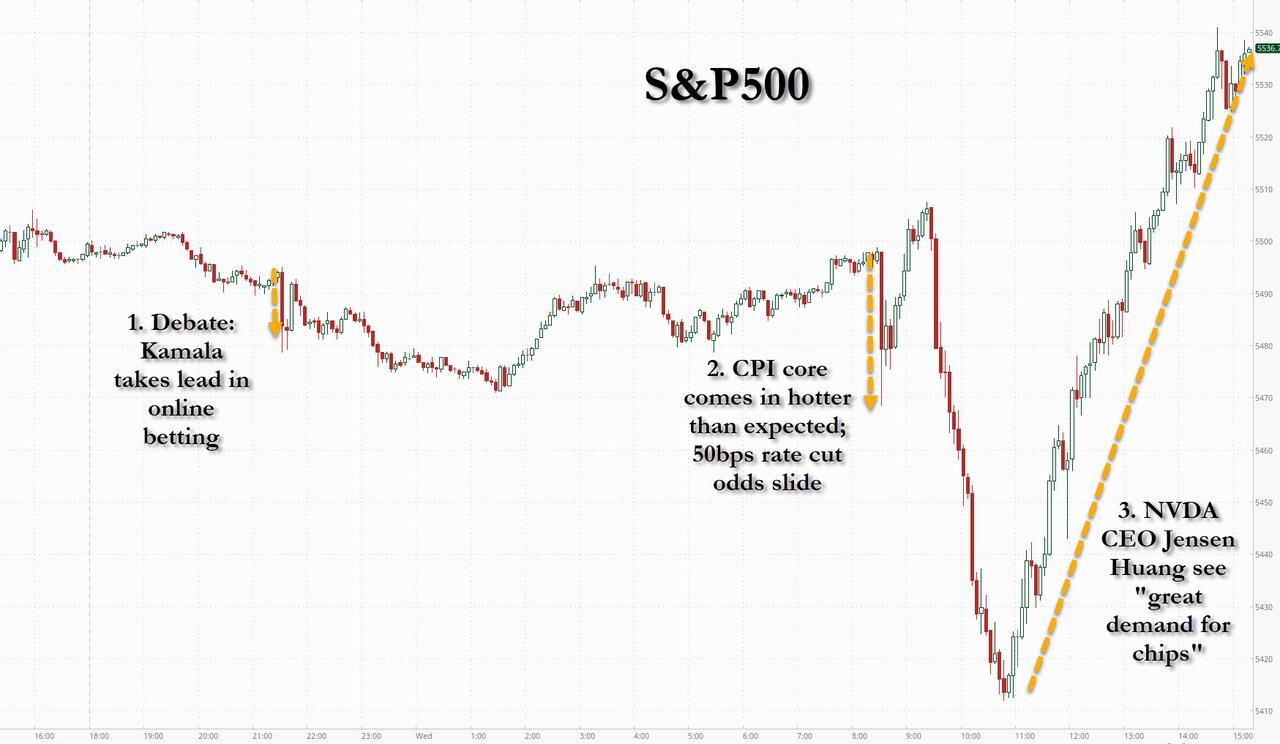
This followed the previous day’s Consumer Price Index (CPI) report, which indicated a rise in core prices, excluding the volatile energy and food categories. While I find this exclusion impractical, it has led to speculation that the Federal Reserve is more likely to cut rates by 0.25% next week, rather than the anticipated 0.5%.
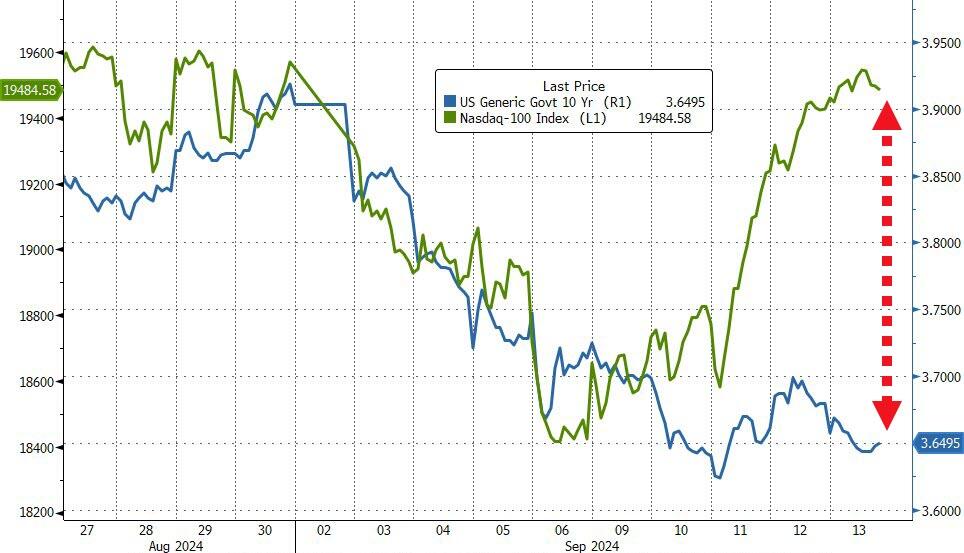
Leading the charge was the Nasdaq, buoyed by gains in mega-cap tech stocks such as Nvidia, Alphabet, and Meta Platforms, which rose by 1.9%, 2.2%, and 2.7%, respectively. Weekly jobless claims increased modestly to 230,000.
Attention also turned to the European Central Bank (ECB), which cut rates by 0.25% while predicting slower growth and higher inflation—a classic case of stagflation. This shift in September rate cut expectations impacted the dollar, which declined, while gold surged by 1.7%, reaching a new high of $2,588.
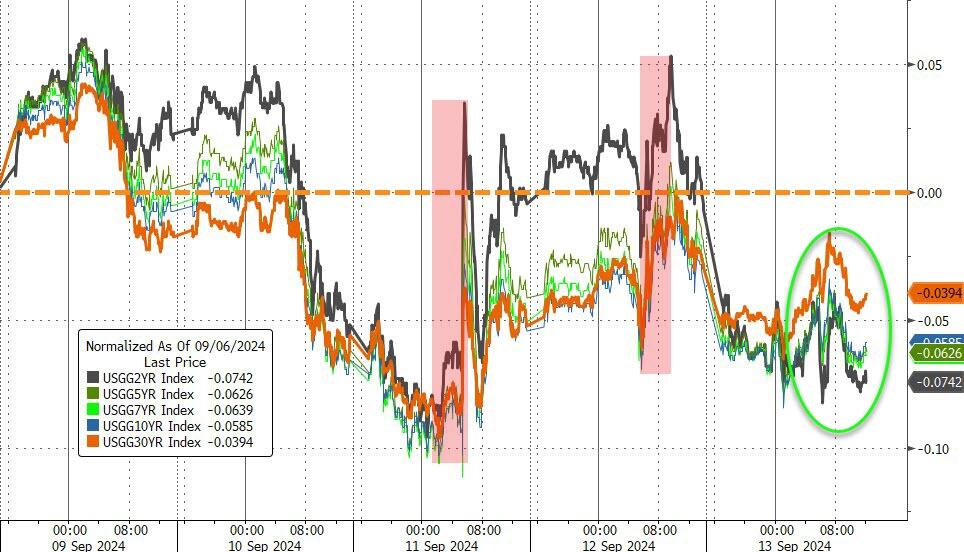
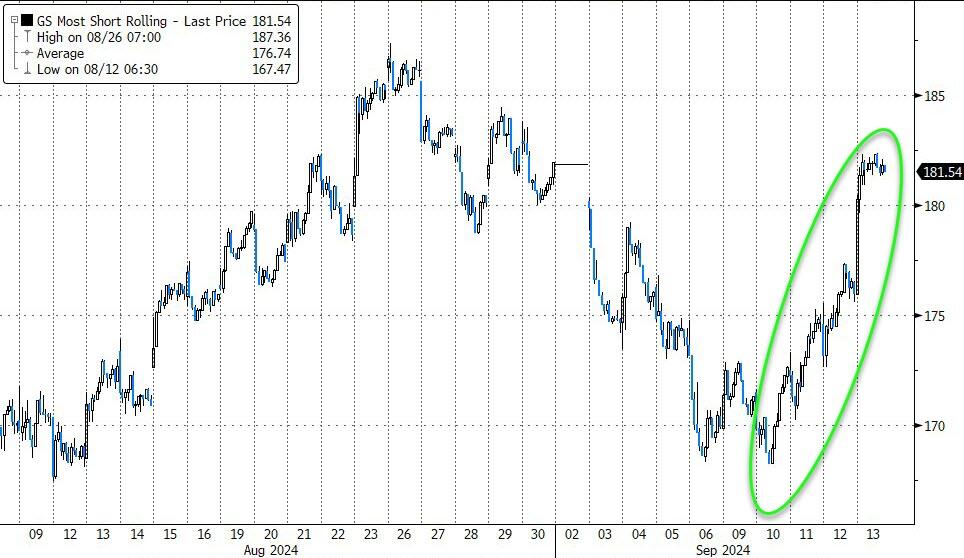
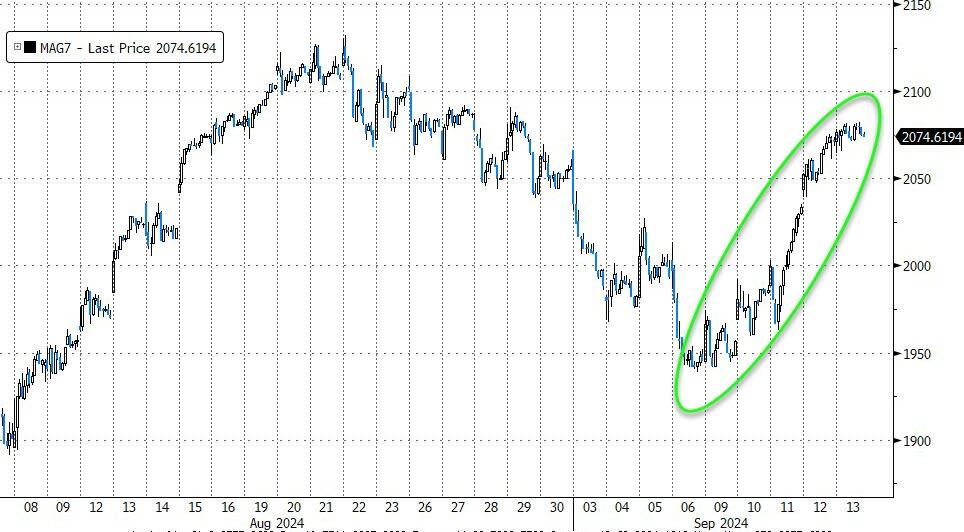
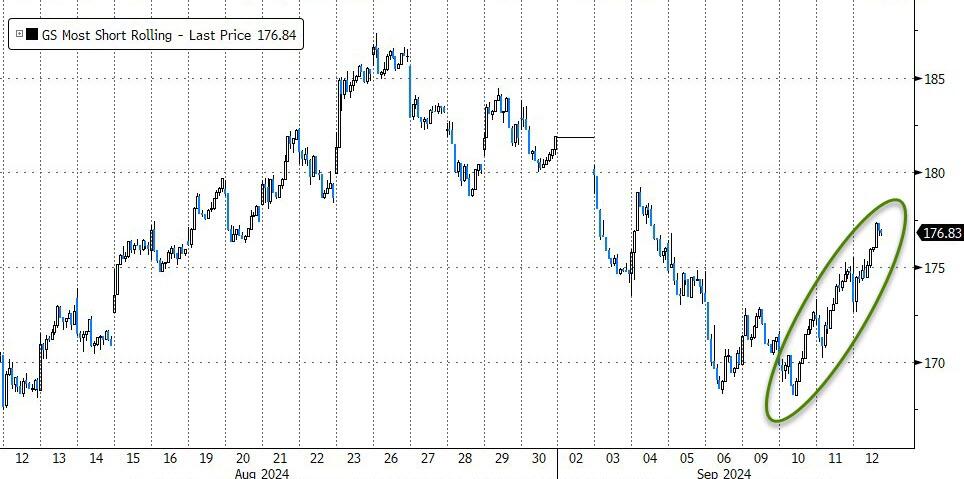
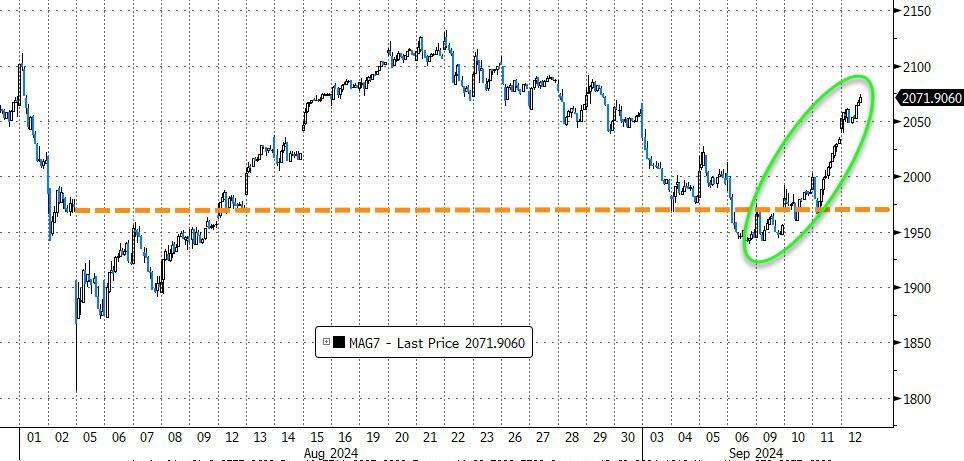
Meanwhile, the most shorted stocks experienced volatility, and the MAG7 basket continued its rebound. Bond yields edged higher but remained unchanged for the week. Oil prices also rose, and Bitcoin climbed back above the $58,000 level.
Early trading saw equities take another dive as the latest inflation data wreaked havoc on the markets.
However, following this significant downturn, a remarkable intraday recovery pushed the major indexes firmly into the green. This turnaround was largely driven by Nvidia’s CEO, who reassured investors by stating, “the demand for chips is so great, everyone wants to be first.”
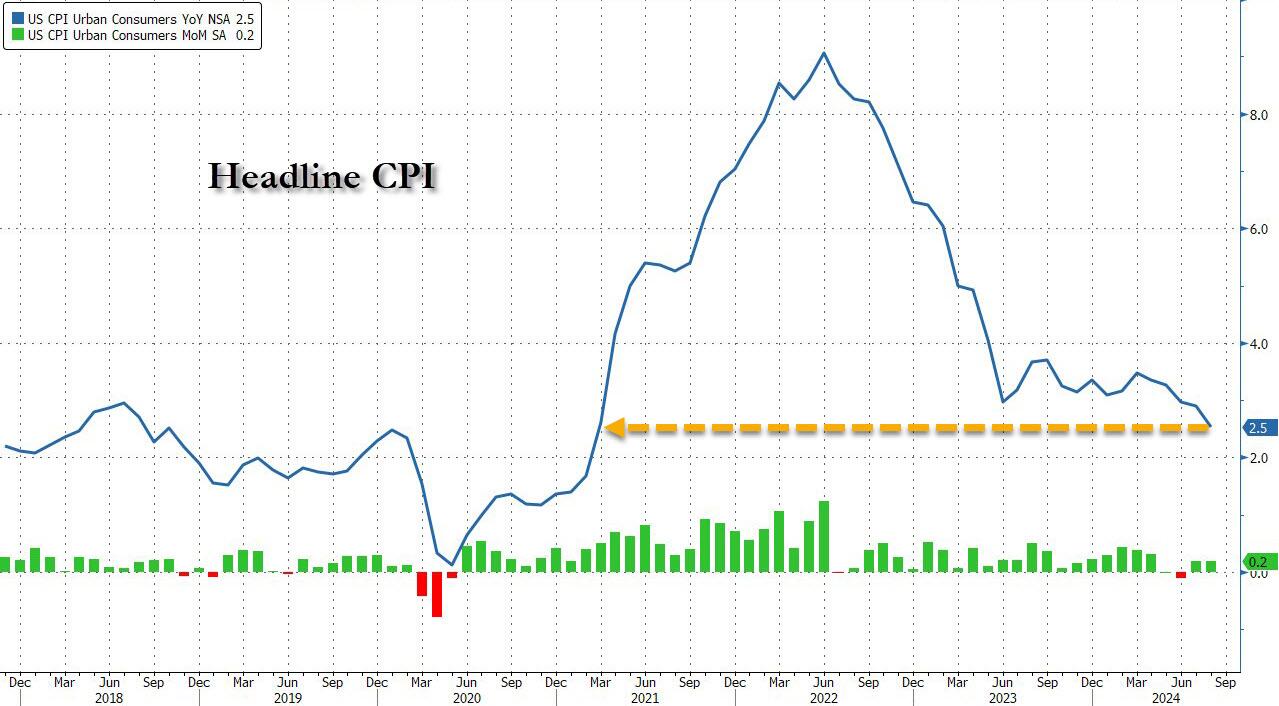
The latest headline Consumer Price Index (CPI) increased by 0.2% month-over-month, while the annual inflation rate fell from 2.9% to 2.5%, marking its lowest level since February 2021.
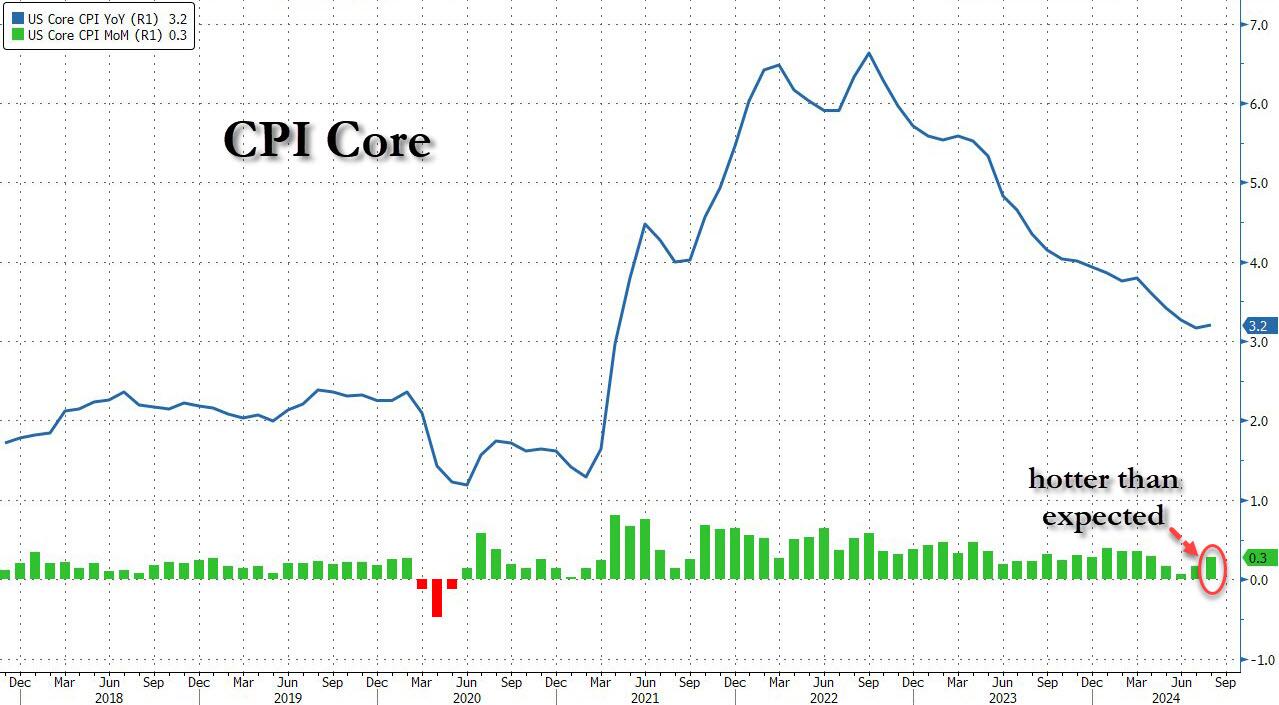
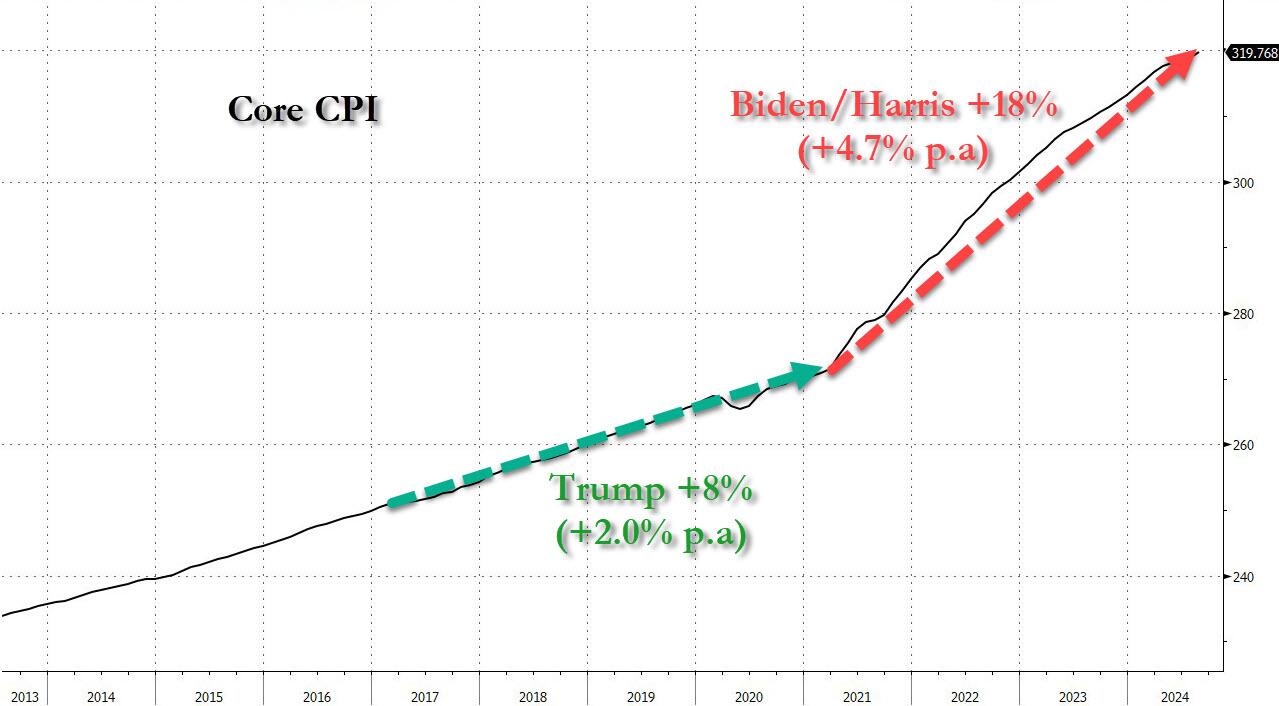
Although this was close to consensus estimates, the Core CPI, which excludes volatile food and energy prices, came in slightly worse than expected. According to ZH, this marked the 51st consecutive month of month-over-month increases in Core CPI, setting a record high.
This Core CPI figure is the one the Federal Reserve monitors most closely. Despite this, the odds of the Central Bank cutting rates by 0.25% remain at 85%.
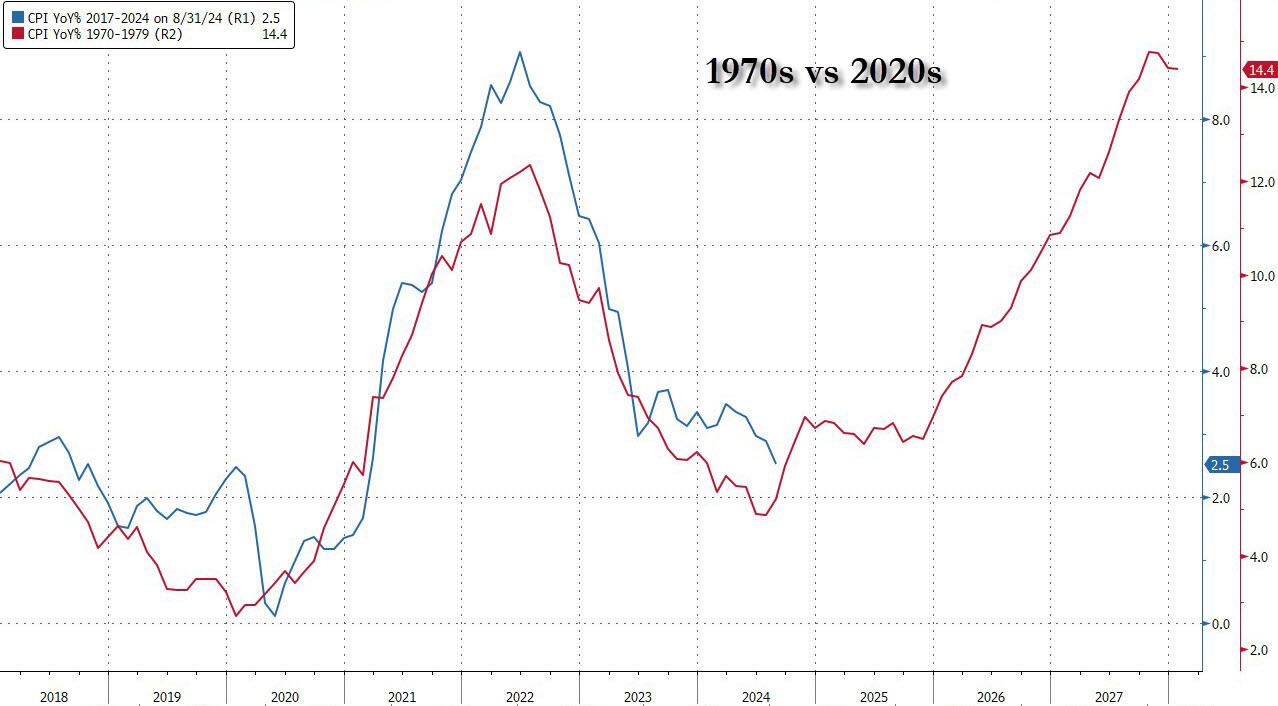
Historically, September has been one of the worst months for equities, particularly for the S&P 500, which has averaged a loss of more than 1% over the past decade. With headwinds such as worsening inflation, reminiscent of the 1970s, traders are likely to feel uneasy during this uncertain month as we head into 2025.
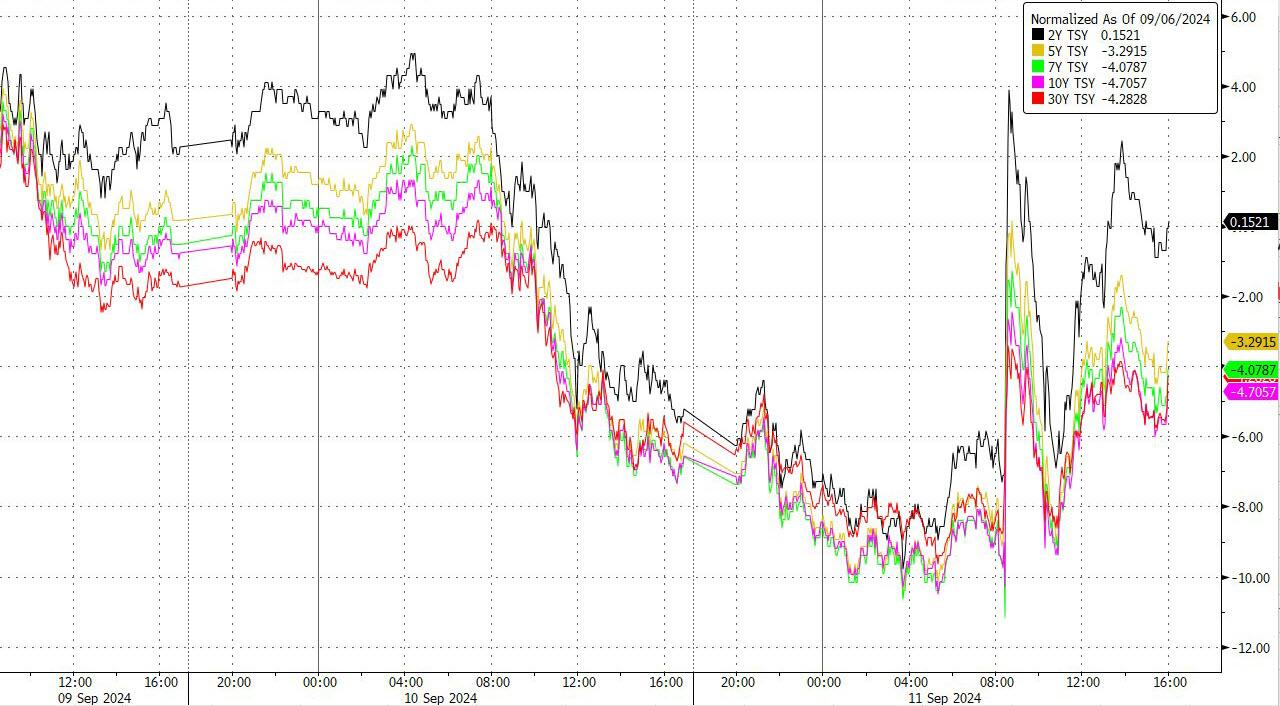
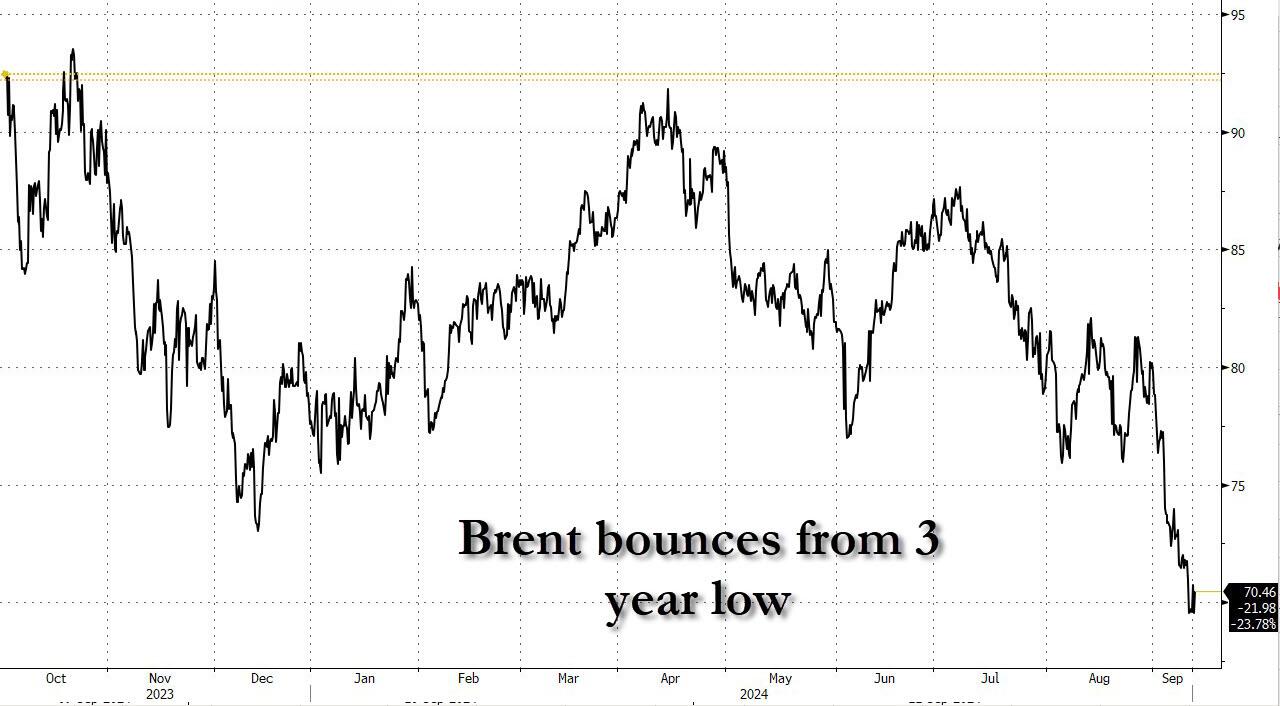
Bond yields experienced significant fluctuations, while crude oil managed to bounce back above the $67 level. Amidst this confusion on Wall Street, the pressing question remains:
Will we experience a soft landing, a hard landing, or no landing at all?
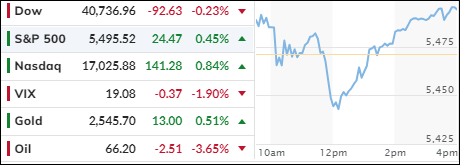
The markets suffered a tumultuous day, initially edging higher before collapsing precipitously, only to regain their footing and ending with another winning session. Among the three major indexes, only the S&P 500 and Nasdaq managed to close in the green after this roller coaster ride.
The tech sector has been struggling, with the XLK ETF losing about 7.5% this quarter. However, yesterday’s rebound helped to mitigate some of these losses. Traders are betting on the Federal Reserve to cut interest rates at their upcoming meeting, hoping this will aid the ailing economy. Spoiler alert: It likely won’t.
Tomorrow’s Consumer Price Index (CPI) and Thursday’s Producer Price Index (PPI) could ignite the markets, unless the numbers come in higher than expected, in which case other asset classes like gold and commodities might benefit.
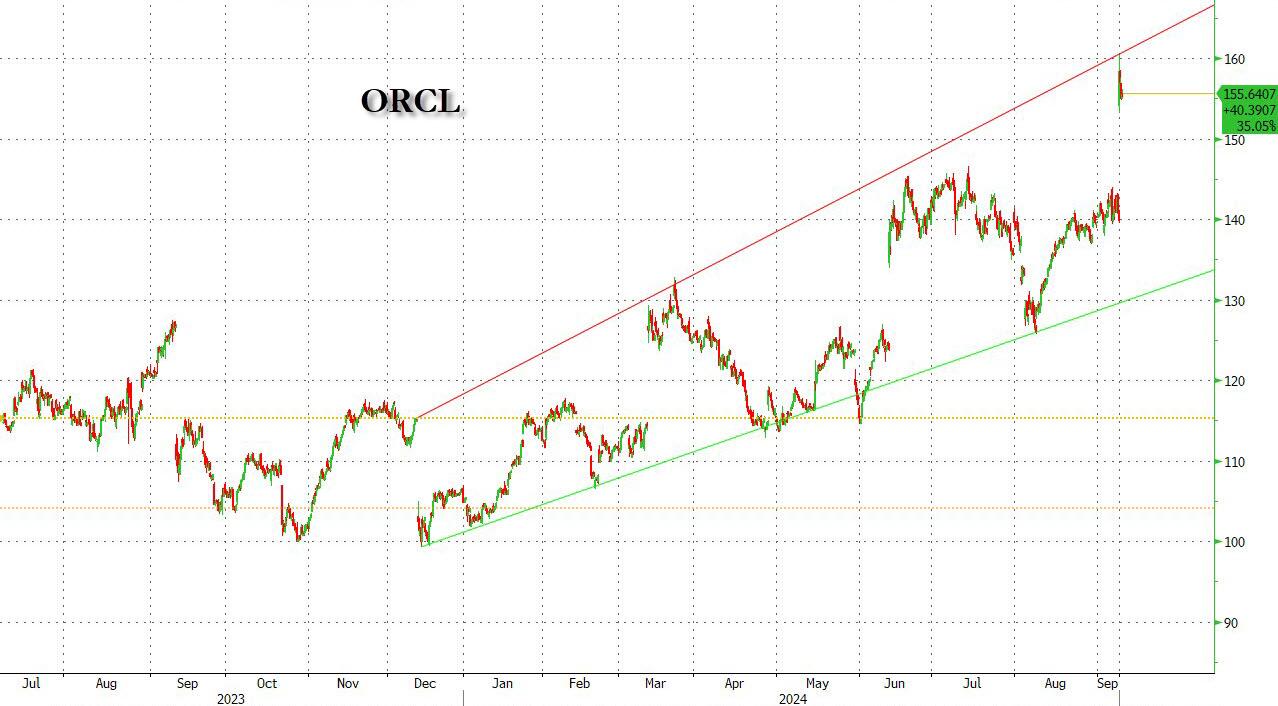
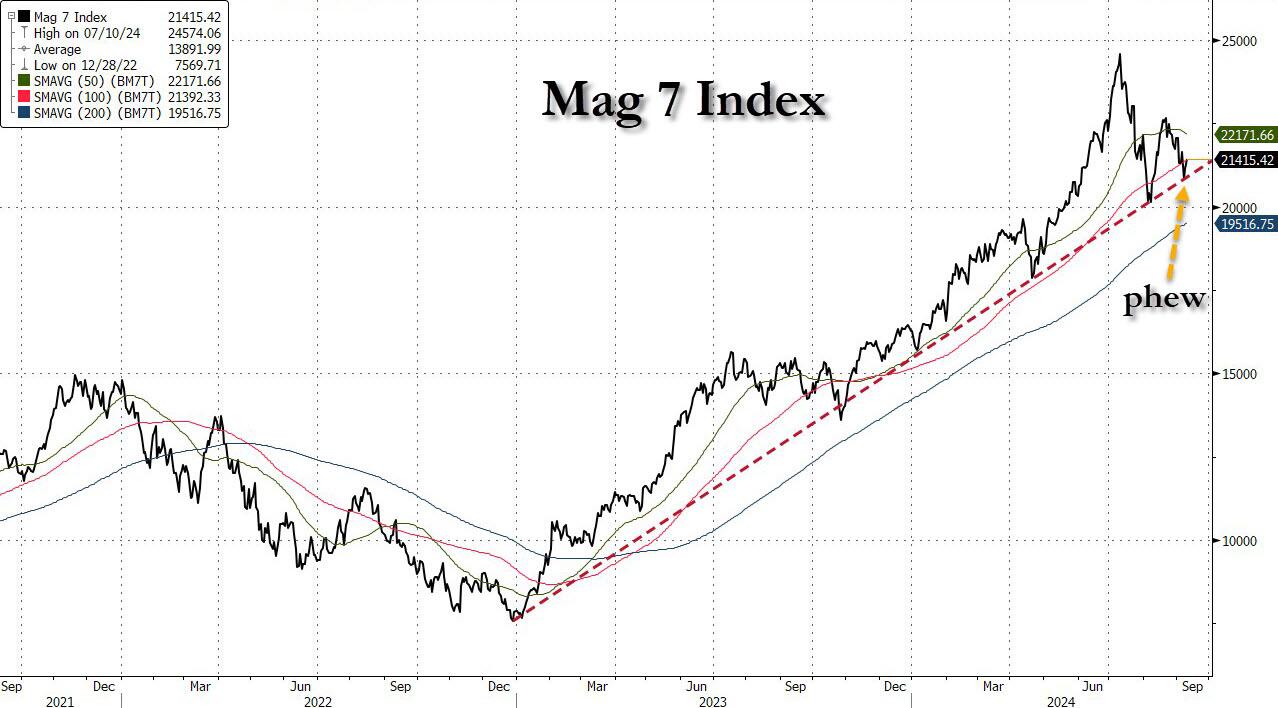
Tech giant Oracle provided a boost to the tech sector with solid earnings results, which also supported the MAG 7 basket as it approached a major support level.
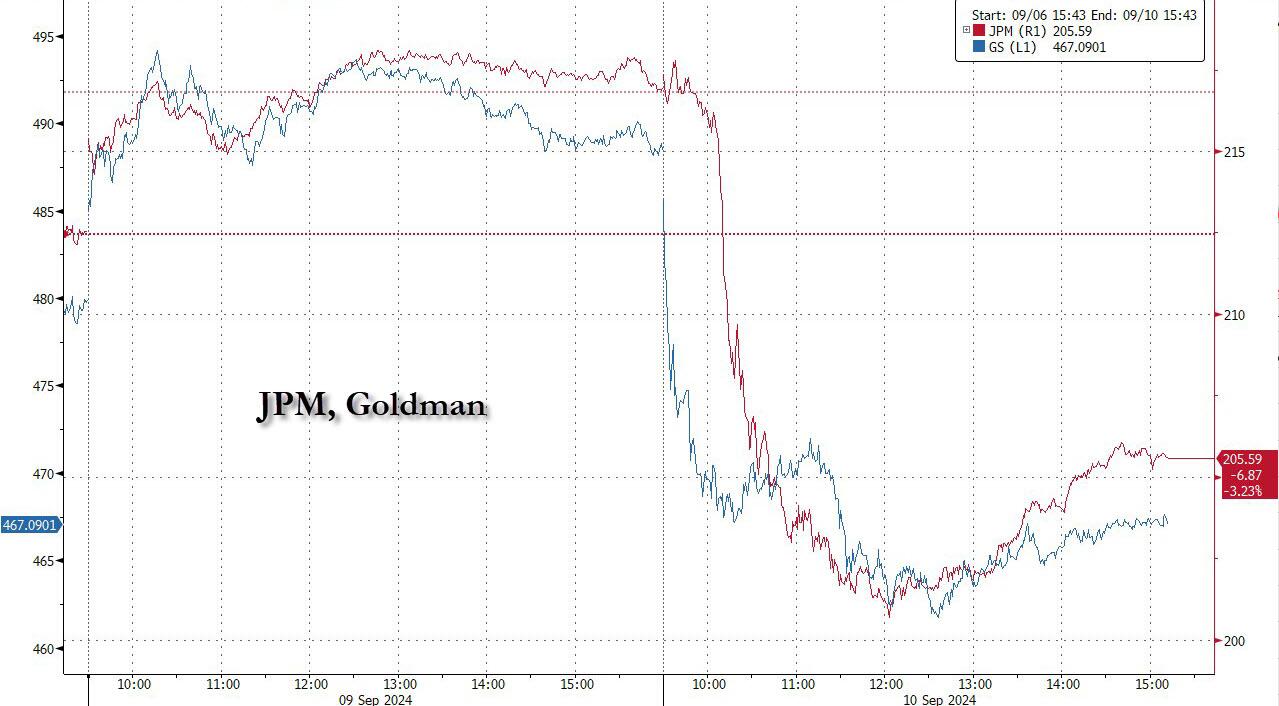
The banking sector, particularly JPMorgan and Goldman Sachs, suffered significant losses as their stocks plummeted on warnings of disappointing Q3 revenues and full-year net interest income outlooks.
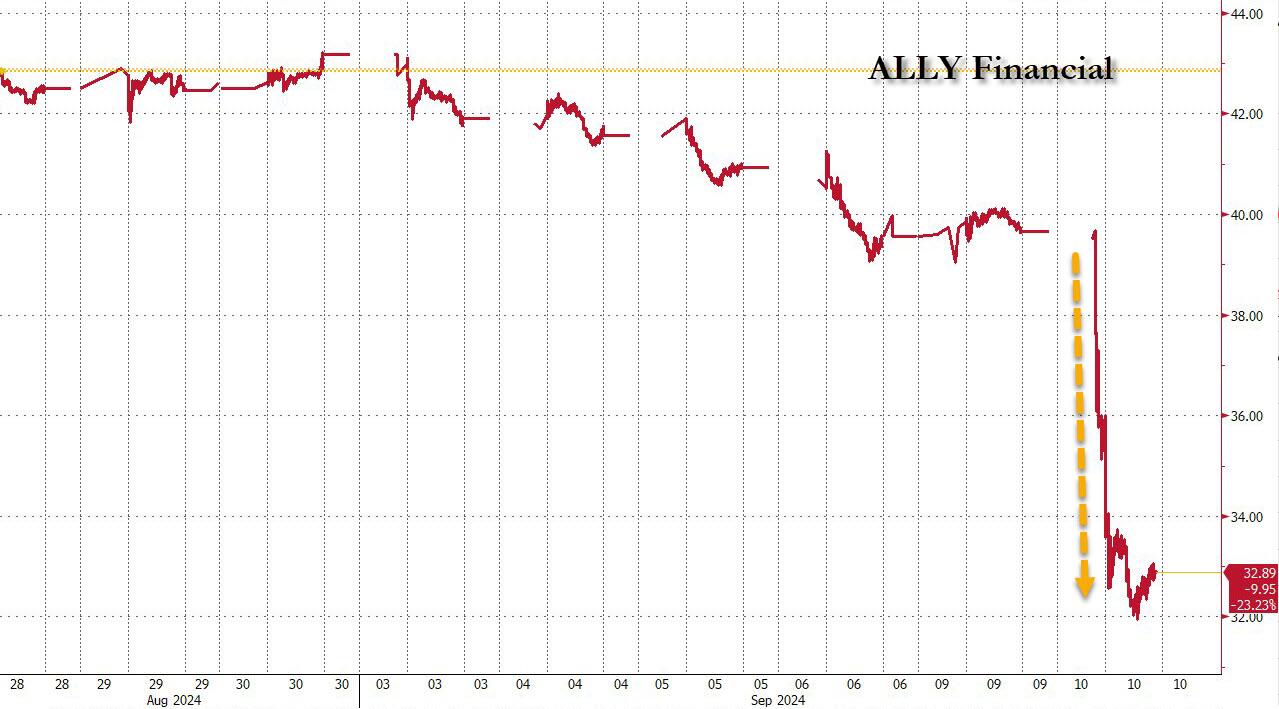
Additionally, Ally Financial, one of the largest US auto loan lenders, revealed surging delinquencies and charge-offs, leading to one of the biggest drops in its stock history.
Crude oil prices also fell, dropping around 3.5%. These developments underscore the theme I’ve emphasized over the past year: the economy is straining and in dire need of rescue efforts.
Bond yields pulled back, which boosted gold prices, although the precious metal remains stuck in its four-week trading range. Bitcoin also bounced off its downward support level, gaining slightly.
With the CPI report due tomorrow, traders are more focused on the upcoming presidential debate, where inflation is expected to be a key topic of discussion.
No matter how it turns out, market sentiment will be impacted.