
- Moving the markets
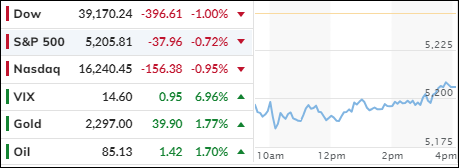
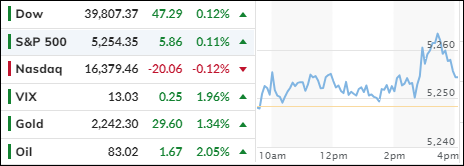
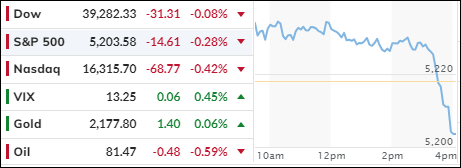
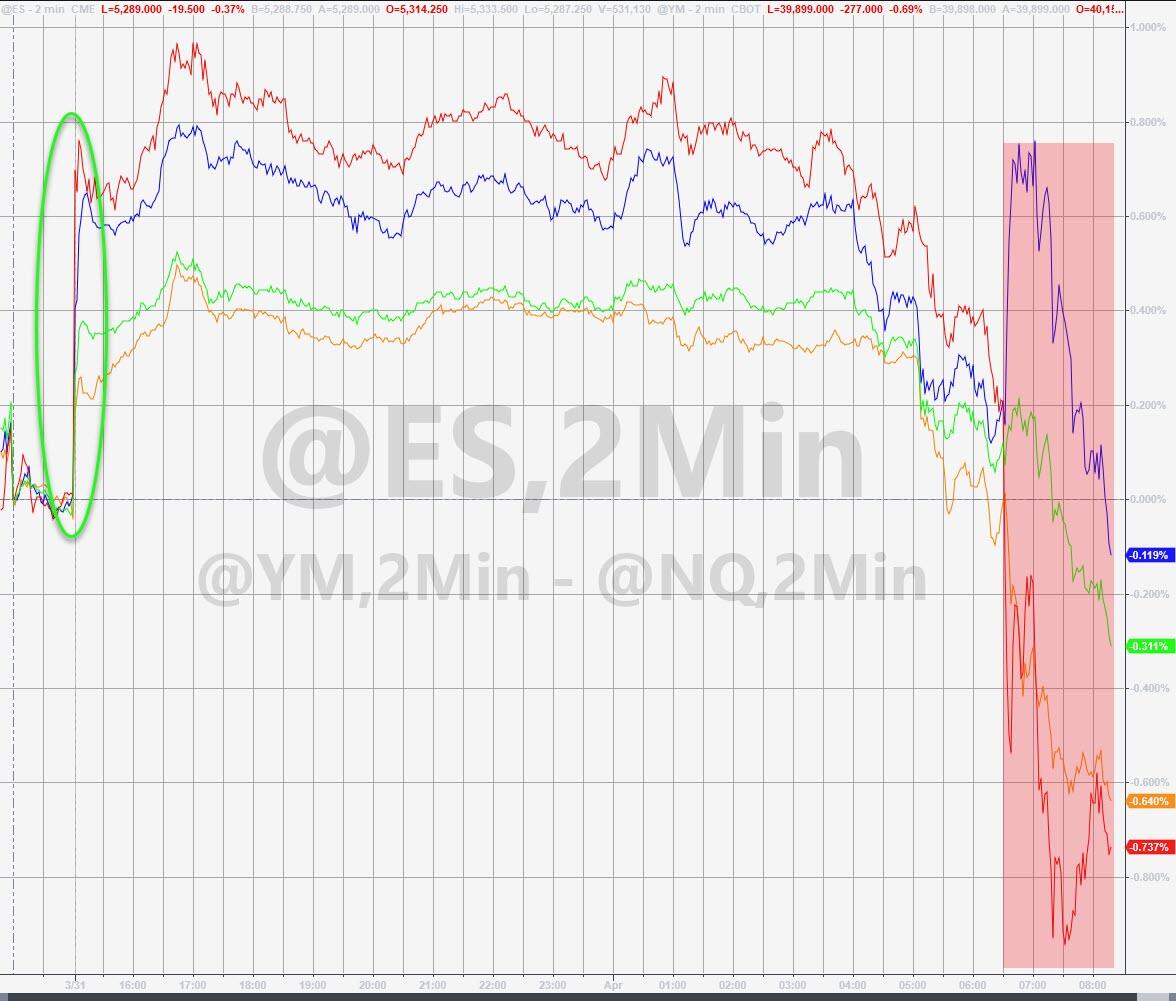
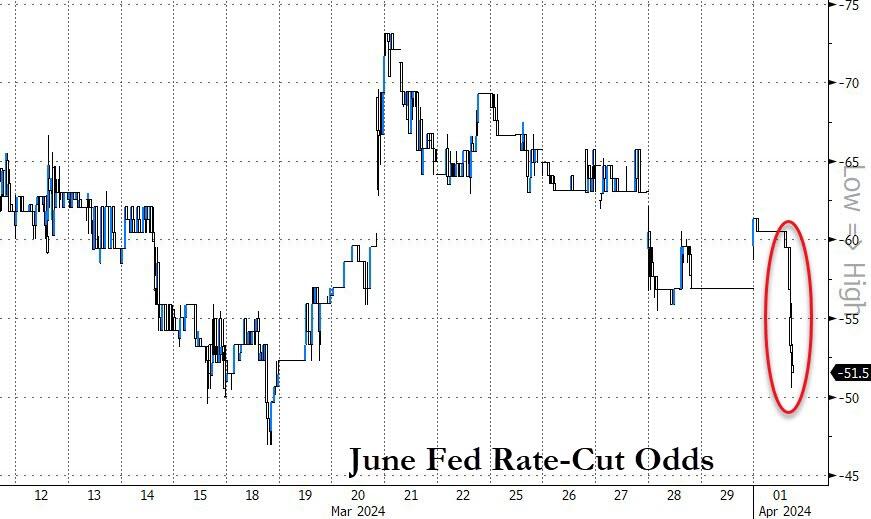
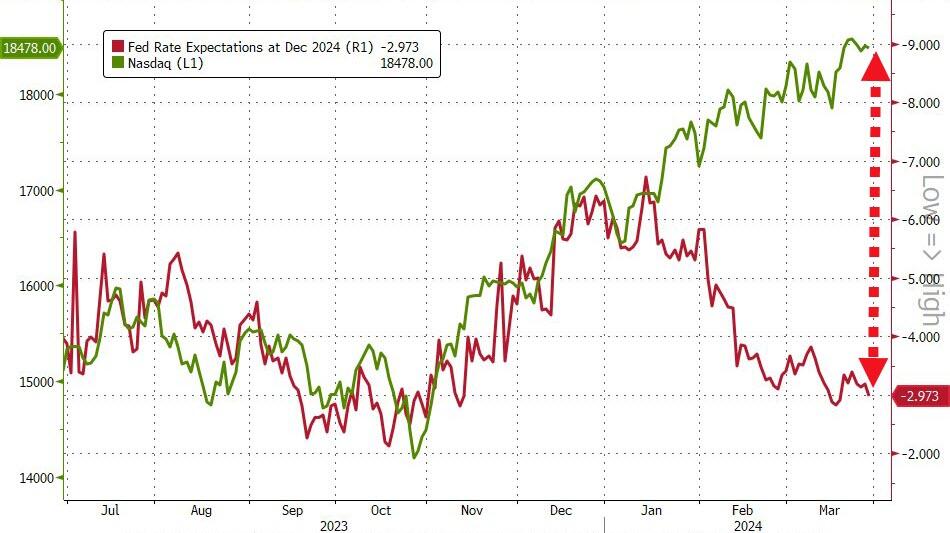
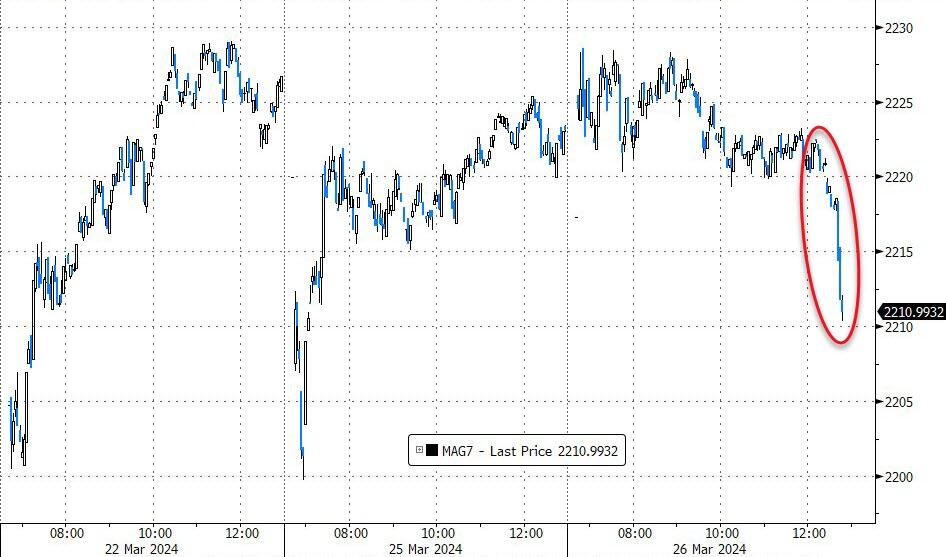
The Dow experienced a decline for the second consecutive day, managing to recover only a portion of the initial losses. This downturn contributes to a disappointing beginning to the quarter for Wall Street, as bond yields rose and market participants adjusted their expectations, now doubting a Federal Reserve interest rate cut in June.
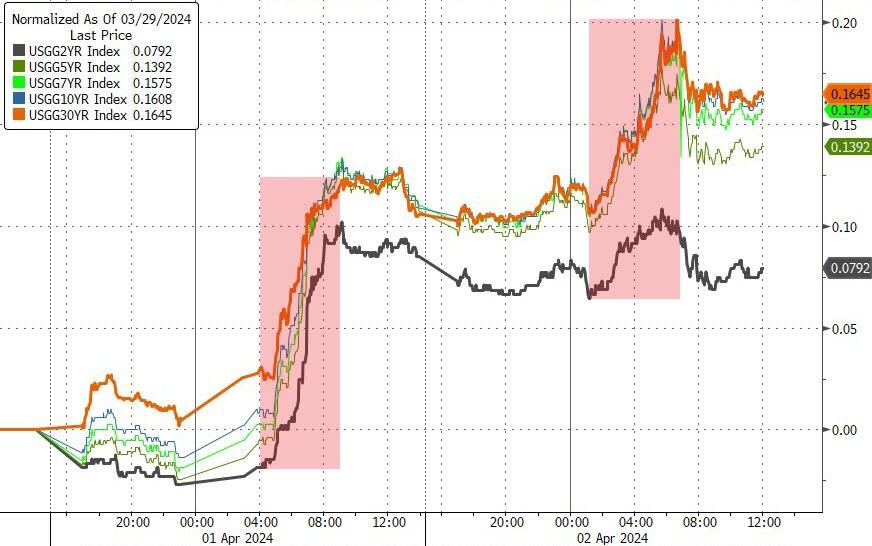
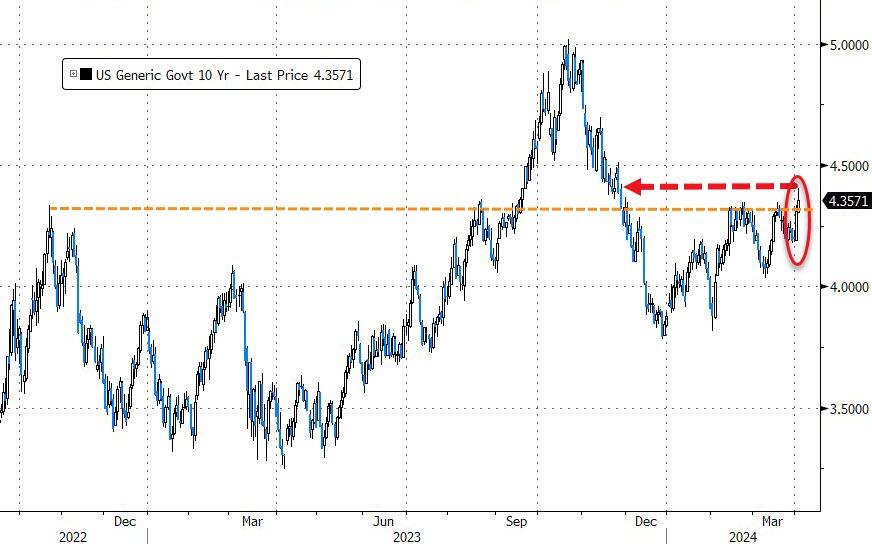
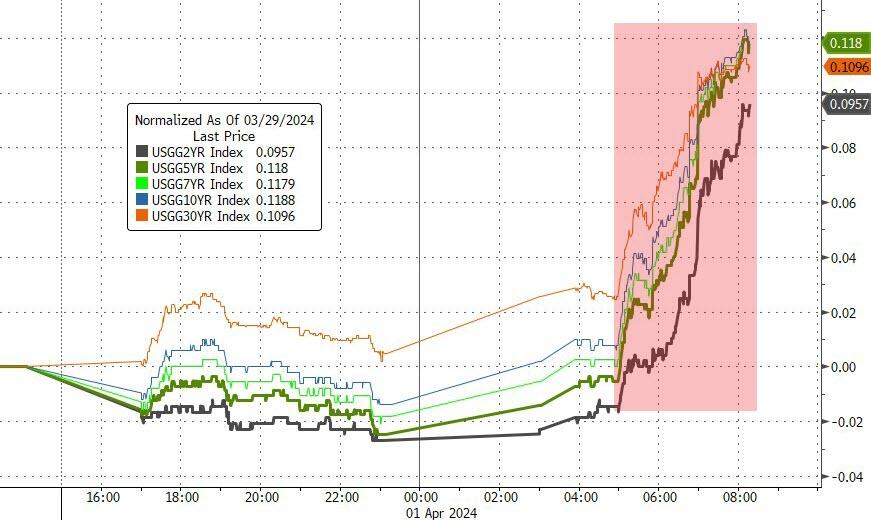
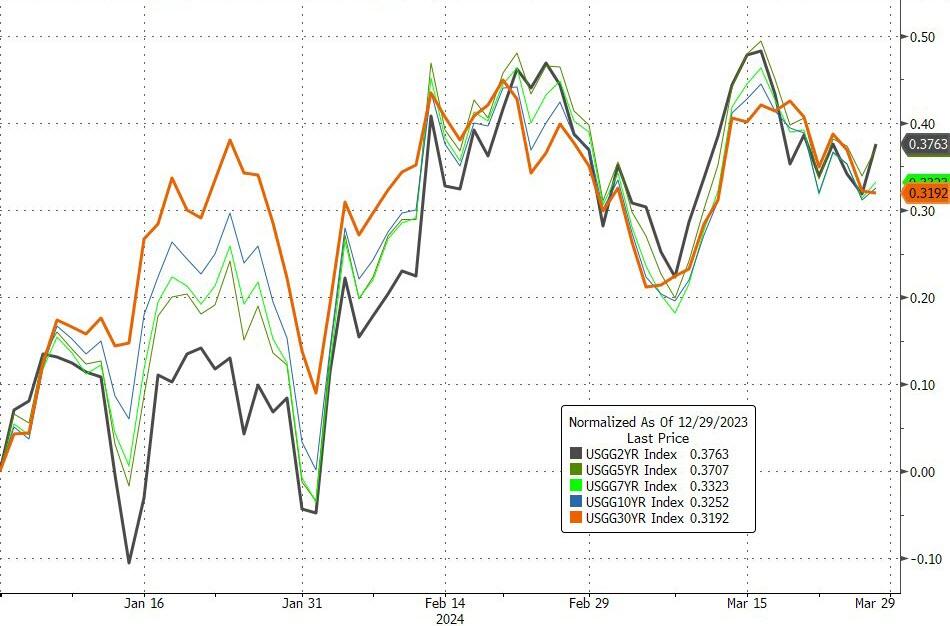
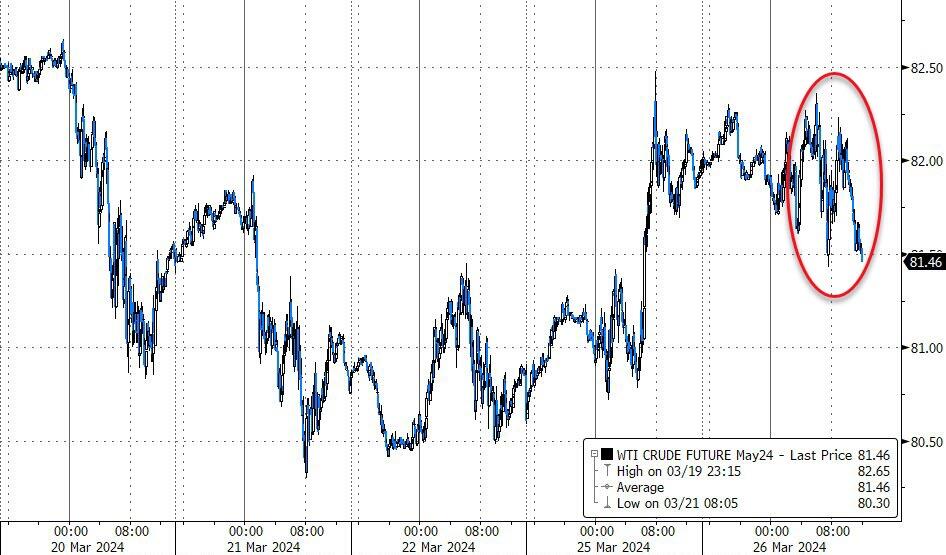
The stock market’s second quarter has been challenging, with persistent inflation concerns and robust economic indicators driving yields upward, diminishing the likelihood of a rate reduction by the Fed next month. The yield on the 10-year Treasury note soared to its highest point since late November, and oil prices reached a peak not seen in five months, exacerbating inflationary pressures.
I have consistently highlighted the issue of inflation, which is just starting to manifest due to growing debt and deficits, setting the stage for further economic strain. The Federal Reserve seems committed to maintaining higher interest rates for an extended period.
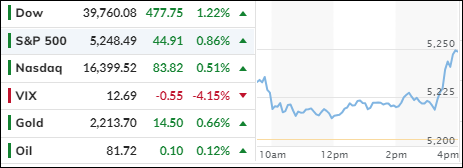
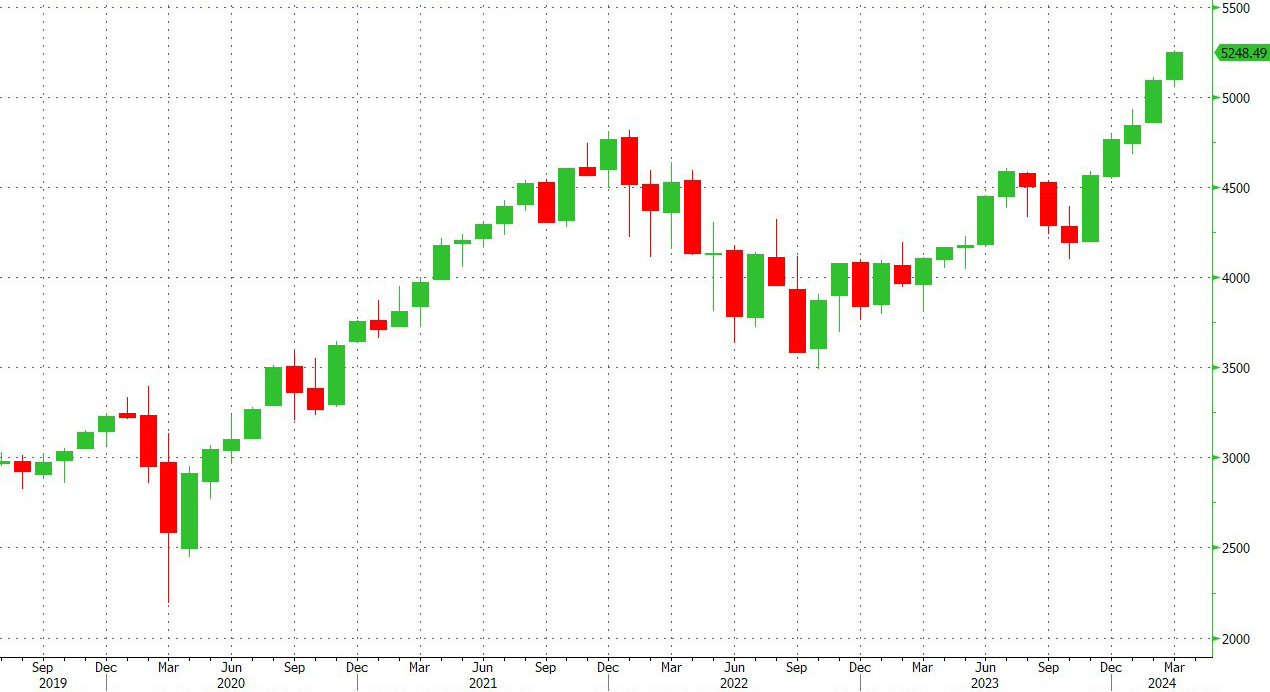
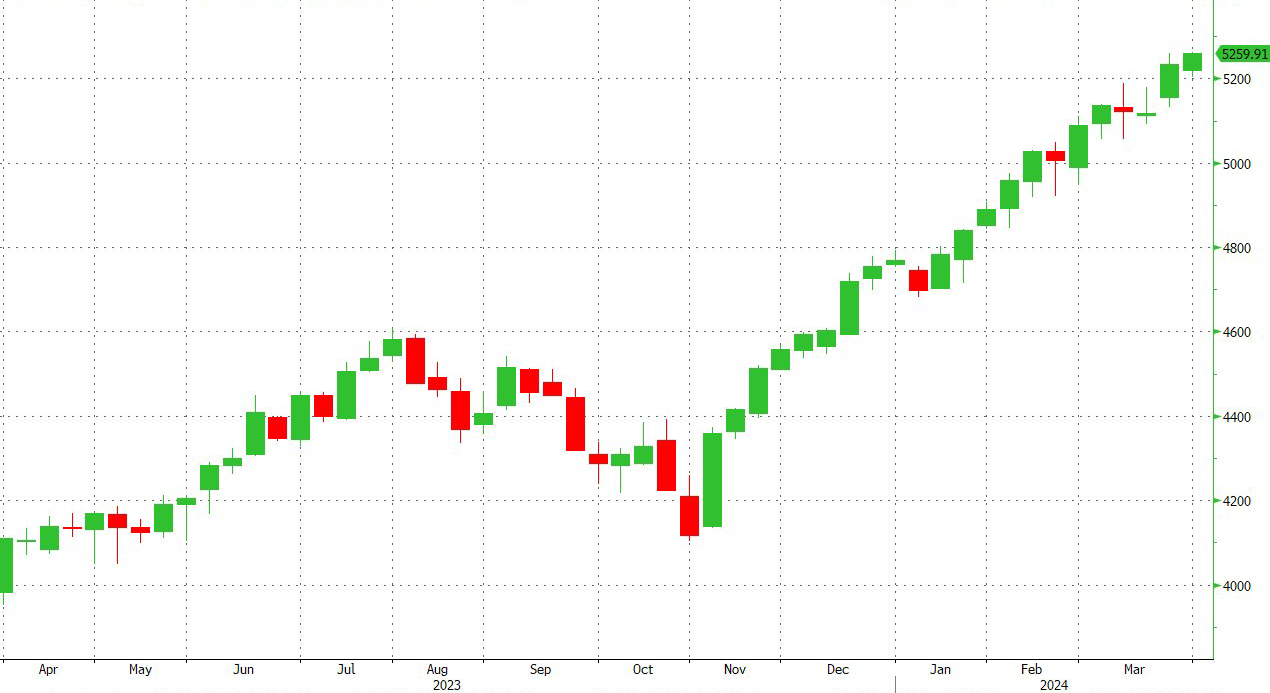
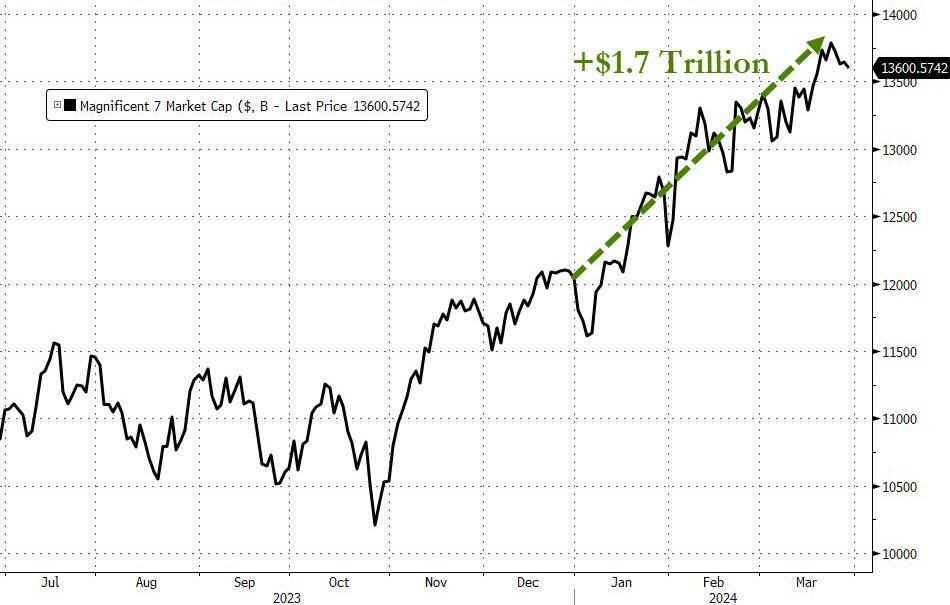
Despite this, optimism remains, with the S&P 500 marked a 10% increase for the first quarter—the strongest opening since 2019. Traders had hoped that inflation would decrease sufficiently for the Fed to commence rate cuts while the economy continued to expand. However, I view this optimism with skepticism.
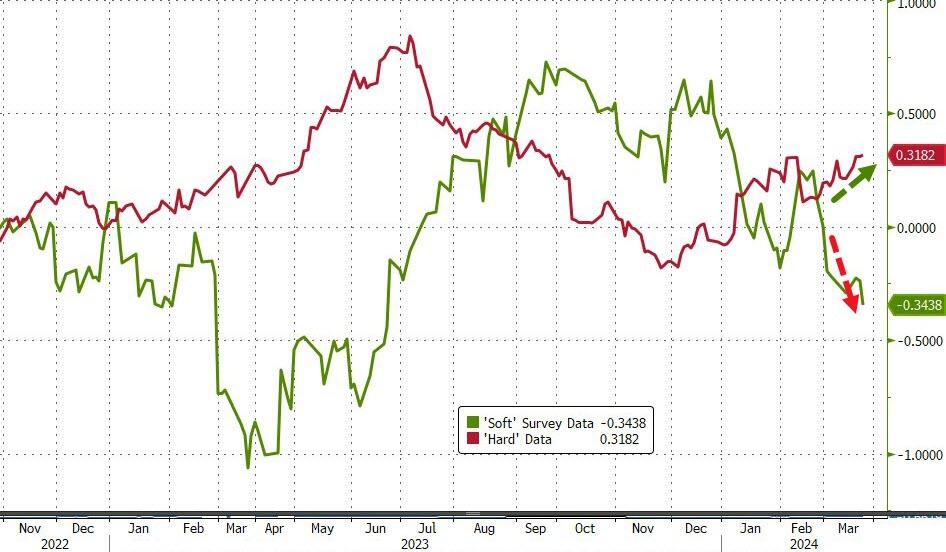
Today’s economic reports were mixed, with the labor market remaining robust and factory orders exceeding expectations. Conversely, the decline in durable goods orders and shipments for February indicates potential GDP contraction.
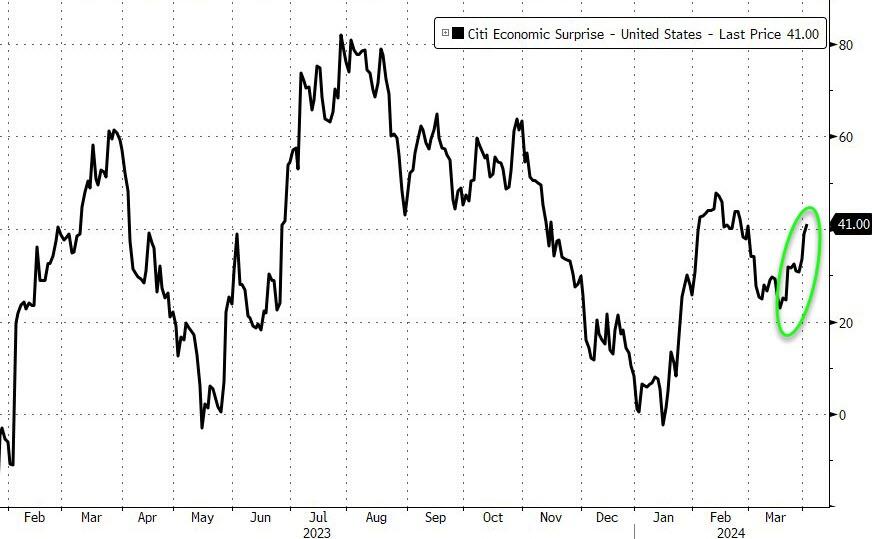
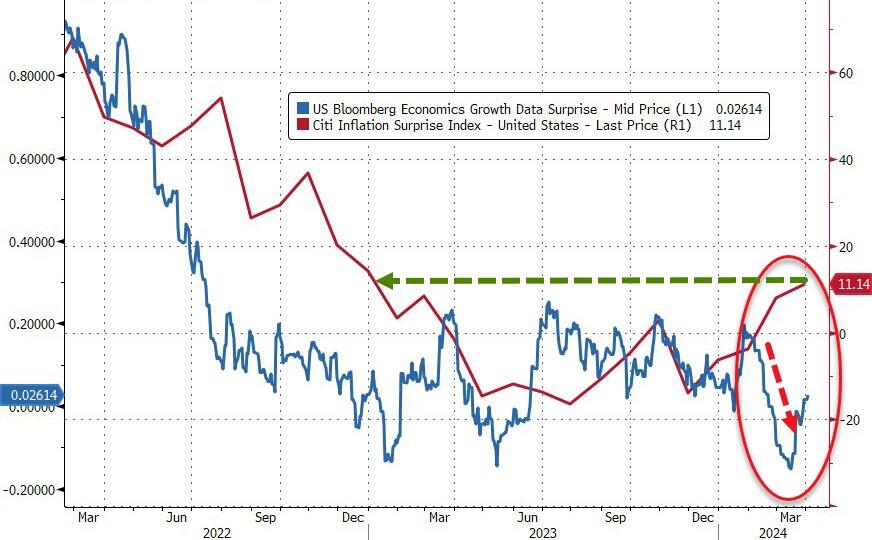
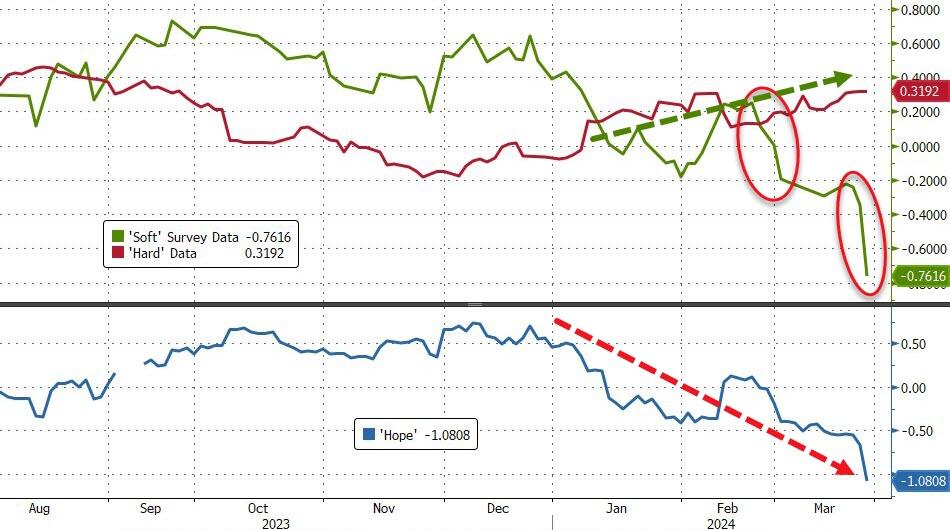
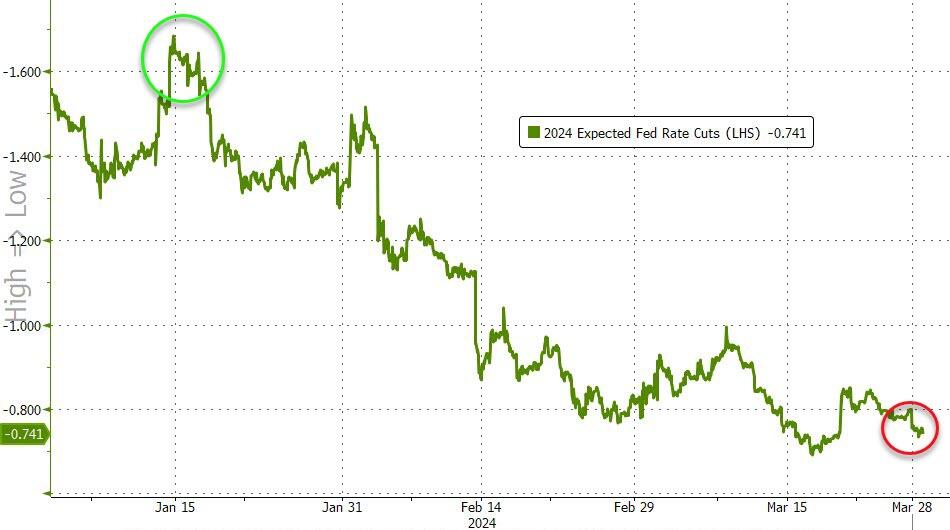
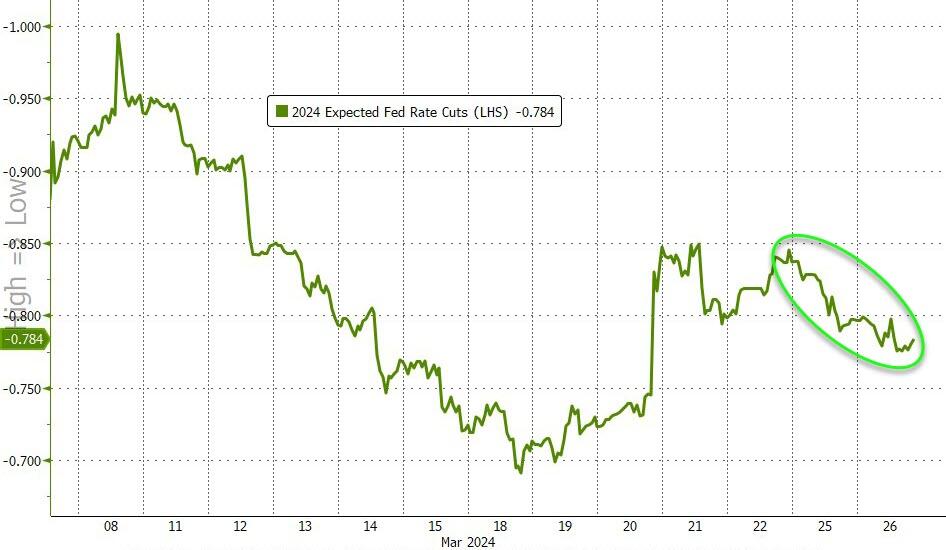
These indicators have not significantly swayed the market’s rate-cut forecasts, which currently stand at a mere 50% chance of a June reduction. Meanwhile, U.S. macroeconomic surprise data has shown improvement following a recent downturn.
Federal Reserve official Loretta Mester expressed a cautious stance, suggesting that more data is needed to determine if the disinflation trend is faltering or merely experiencing a temporary setback. She emphasized the risk of prematurely lowering the federal funds rate, especially given the strength of the labor market and overall economic growth.
Yesterday’s optimism was dampened as bond yields increased further, pushing the 10-year yield to its highest level since the previous November, and undermining bullish sentiment.
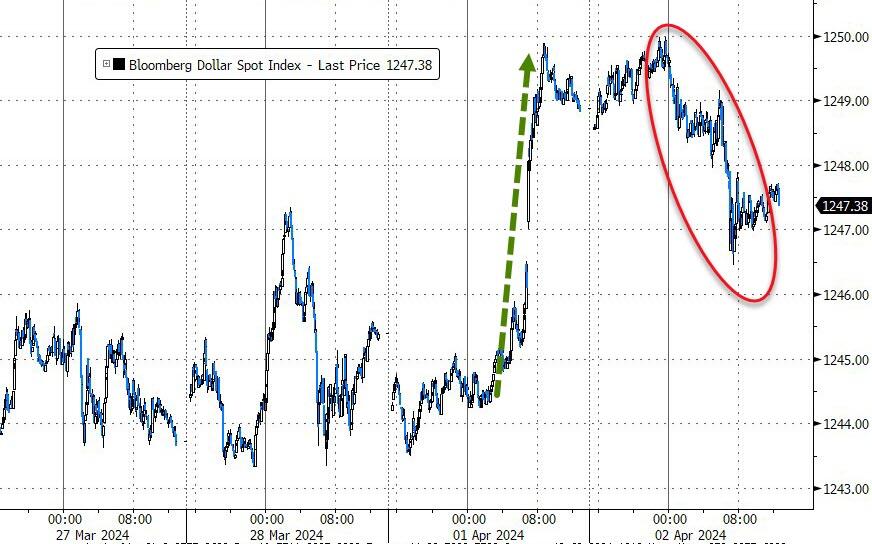
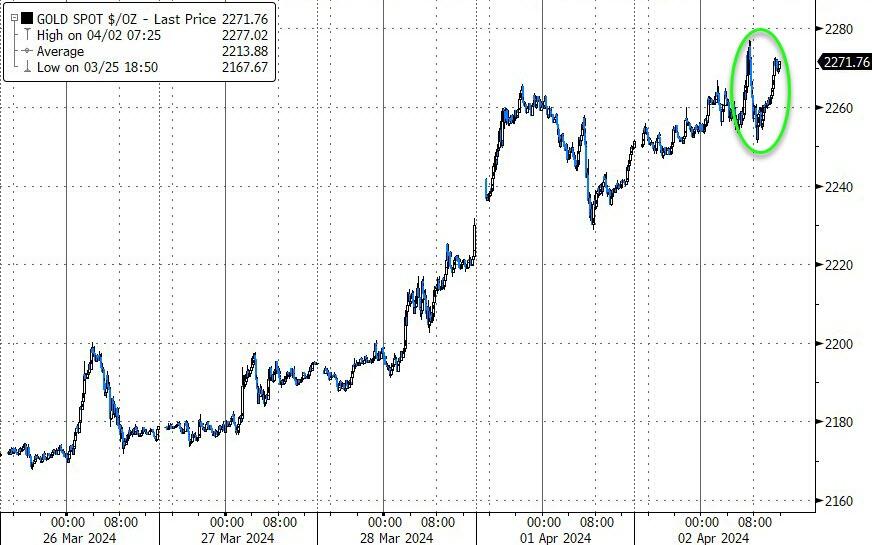
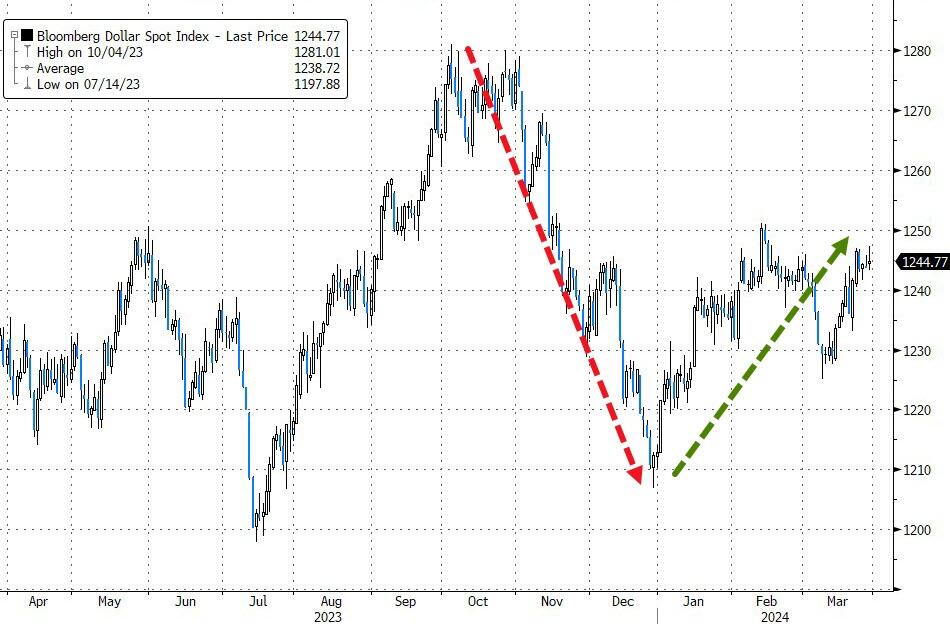
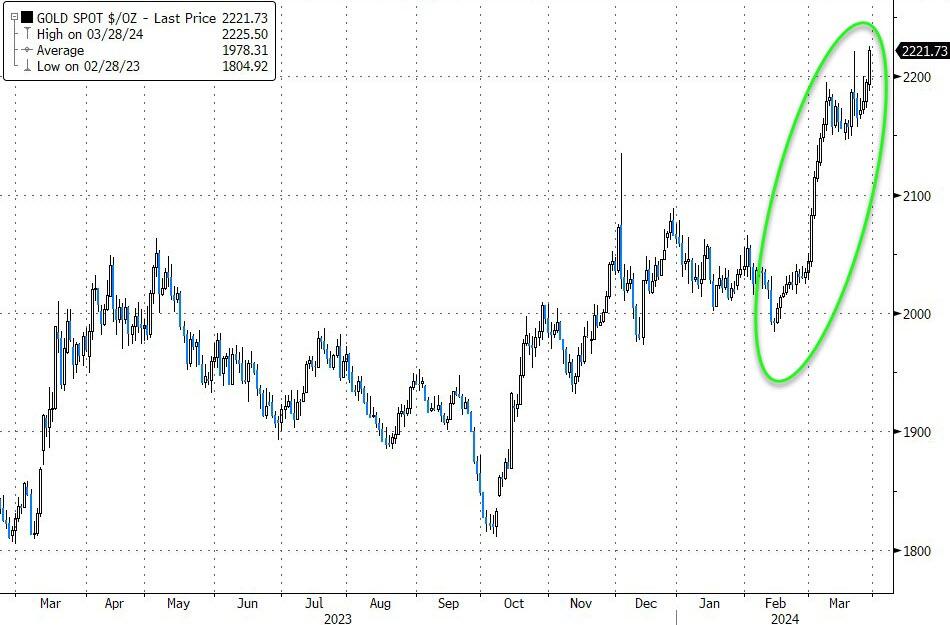
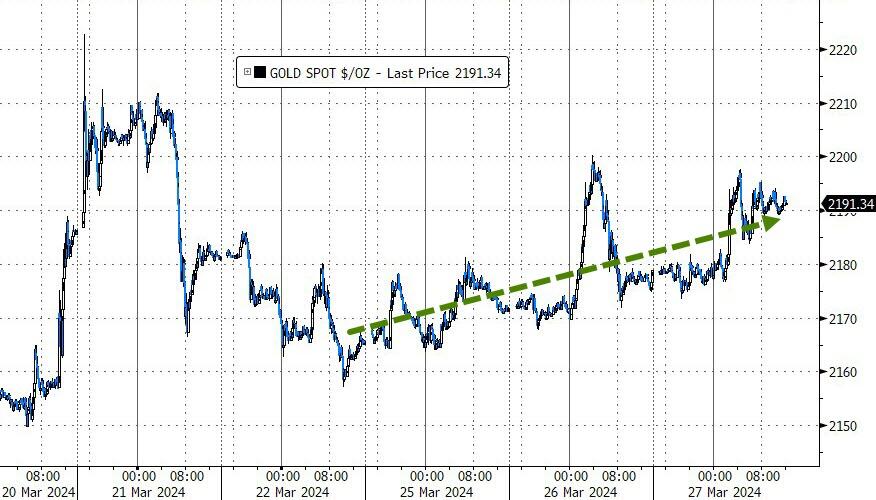
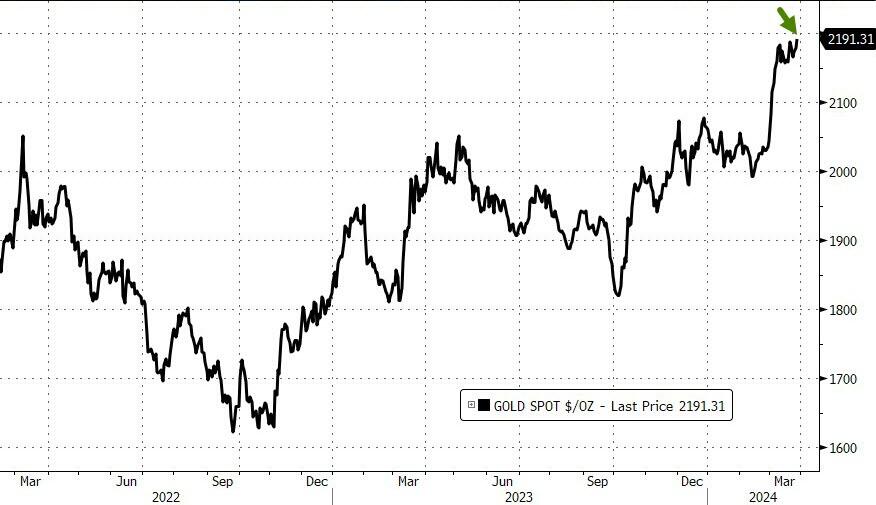
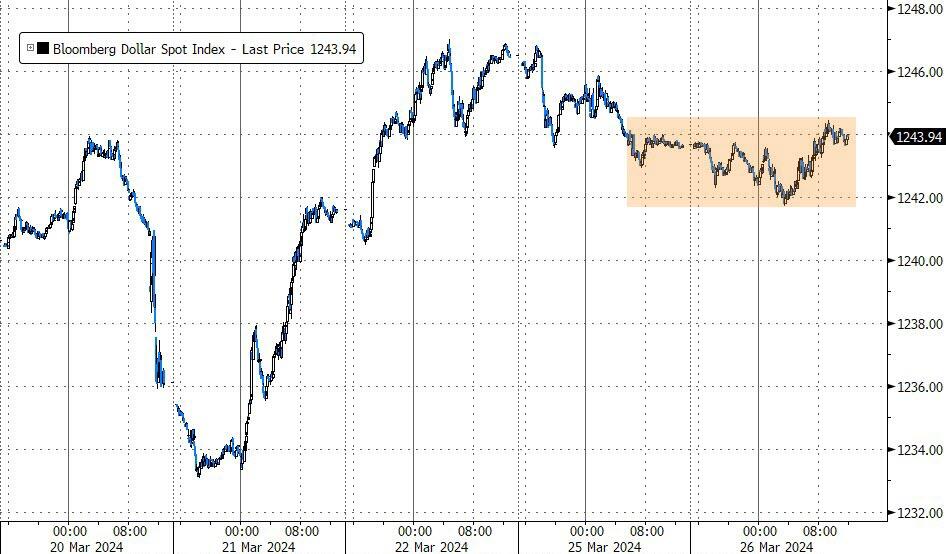
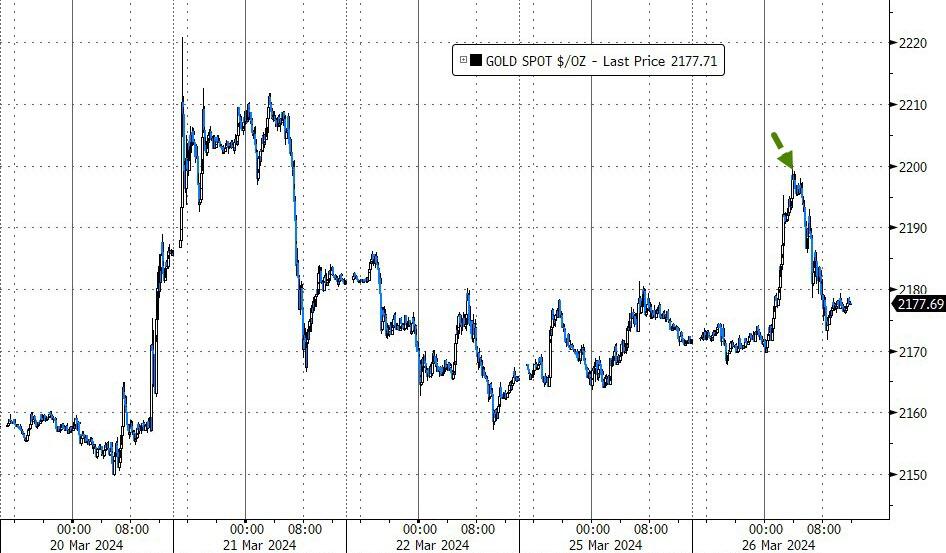
In a surprising turn, the dollar weakened, reversing most of its gains from the day before. Gold, on the other hand, surged to a new intra-day high of $2,277 before retreating at the close, while silver outperformed, reaching $26 for the first time since May 2023.
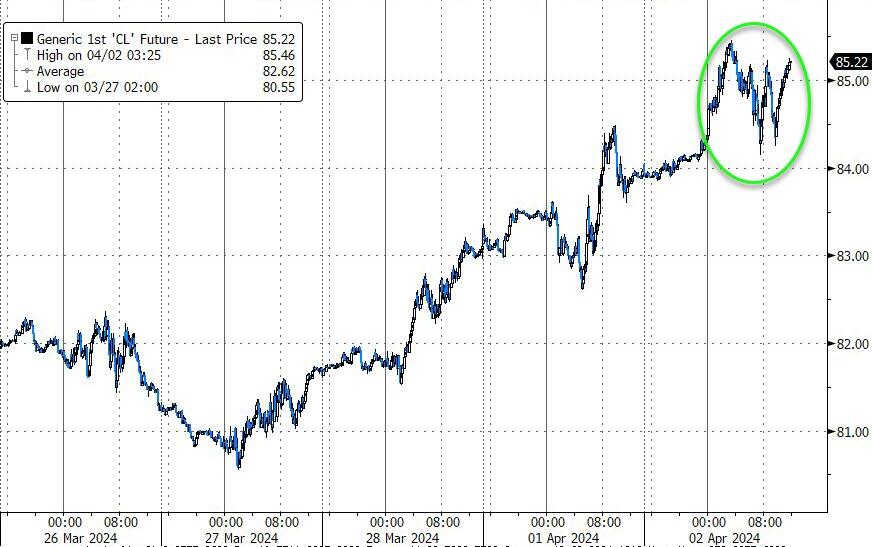
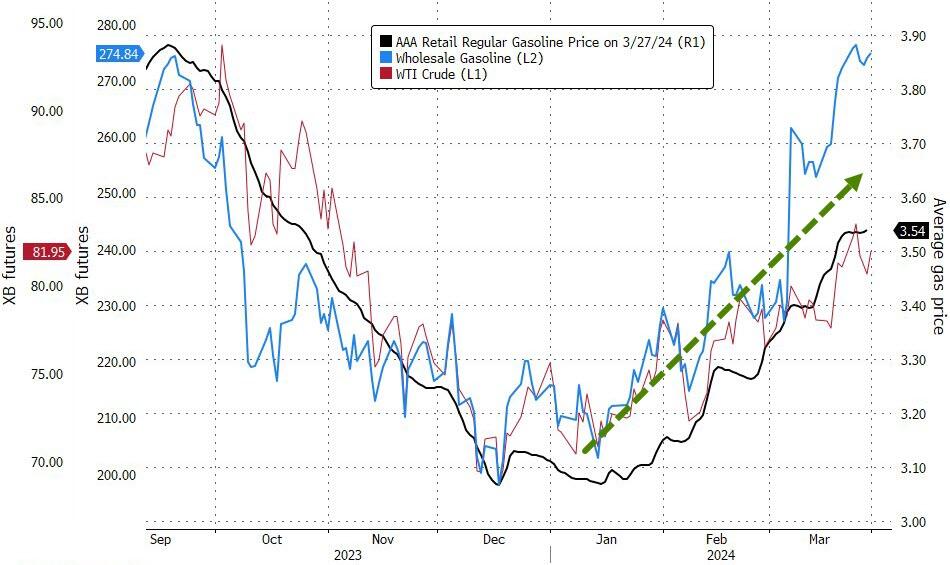
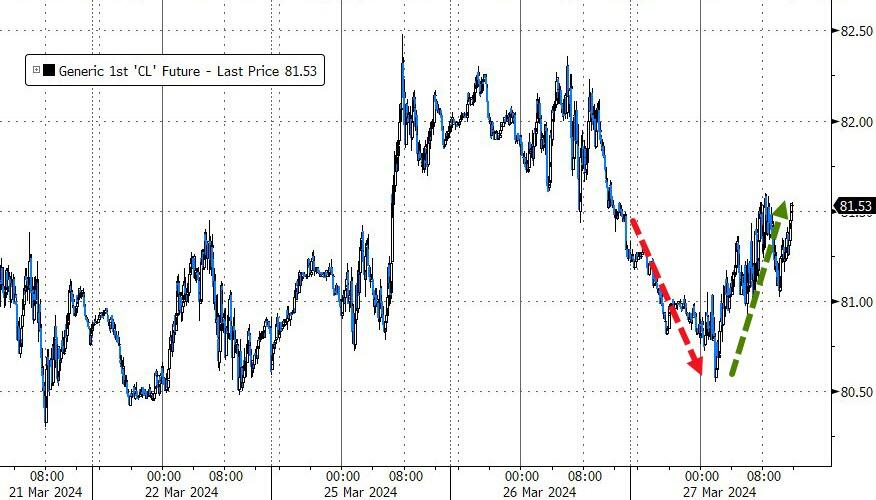
Crude oil prices also climbed, surpassing $85 and reaching their highest point since last October, challenging the narrative that inflation is under control. Ultimately, the specter of stagflation looms, as depicted in a chart from ZeroHedge, succinctly captured by the equation:
“No growth” + “increasing inflation” = “rising gold prices.”
Got gold?
Read More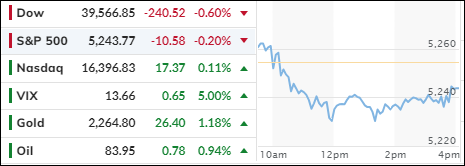
