The Return Of Volatility

Ulli Uncategorized Contact


Monday’s feel-good-rally after Friday’s drubbing died at the opening yesterday as prices gapped down and never recovered.

Despite a rise in pending homes sales and positive Merck and Pfizer earnings, all eyes were feasted on the Greek bailout and the increased concern that the Greek government would fail in getting its debt problem under control and force another bailout package.

Coupling that with the fact that Portugal, Spain and Ireland are waiting in the wings with similar problems, simply created an unknown that the markets were unable to handle. You can read more on that topic here.

The euro was the whipping boy of the day, while the dollar rallied and supported our positions in UUP. There was no place to hide, so UUP turned out to be the only bright spot on the computer screen.

In terms of our trailing sell stops, none were triggered, but the emerging markets moved within shouting distance and will be monitored closely. As I posted in “Running Out Of Steam,” the emerging markets were the leaders on the way up as this buy cycle began, and it appears that they will be leading on the way down as well.

Not For The Long Term

Ulli Uncategorized Contact

The use of leverage has always intrigued investors to increase returns despite the increased downside risk. The ETF arena features a stable of 2X and 3X leveraged funds covering various areas.

The fact that some of these sport high daily trading volumes supports their popularity. For example TNA (3X bullish S&P; 500) has an average daily trading volume of $500 million while SDS (2X bearish S&P; 500) has over $1 billion.

If you are an aggressive investor, who wants to play with fire, there are a few things you need to know as ETF Trends reports in “Spice Up Your Portfolio With Leveraged ETFs:”

* Returns are only meant to reflect the daily performance of a fund’s underlying index. Each day, these ETFs “reset” and over time, this can lead to a fund not staying in perfect line with its benchmark.

* In normal markets, this effect can work in your favor. In volatile markets, the compounding effect is exacerbated and the longer you hold a fund, the further it may stray from its benchmark.

* These funds are meant for daily use; if you hold them longer, just be aware that there may not be a 1-to-1 tracking of the underlying benchmark.

I believe that these ETFs are suited only for the most aggressive investors with deep pockets. The speed with which you can make or lose money during fast moving markets boggles the mind. I have one well capitalized client who likes to “play” with some of these ETFs and making or losing $50k can often happen in minutes.

It’s a trader’s paradise but a long-term investor’s nightmare. Stick to what you are comfortable with and leave the high risk ETFs for those who have the stomach and the funds to handle a wild ride.

Battle In the High Yield Arena: ETFs vs. Mutual Funds

Ulli Uncategorized Contact

While ETFs continue to be the hottest investment tool, much to the chagrin of mutual funds, when it comes to the high yield arena, they are still a worthy competitor as ETF Trends submits in “High-Yield ETFs vs. High-Yield Mutual Funds:”

Exchange traded funds (ETFs) may have siphoned billions of investment money out of mutual funds in the past year, but when it comes to high-yield bonds, mutual funds are bringing a competitive game.
…

Some of the benefits high-yield ETFs enjoy over similar mutual funds include:

* Similar to the ETF offerings, mutual funds that offer access to high-yield debt also track a select basket of low-grade corporate debt. However, the mutual fund offerings take an active approach while HYG and JNK are designed as passive products.

* Mutual funds rely on the know-how of their managers, which means higher expense ratios. Mutual fund expense ratios can exceed 1.0% and can incur short-term fees for shares held less than 90 days.

* The higher fees also mean that the mutual funds pay out lower yields.

* Mutual funds lack intraday liquidity, transparency and frequently have hefty investment minimums, as well.

When it comes down to total returns, leading high-yield mutual funds have recorded total returns of up to 20% in the past two years, whereas JNK and HYG have provided 12.8% and 11.1%, respectively.

Still, HYG and JNK are better for short-term trades because of their transparency, ability to trade throughout the day and lack of short-term trading fees. Mutual funds may be the better choice for long-term investing due to their total return outperformance.

To be clear, this is not a matter of pitting mutual funds against ETFs, but simply a matter of selecting the tool that’s most appropriate for you. Due to the ever present market volatility, my preference for generating income is ETFs, especially after the market run of the past year. While more upside potential still exists, at these levels, the risk of a correction has increased quite a bit.

Keep in mind that high-yielding ETFs and mutual funds will follow the general direction of the market. Take a look at this 2-year chart showing JNK and HYG compared to SPY (S&P; 500):

As you can see, during the meltdown of 2008, JNK and HYG did better than SPY, but holding on to these and seeing your principal deteriorate by some 40% will not give you the warm fuzzies, despite a 10% yield.

In my view, income funds/ETFs need to be treated just like equity funds/ETFs in that their trends need to be tracked, and a sell stop has to be used in the same fashion to protect your downside risk.

Disclosure: We have holdings in JNK

Sunday Musings: The Greek Crisis And Stock Market Trends

Ulli Uncategorized Contact

The Greek debt crisis has been a factor in affecting the direction of world stock markets, at least for the time being.

While no one can predict what the true long-term consequences will be, there have been similar fallouts in history that might give a clue.

Mark Hulbert had some thoughts on this topic in “Tragedy or Comedy?”

The difference between a tragedy and a comedy, I was taught in Classics 101, is that, in the latter, the hero wakes up in time.

I take this to mean that it’s premature to label the current fiscal crisis in Greece as a tragedy, as many commentators nevertheless are already doing. It might in the end turn out to be a tragedy, but it doesn’t have to.

This is especially worth remembering after a day in which the stock market plunged as Greece’s debt was freshly downgraded (this time to “junk” status). The Dow Jones Industrial Average fell by more than 200 points, or 1.9%. The S&P; 500 had an even worse day in percentage terms, shedding 2.3%.

But investors can’t really have been all that surprised by the downgrade of Greek debt — or at least shouldn’t have been. John Dessauer, editor of an investment advisory service called John Dessauer’s Outlook, argued in an interview last week that it was almost certain that Greece would end up defaulting on its sovereign debt, either outright or de facto.

In any case, Dessauer furthermore argued, the impact on the world economy of an outright Greek default would be fairly modest. That’s because the damage to world trade inflicted by the Greek crisis has already happened — and for the most part has been already priced into the level of the stock market.

Dessauer’s point is confirmed by a recent analysis I conducted of the stock market’s reaction to past sovereign debt crises. Interestingly, Greece’s sovereign debt crisis is hardly unique. And the stock market on average has performed quite well in the wake of past such crises.

Over the last two decades, I counted at least four major sovereign debt crises:

* The Mexican peso devaluation and associated crisis, which began in December 1994.

* The so-called “Asian Contagion” that began in July 1997, when a government debt crisis in Thailand led to a run on its currency. That in turn precipitated similar crises throughout the region, leading many to fear that the crisis might eventually spread around the world.

* The Russian ruble devaluation in August 1998, which led to (among other things) the bankruptcy of Long-Term Capital Management

* The Argentine government debt/currency crisis that began in November/December 2001

The accompanying chart is based on a composite of how the stock market reacted following all four cases, with 100 representing the stock market’s level when those crises first broke onto the world financial scene. On average the stock market was 17% higher in one year’s time (as measured by the Wilshire 5000 Total Market Index).

The chart also shows how, on the same scale, the stock market has reacted so far to the Greek crisis. Notice that, more or less, the stock market is following a similar script. In fact, even with Tuesday’s big drop in the stock market, it nevertheless remains ahead of the average experience in the wake of the four prior debt crises.

This analysis doesn’t amount to a guarantee that the stock market will perform as well this time around, needless to say. There is a big leap of faith involved in extrapolating from this — or any — historical analysis, especially one based on a sample containing just four examples.

Still, this analysis does serve to remind us that the negative impact of a sovereign debt crisis, scary as it otherwise may be, can also be exaggerated.

At the same time, you are well advised not to make hasty investment decisions just because a crisis has affected markets temporarily. The next one will be lurking on the horizon for sure, so it pays to stay with your strategy, as long as the major trends remain up and your sell stop points have not been violated.

It’s important to remember that once a negative event becomes known, any further consequences are likely priced in the markets already and will have less of an effect than initially. It’s the unexpected that can wreak havoc on Wall Street, at least temporarily.

That’s why it’s most beneficial for you as an investor to keep your emotions in check, let the markets do what they do, but have a plan in place to deal with a change in trend direction by using your sell stops to get your portfolio out of harm’s way.

Most Innovative ETF

Ulli Uncategorized Contact

If you’re interested in following risk-adjusted returns of the collective hedge fund universe via one ETF, take a look at “IndexIQ’s IQ Hedge Multi-Strategy Tracker ETF (QAI):”

IndexIQ’s IQ Hedge Multi-Strategy Tracker ETF (NYSE Arca: QAI) has been named the Most Innovative ETF by Capital Link, it was announced today. The IQ Hedge Multi-Strategy Index, the index underlying QAI, also was recognized by Capital Link as the Most Innovative Index, marking the first time a single firm has been awarded this distinction in both the ETF and Index categories.
…

IndexIQ is a leading developer of index-based alternative investment solutions, offering Exchange-Traded Funds (ETFs), mutual funds and separately managed accounts. The IQ Hedge Multi-Strategy Tracker ETF was introduced on March 25, 2009, and was the first U.S.-listed hedge fund replication ETF. It is designed to capture the risk-adjusted return characteristics of the collective hedge fund universe using multiple hedge fund investment styles, including long/short equity, global macro, market neutral, event-driven, fixed income arbitrage, and emerging markets.
…

IndexIQ products are designed to be liquid, transparent, low cost, and accessible to a broad range of investors.* QAI, MCRO and IQ ALPHA Hedge Strategy Fund are not hedge funds and do not invest in hedge funds.

The ETFs should be considered a speculative investment entailing a high degree of risk and are not suitable for all investors. An investment in the ETFs does not represent a complete investment program.

Past performance is not a guarantee of future results.

[Emphasis added]

Since QAI has been only on the market for a little over a year, it’s not possible to determine how this ETF would have performed in a bear market, such as 2008. On the bullish side, it’s been disappointing when you look at it on a year chart and compare it to the Total Stock Market ETF (VTI):

Of course, this may not be bad at all, if QAI either avoided the crash of 2008 or actually produced a positive return. When evaluating a fund or a strategy, you always need to combine bullish and bearish periods to arrive at a fair conclusion. In this case, we’ll have to wait and revisit this ETF when the next bear market strikes.

The volume is still pretty low with an average of $1 million per day traded, while the bid/ask spread sports a somewhat high 2 cents.

While the concept sounds intriguing, more data is needed to arrive at a conclusion as to whether QAI has merit. Just because it’s considered one of the most innovative ETFs, does not mean it’s appropriate at this time.

Disclosure: We have holdings in VTI but not QAI.

No Load Fund/ETF Tracker updated through 4/29/2010

Ulli Uncategorized Contact

My latest No Load Fund/ETF Tracker has been posted at:

http://www.successful-investment.com/newsletter-archive.php

Several triple digit days favored the bearish crowd this week, and the major indexes retreated.

Our Trend Tracking Index (TTI) for domestic funds/ETFs has now crossed its trend line (red) to the upside by +4.41% keeping the current buy signal intact. The effective date was June 3, 2009.


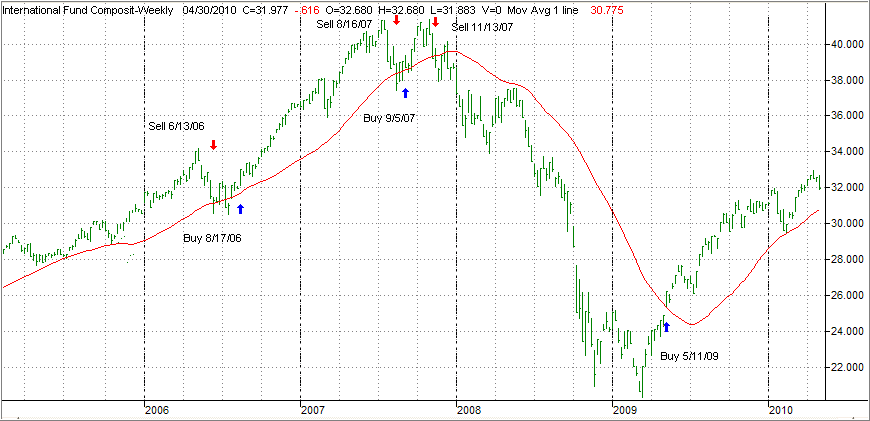
The international index has now broken above its long-term trend line by +3.89%. A Buy signal was triggered effective May 11, 2009. We are holding our positions subject to a trailing stop loss.


[Click on charts to enlarge]

For more details, and the latest market commentary, as well as the updated No load Fund/ETF StatSheet, please see the above link.