Sell Stops Revisited

Ulli Uncategorized Contact

As we are entering a new domestic buy cycle (hopefully one with duration), the question of the proper use of trailing sell stops has come up again.

Here’s what reader Al had to say:

Please explain how to execute a stop loss order on the end of day closing price as you stated in your last blog. I always use the 7% rule, but sometimes my equity will drop below the 7% intraday and trigger the stop loss order, then shed losses to close at a gain.

This is an important topic and, even though has been discussed many times in the past, it’s worth repeating. Here’s the process I use.

Upon investing in my new positions, I set up my spreadsheet to track all trailing sell stop points on the basis of day-end closing prices only in the case of ETFs. In other words, I treat my ETF holdings no different than my mutual fund ones in the sense that I want to see the 7% sell stop limit violated by the closing price of the day before taking any action.

Only after that has occurred, will I enter my order to sell the next trading day. In the case of ETFs, I never enter a stop loss order ahead of time since it has shown that intra-day moves can stop you out with the trend subsequently resuming.

Executing stops are not a clear cut black and white type scenario. Let’s say, at sometime in the future, based on the closing price, one of my holdings is down from its high -7.10%, which would indicate a sell the next day.

Since the 7% level has barely been broken, I may watch market activity for another day or so to see if there is a rebound. If there is, I will hold on to this position; if there is not, I will pull the trigger.

You need to look at the sell stop points not just as a hard number but a guide for you to determine whether action is warranted. That’s why the final price maybe slightly better or worse than the 7% loss objective due to market conditions.

Remember, depending on when your sell stop gets triggered, the goal is to limit your losses and avoid going down with a possible trend reversal. On the other hand, if the trend continues upwards for a few months before reversing, this little technique will tell you when it’s time to get out and cash in your profits.

To sum it up, using trailing sell stop points will do two things for you:

1. They will limit your losses in case the trade goes against you, and

2. They will lock in your profits if prices continue to rise until the trend ends.

Sunday Musings: Trend Following At Its Finest

Ulli Uncategorized Contact

Not too long ago, I reviewed Michael Covel’s book “The Complete Turtle Trader,” which detailed the teaching of a trend following strategy, or trend tracking as I like to call it, by Richard Dennis.

As you may recall, Richard, a wealthy Chicago trader, decided to teach randomly selected students the art of unemotional trend following and proving in the process that successful investment skills could be taught to anyone.

Prior to that review, I had read Michael Covel’s book “Trend Following,” which is a masterpiece on the subject and features many techniques which I have used myself over the past 20 some years. If you have come to the conclusion that trend following is the way to go with your investments, you owe it to yourself to read this 400-page mother of all investment books. Here’s what you can expect to find out:

For more than 30 years, one trading strategy has consistently delivered extraordinary profits in bull and bear markets alike: Trend Following. Just ask the billionaire traders who rely on it…traders like John W. Henry, whose trading profits bought the Boston Red Sox!

Michael Covel goes right to the source, presenting powerful insights straight from the world’s top trend followers, and debunking Wall Street myths and misinformation from well-known pros who ought to know better. You’ll learn how to manage risk, employ market discipline and, when the moment is right, swing for the home run.

Keep in mind that there are different ways to incorporate a trend following strategy. Many of the featured top pros are CTAs (Commodity Trading Advisors), who use leverage with their approach to obtain superior results. However, you can apply many of the methodologies in a more conservative manner, as I do, and use these same techniques with no load mutual funds and ETFs.

No matter which way you go, the key issues remain discipline and controlling market risk, which every successful trend follower will use with utter abandon. Despite me having used many of the approaches in my advisor practice for a long time, I found this book invaluable in clarifying my own thoughts and, at the same time, be a guide to further improving my system.

The Dangers Of Ultra-short Bond Funds

Ulli Uncategorized Contact

It’s pretty much a given that, every time our Trend Tracking Indexes (TTIs) have us out of the market and in money funds, somebody (a client or a reader) will ask if we can’t use the idle cash to buy some ultra-short bond funds to enhance returns.

There are reasons why I don’t get involved in those types of securities, some of which have been addressed in “Broken Bonds,” by MarketWatch:

When it comes to investing, there are times when boring is good, when the idea is to find a safe haven in a fund that does a simple job, easily and without flash, the kind of mutual funds you can hold without fear of what happens the next time you look at your statement.

For more than a year now, however, investors who have parked money in ultra-short duration bond funds have come away feeling like their investment vehicle has been vandalized while their cash was parked.

Over the past 12 months, the average ultra-short bond fund is off 1.66%, according to fund-tracker Lipper Inc. So far this year the situation is uglier, with the average fund in the category losing around 2.2% of its value.

For some of these funds, however, damages have been far worse. SSgA Yield Plus is down 30% in 12 months through May 8. Meanwhile, Schwab YieldPlus has lost almost 29%, and Fidelity Ultra-Short Bond has taken a 12.9% haircut.

For an ultra-short bond fund, that’s as ugly as it gets. For investors, it’s important to know how this happened and how a fund that is supposedly so safe can turn out to be so dangerous.

The cause of the problems should be obvious even to casual investors, namely the subprime credit-crisis; the troubled ultra-short funds typically hold a big slug of asset-backed securities tied to the performance of the housing market.

When the housing market went into the tank, it took housing securities with it. Many institutional investors who had bought similar securities — including some hedge funds — had to either sell these investments or shut down; they opted for the former and flooded the market with notes, dropping prices even further.

Investors today clearly recognize the danger in subprime asset-backed securities, but before all of the trouble started, these securities were considered safe enough to fit into the investment profile of a risk-averse fund like an ultra-short. Money managers looking to squeeze some extra returns from the market went down the slippery slope towards subprime debt supported by the ratings agencies such as Standard & Poor’s and Moody’s Investors Service, which had test-driven the securities and given them appropriate ratings. Managers thought they were within their designated safety parameters.

So much for perceived safety! I have found over the past 25 years that when our Trend Tracking Indexes, especially the domestic one, are below their long-term trend lines, we are without fail living in times of great uncertainty.

The markets are in bear territory heading further south or aimlessly meandering and going nowhere. During that period, it’s important not to have any market risk with your idle cash. Yes, it’s tempting to try to spruce up the yield a little bit, but it simply is not worth the extra risk as many have found out over the past year.

After the bursting of the tech bubble in 2000, or now in the midst of the Subprime/credit/housing crisis, the theme remains the same: Safety of your portfolio comes first, and investments are made with clearly defined entry and exit points to control the risk.

If you want to be totally out of the market, safely on the sidelines and isolated from any risk, ultra-short bonds are not the tool to use; U.S. Treasury only funds are.

No Load Fund/ETF Tracker updated through 5/15/2008

Ulli Uncategorized Contact

My latest No Load Fund/ETF Tracker has been posted at:

http://www.successful-investment.com/newsletter-archive.php

Upside momentum pushed our domestic Trend Tracking Index out of the neutral zone and into buy mode effective Thursday, May 15, as announced.

Our Trend Tracking Index (TTI) for domestic funds/ETFs has now moved to +2.63% above its long-term trend line (red):


The international index improved but remains -0.78% below its own trend line, keeping us still on the sidelines.


For more details, and the latest market commentary, as well as the updated No load Fund/ETF StatSheet, please see the above link.

Domestic Buy Signal Generated

Ulli Uncategorized Contact

Today’s tame CPI report (+0.20% vs. an expected +0.30%) provided enough ammunition for the bulls to drive the major indexes higher. As details about the CPI report became public, namely that gasoline prices fell 1.8% in April, the trading floor erupted with laughter. That goes to show that traders have a sense of humor just like you need to have if you hear numbers like that.

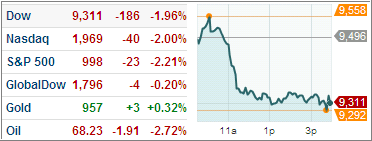
Although the rally faded during the afternoon session (see MarketWatch chart above), the gains were enough to keep our domestic Trend Tracking Index (TTI) above the neutral range with a reading of +1.72%, unchanged from yesterday’s close.

This now constitutes a new Buy signal for diversified domestic equity funds effective tomorrow, Thursday. While we can never be sure if this trend will continue, I will now ease into the market with about 1/3 of portfolio value. Most important after the purchase are my stop loss points.

I will use a 7% trailing stop loss on all positions on a day-end closing price only. Therefore, a sell signal will be generated, if my holdings violate the stop loss points or if the domestic TTI drops below the lower range of the neutral zone, which is a point -1.50% below its long-term trend line, whichever occurs first.

I will post further updates as necessary.

Staying Above The Neutral Zone

Ulli Uncategorized Contact

Despite a pullback in the market on Tuesday, the domestic Trend Tracking Index (TTI) managed to stay above the upper range of the neutral zone. Its position is now +1.72% above its long-term trend line. If the TTI can remain above the +1.50% level for another trading session, a domestic Buy will be validated, and we will move back into the domestic arena with about 1/3 of our portfolios.

Right now, it appears that the path of least resistance is to the upside, as the past few weeks have shown. Barring any unexpected negative news with the announcement of Wednesday’s CPI, we may find ourselves back in domestic equities in a couple of days.