
ETF Tracker StatSheet
You can view the latest version here.
PRECIOUS METALS SURGE: A HARBINGER FOR EQUITY MARKETS?
- Moving the markets
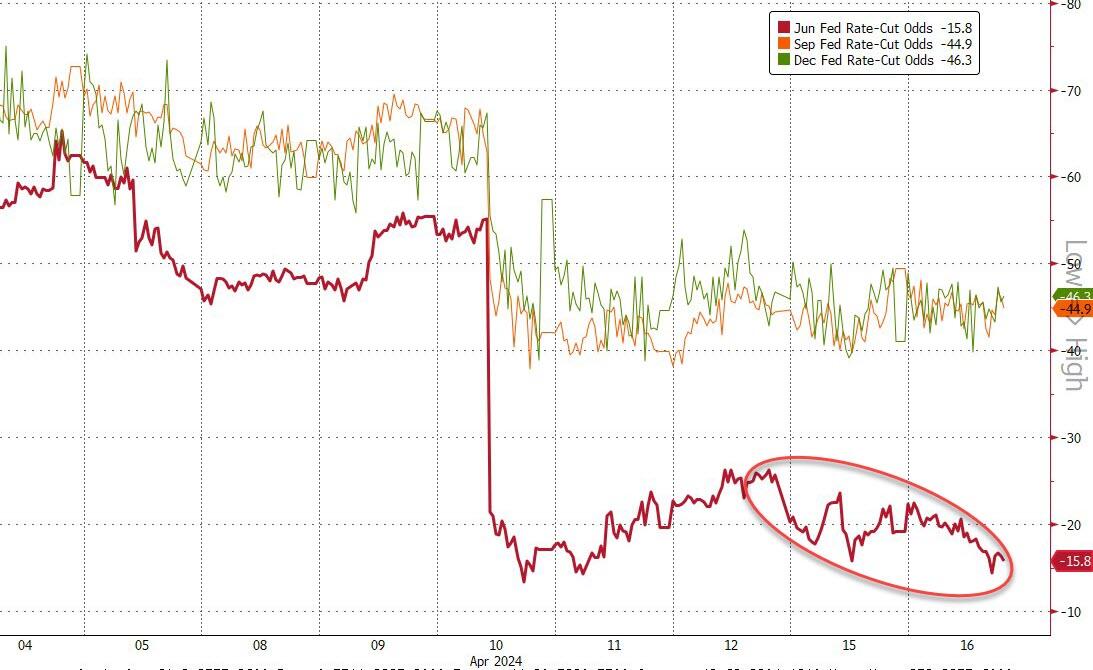
Current economic forecasts suggest that the Federal Reserve may delay any rate reductions until September or later, with some analysts not ruling out the possibility of no cuts throughout the year.
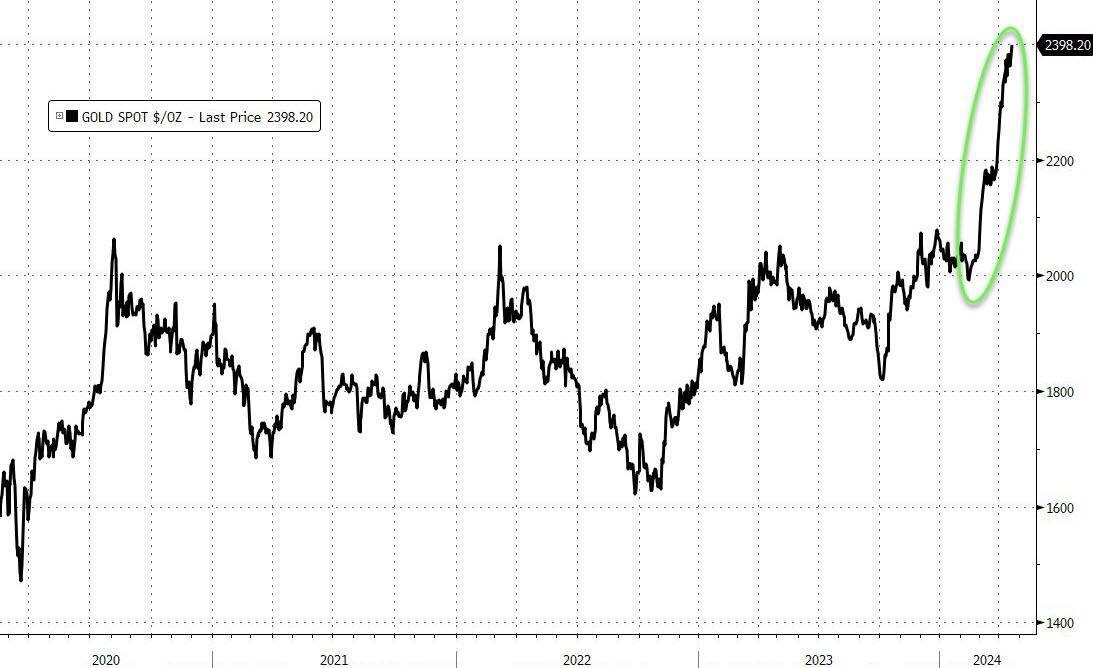
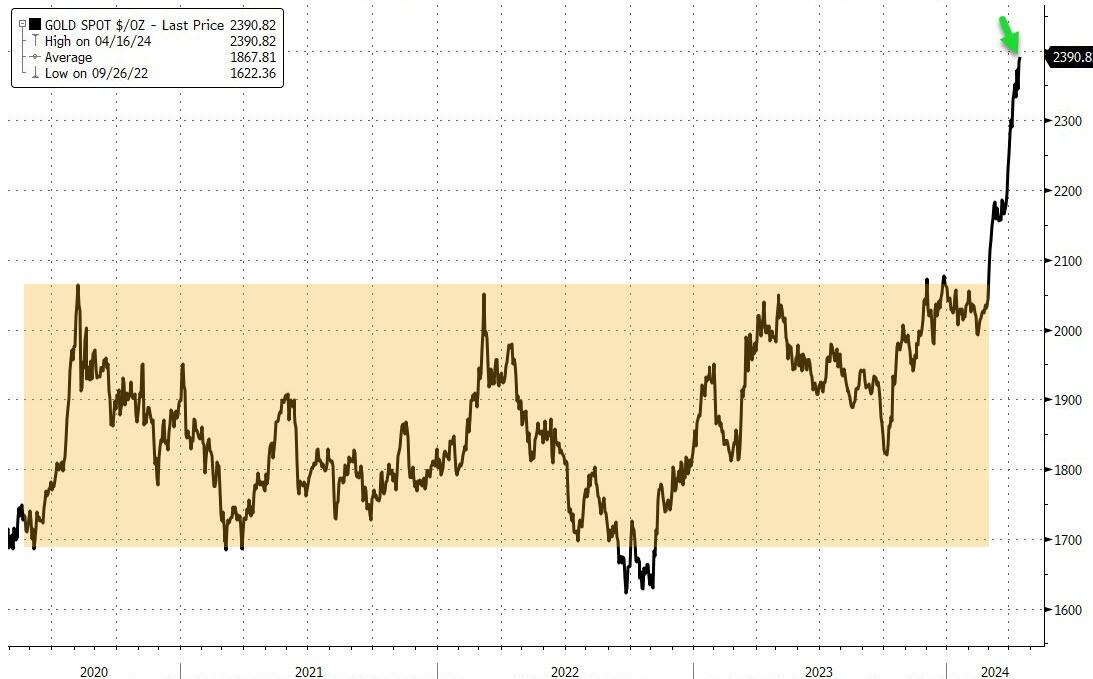
Year-to-date analysis for 2024 reveals that while hard economic data has shown improvement, it has been overshadowed by a notable increase in inflation. This has led to a new all-time high for gold prices. Echoing this sentiment, Federal Reserve spokesperson Goolsbee emphasized the significance of the recent inflation data, suggesting that it cannot be overlooked after three consecutive months of similar trends.
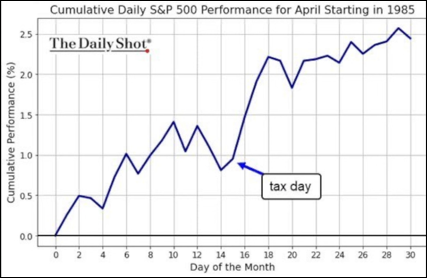
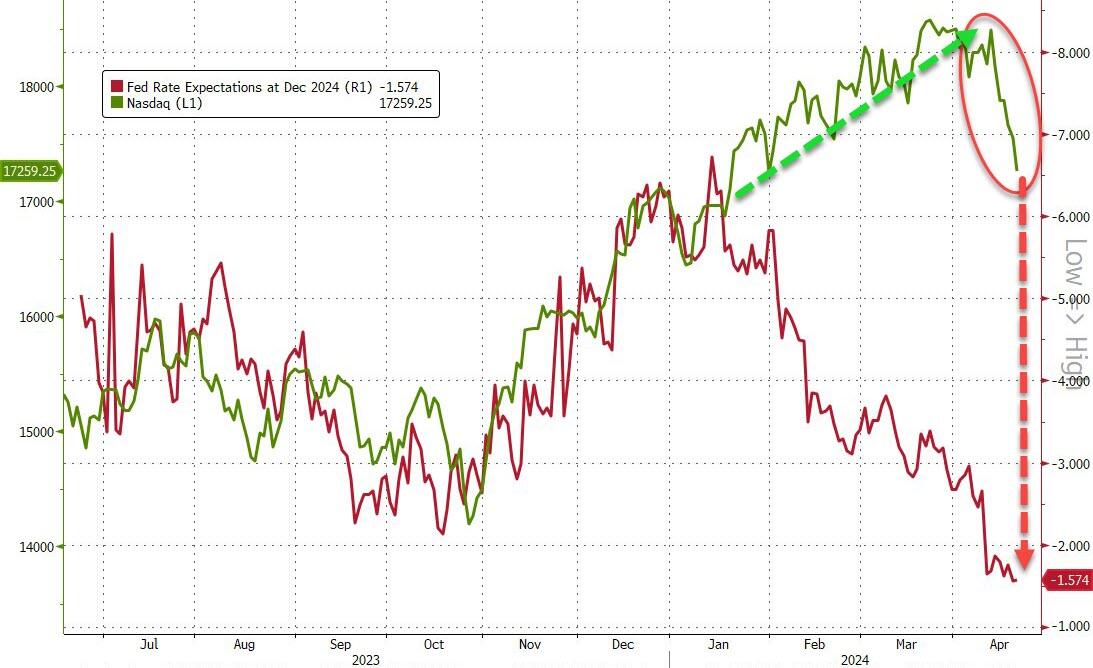
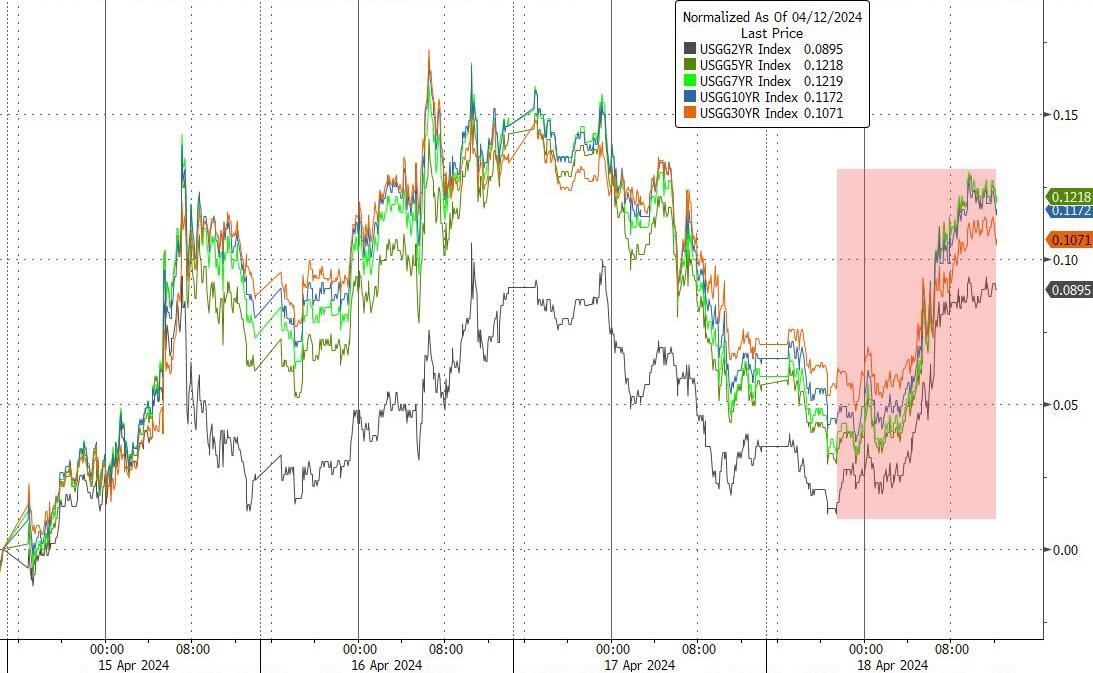
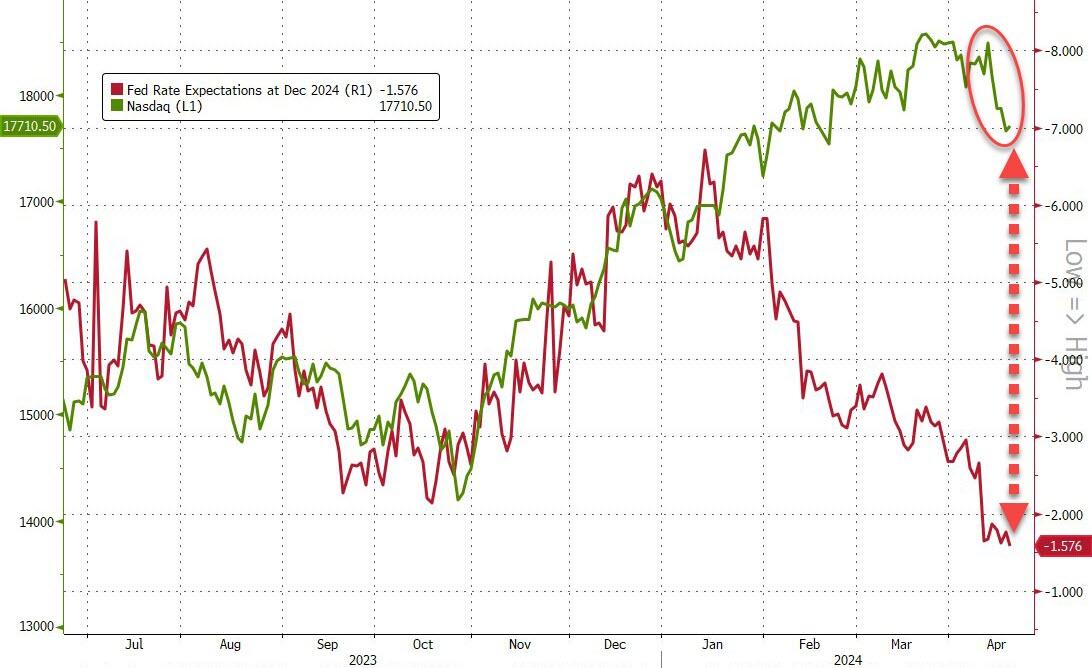
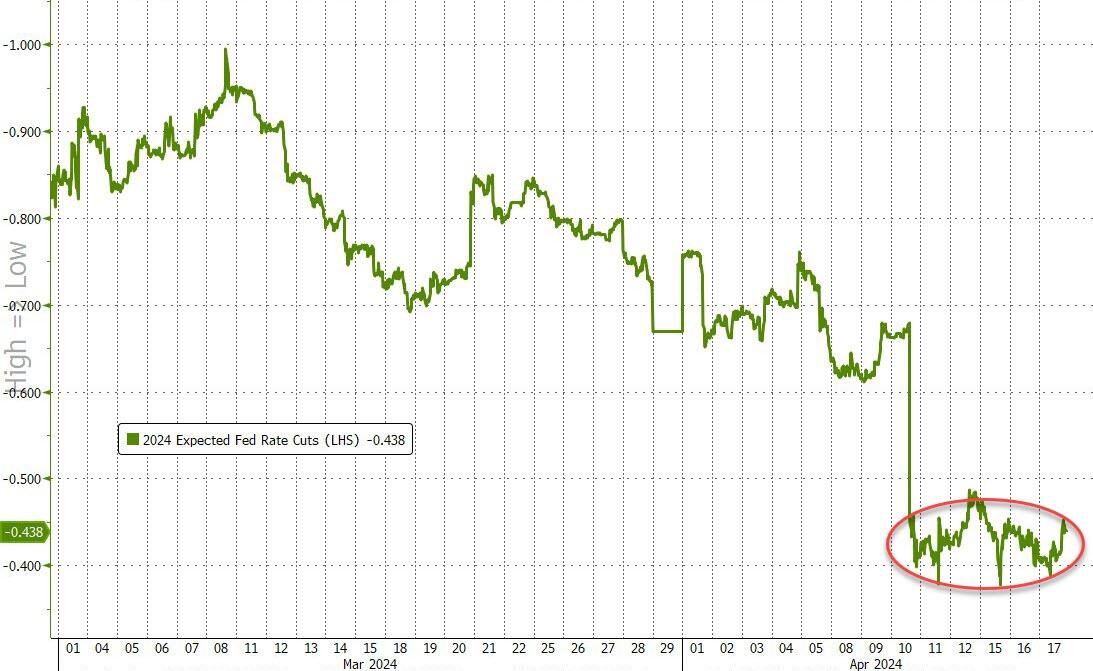
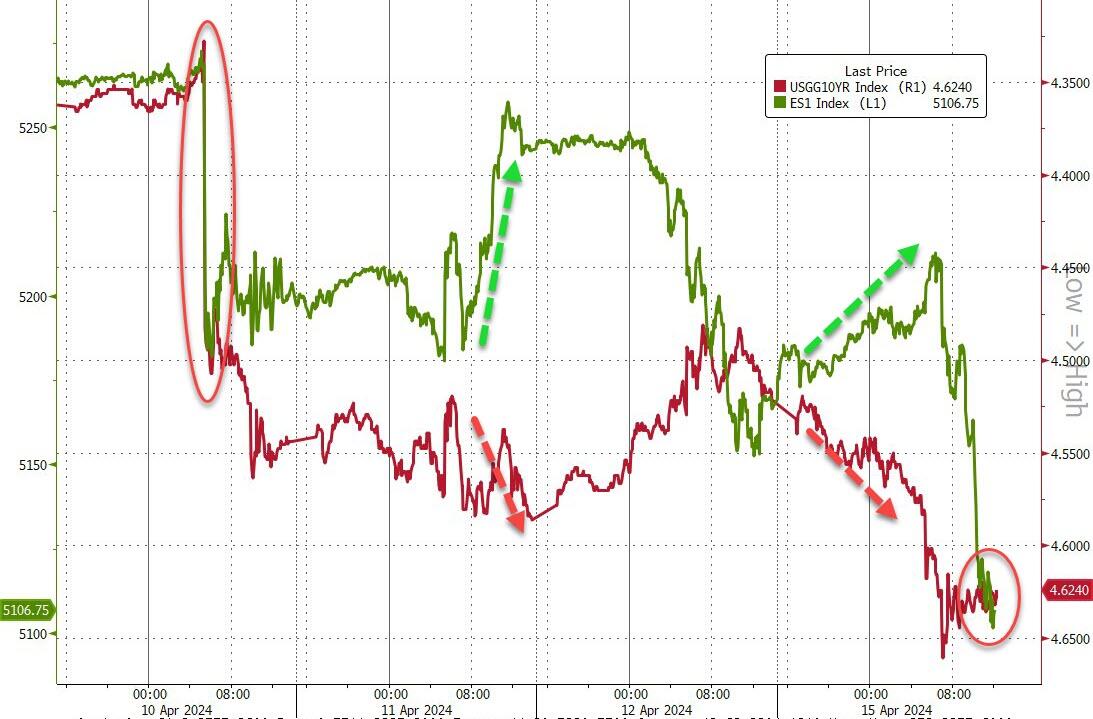
Consequently, market expectations for rate cuts in 2024 and 2025 have diminished significantly this week. This shift in sentiment is clearly illustrated in the accompanying chart, hinting at the potential direction of future rate movements.
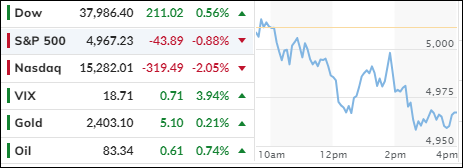
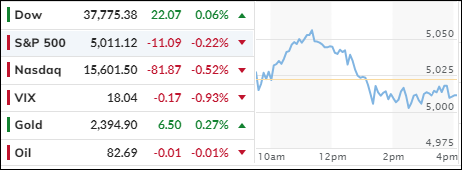
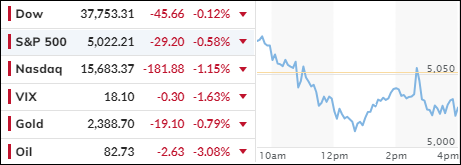
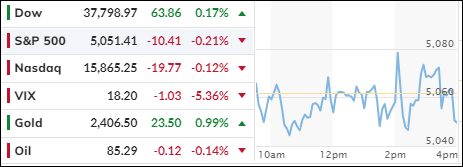
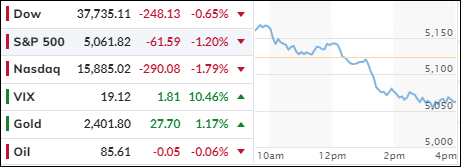
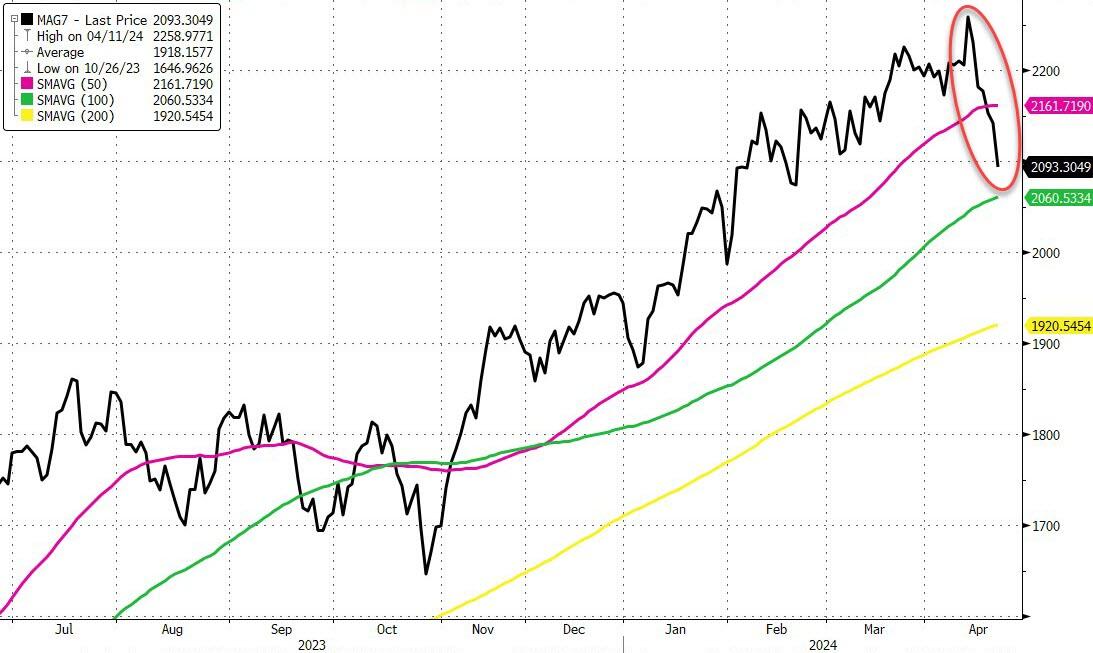
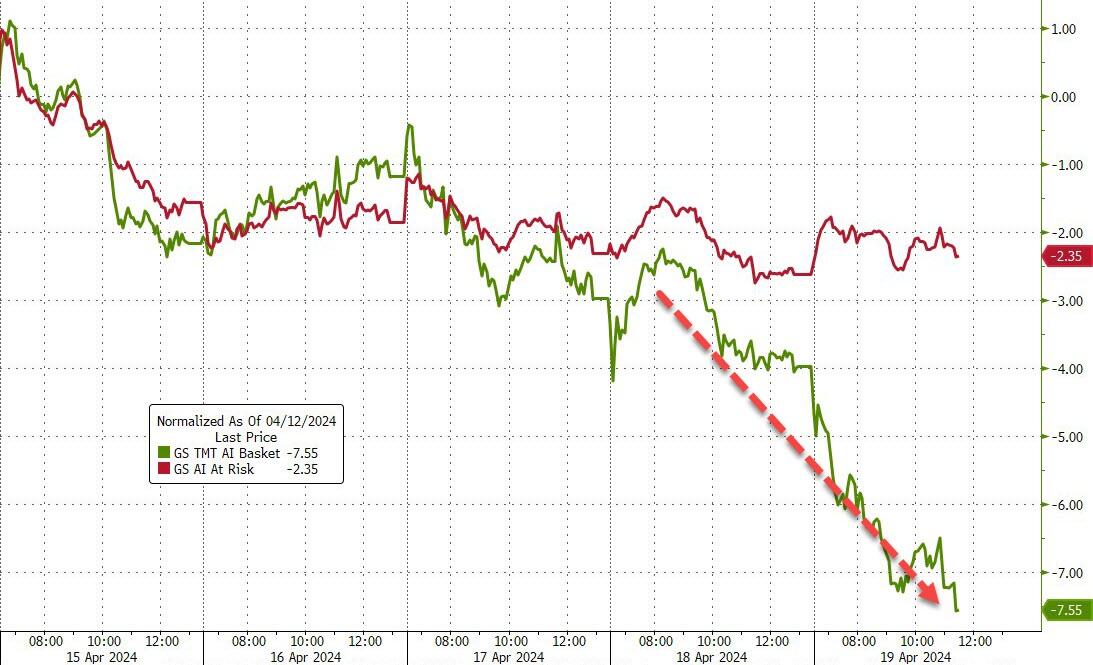
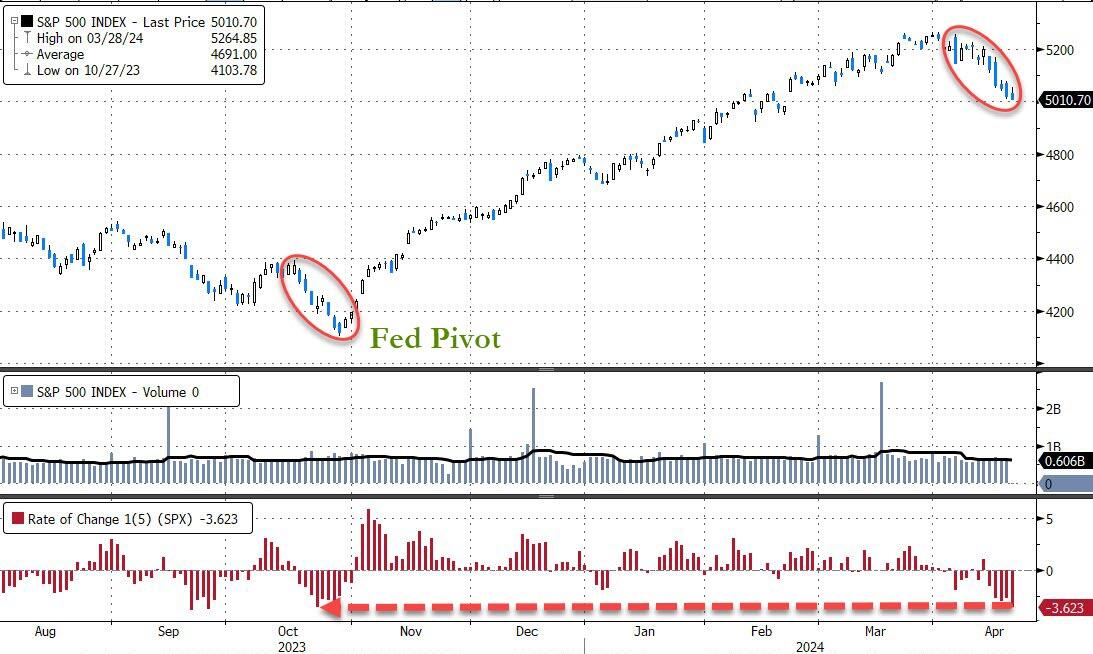
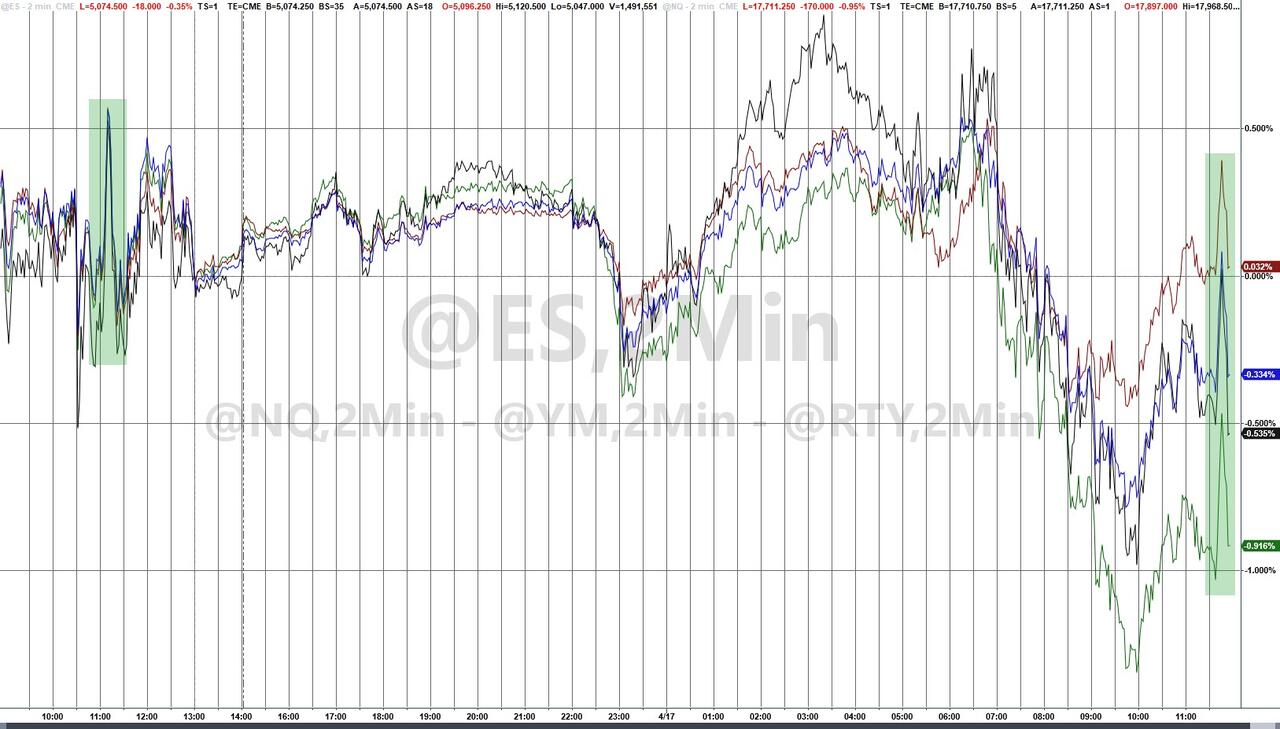
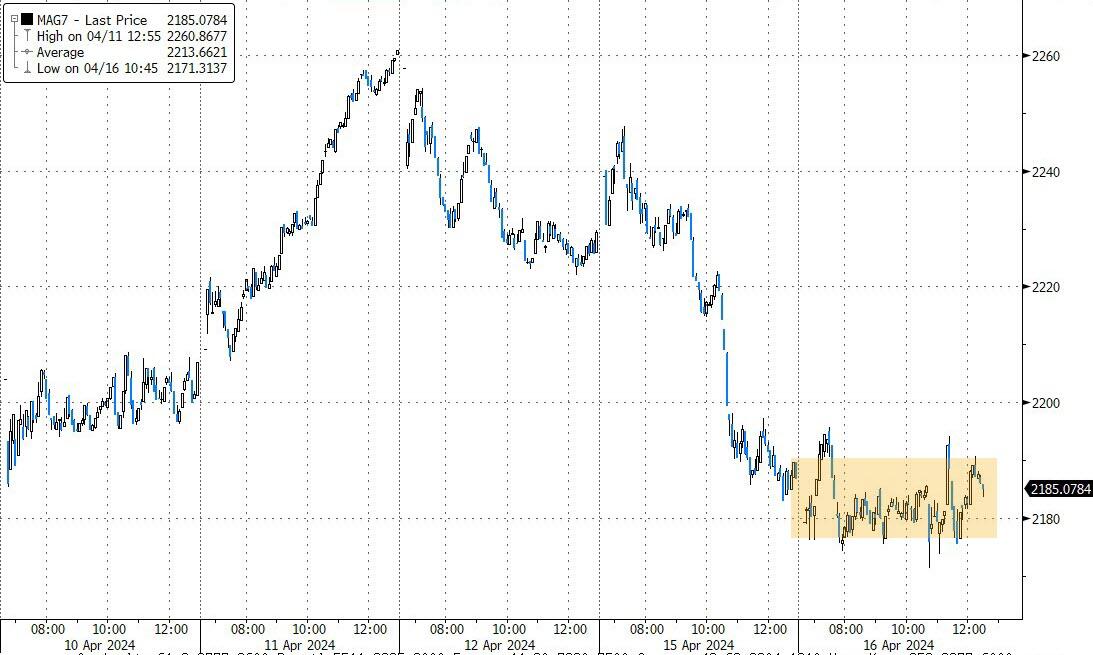
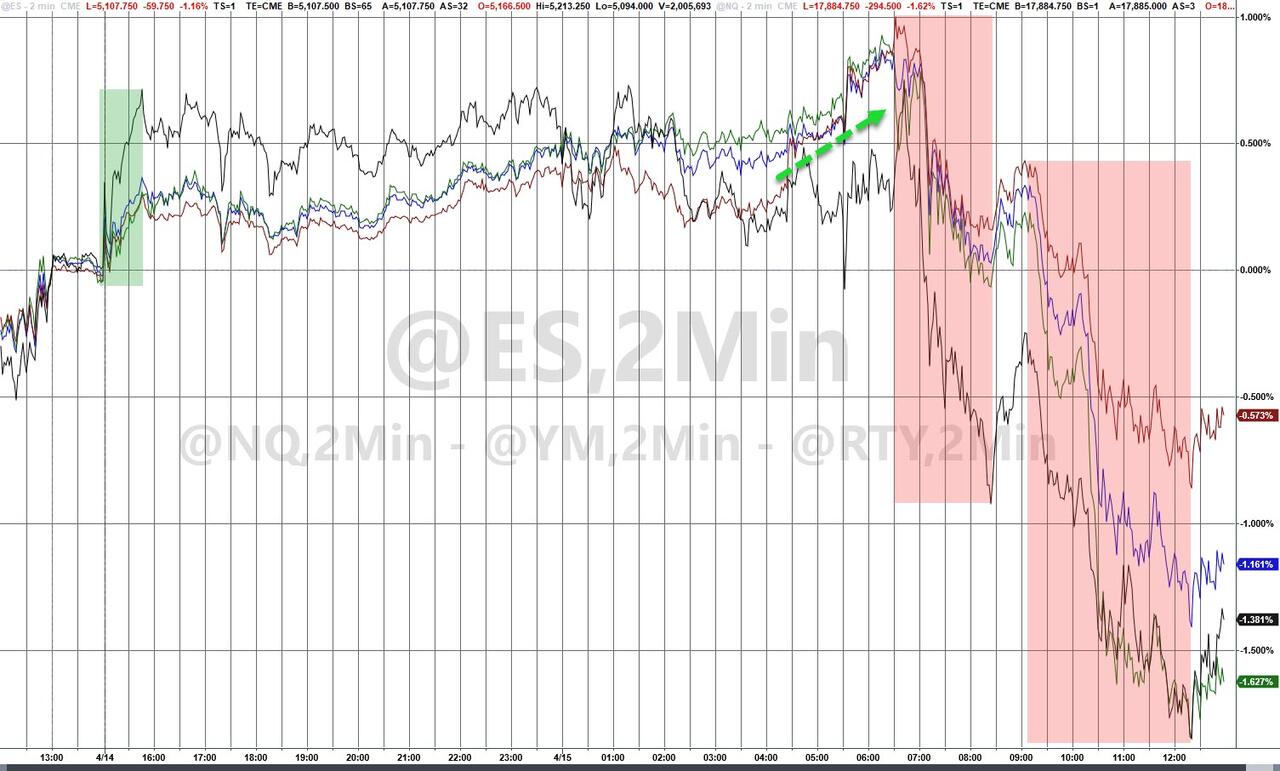
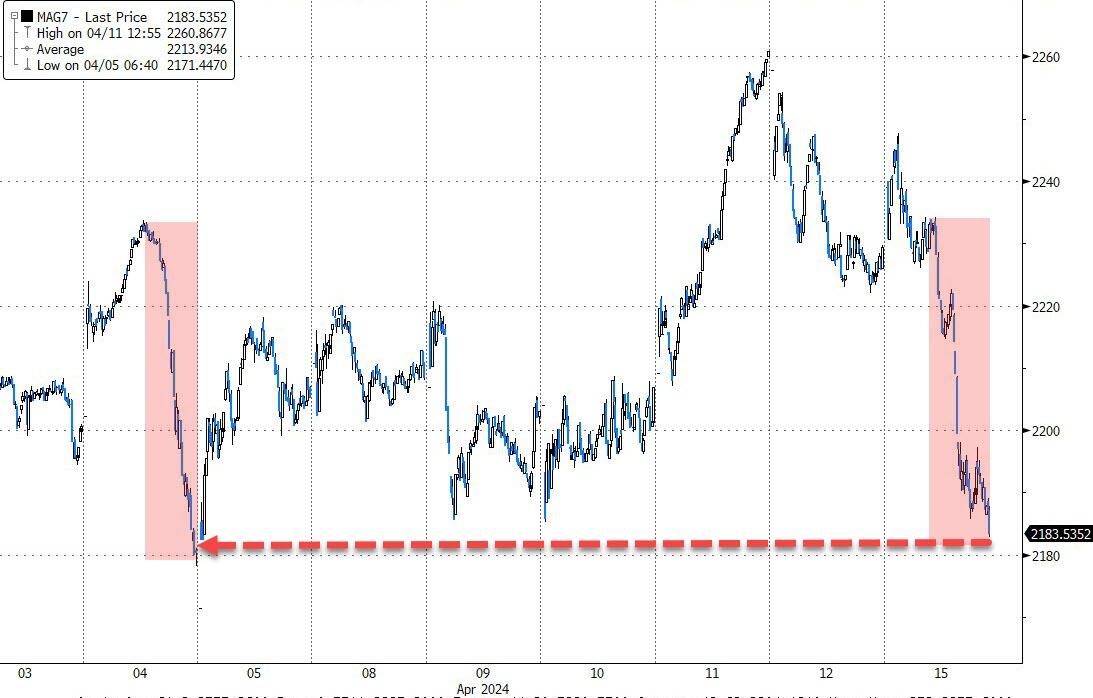
Ultimately, the Dow was the sole major index to achieve a gain, while its counterparts suffered losses. The MAG7 stocks also faced a setback, breaking below their 50-day moving averages, as the broader AI sector continued its decline without breaching its 2021 highs.
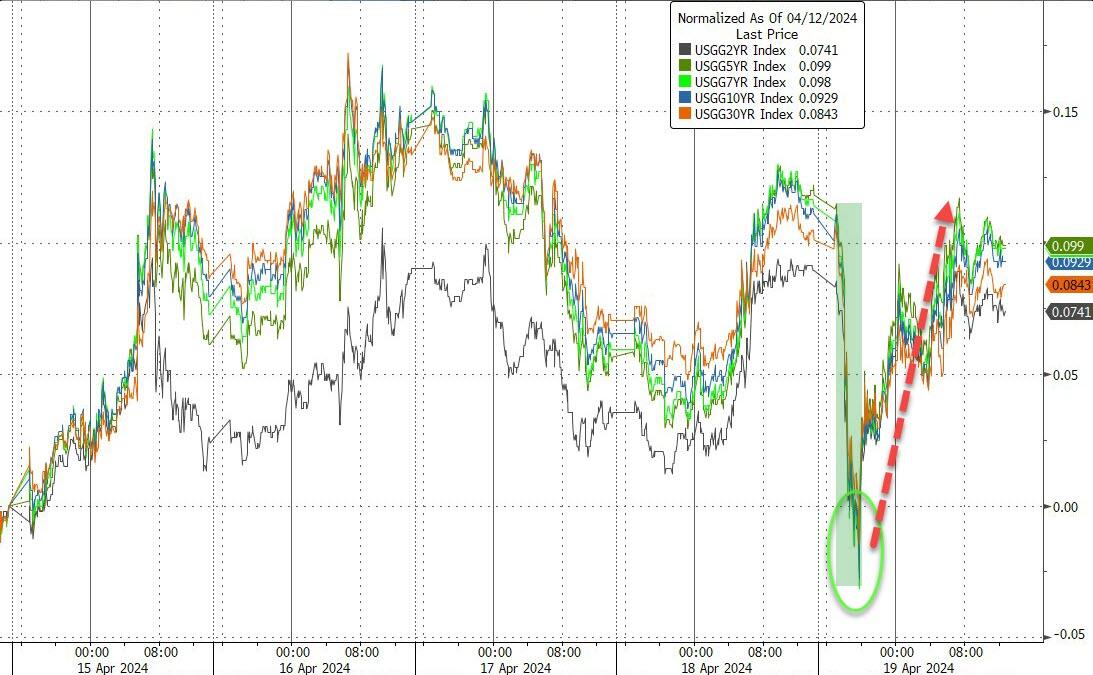
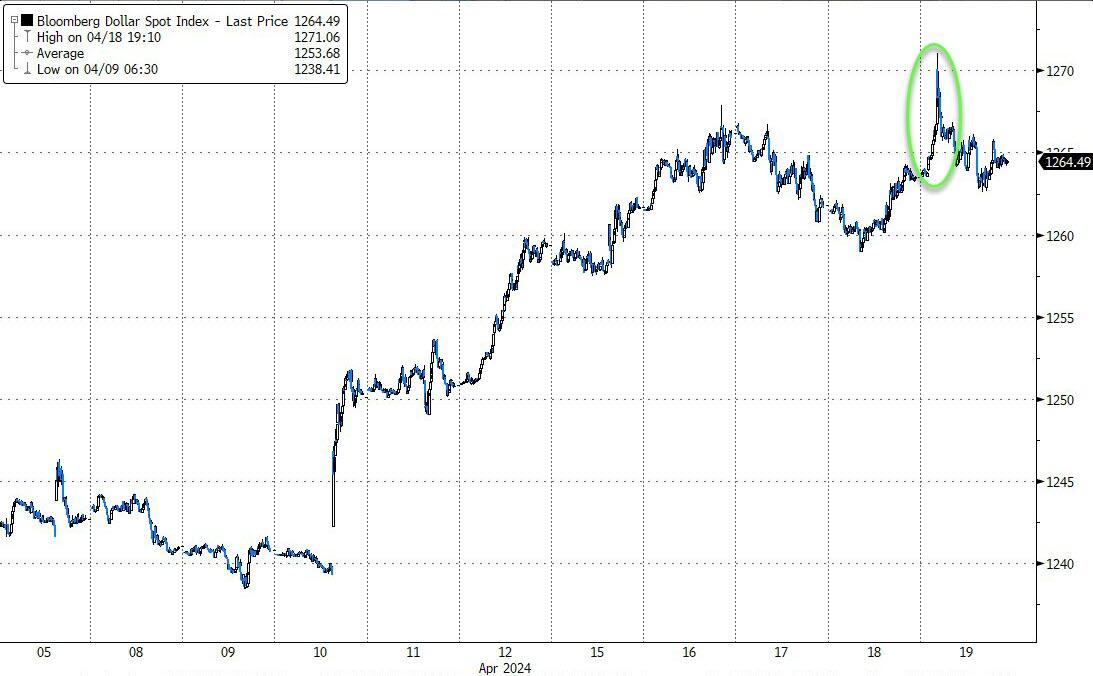
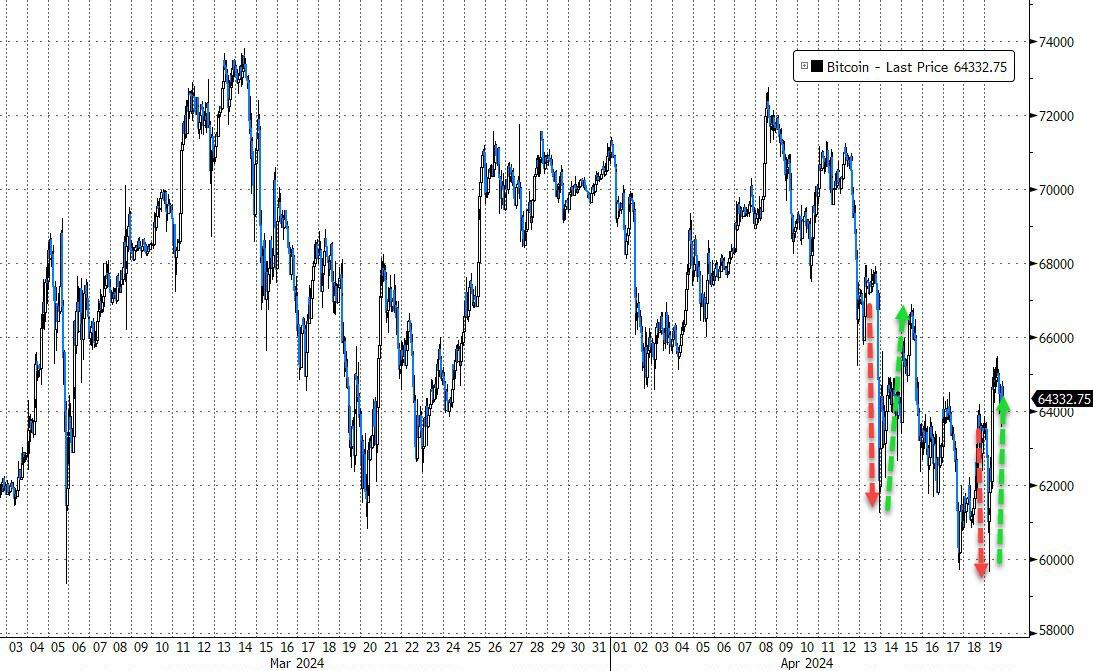
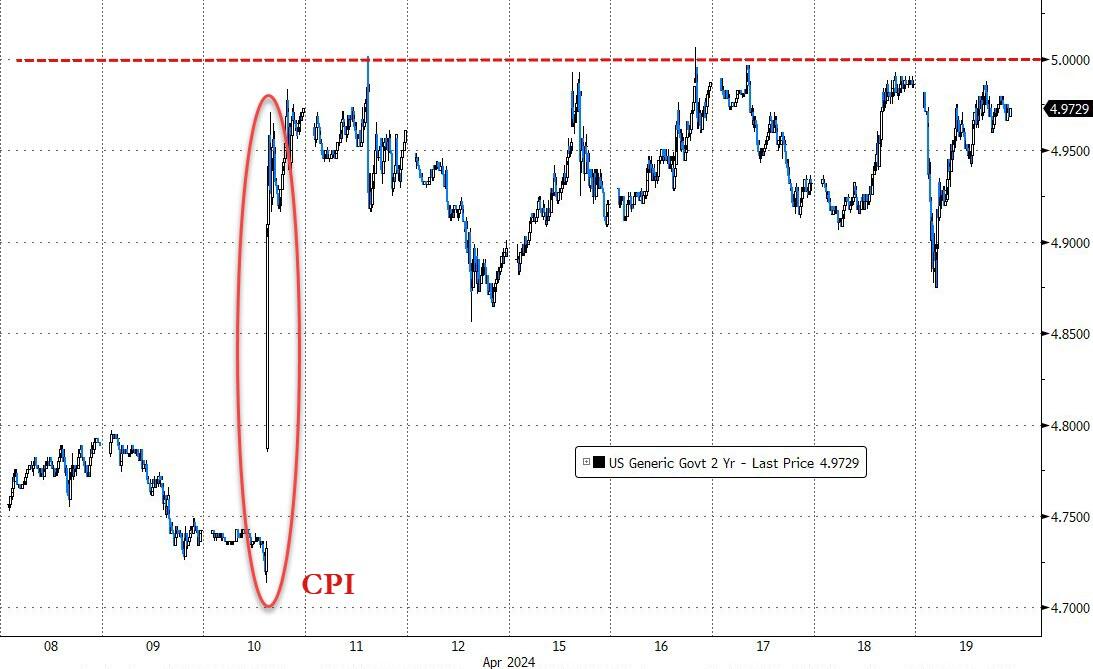
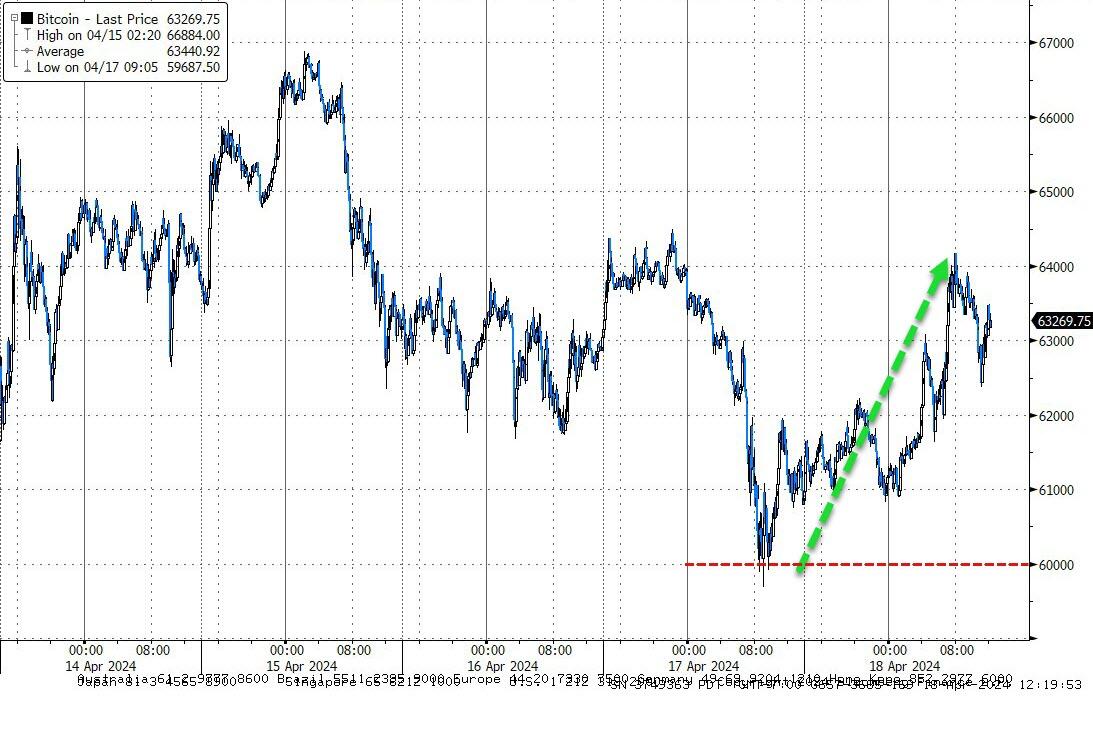
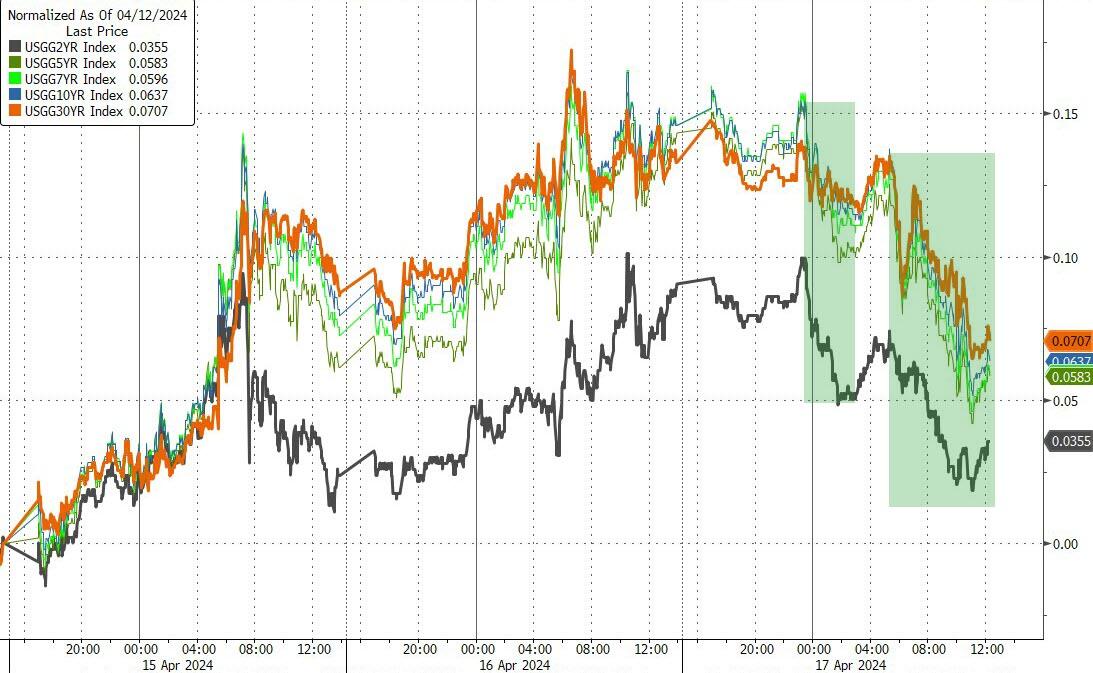
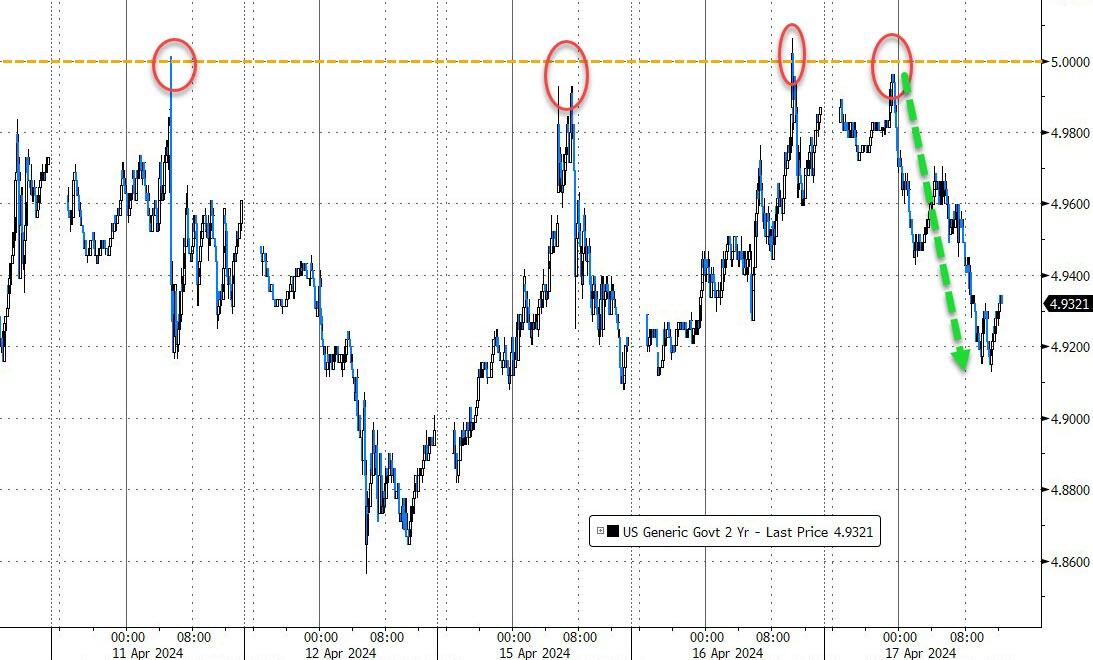
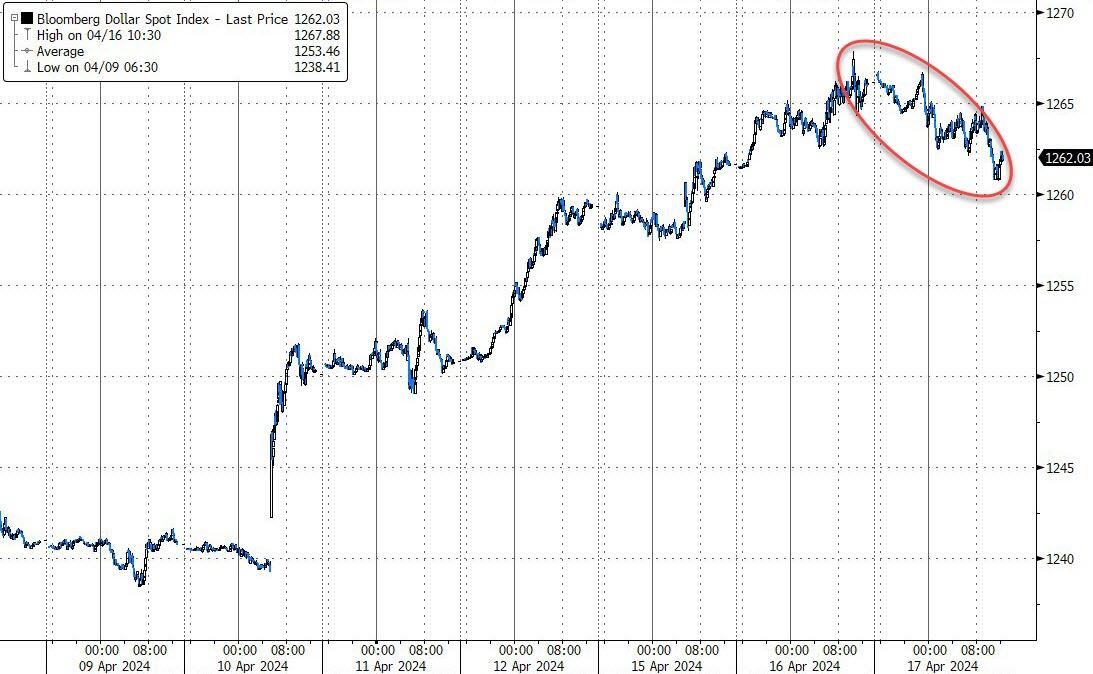
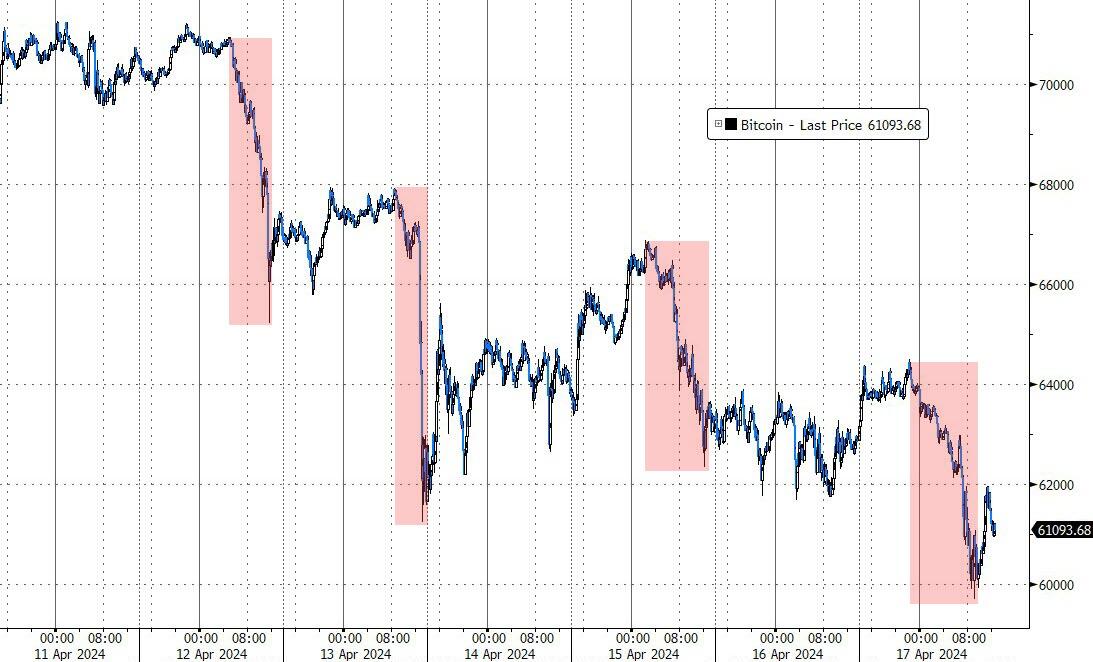
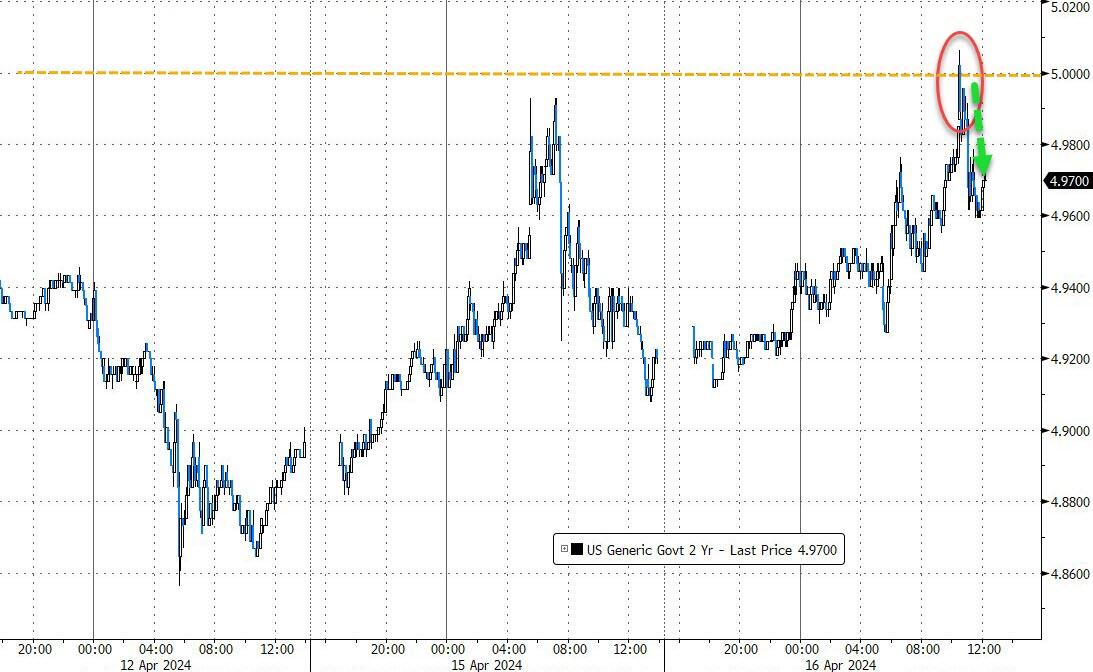
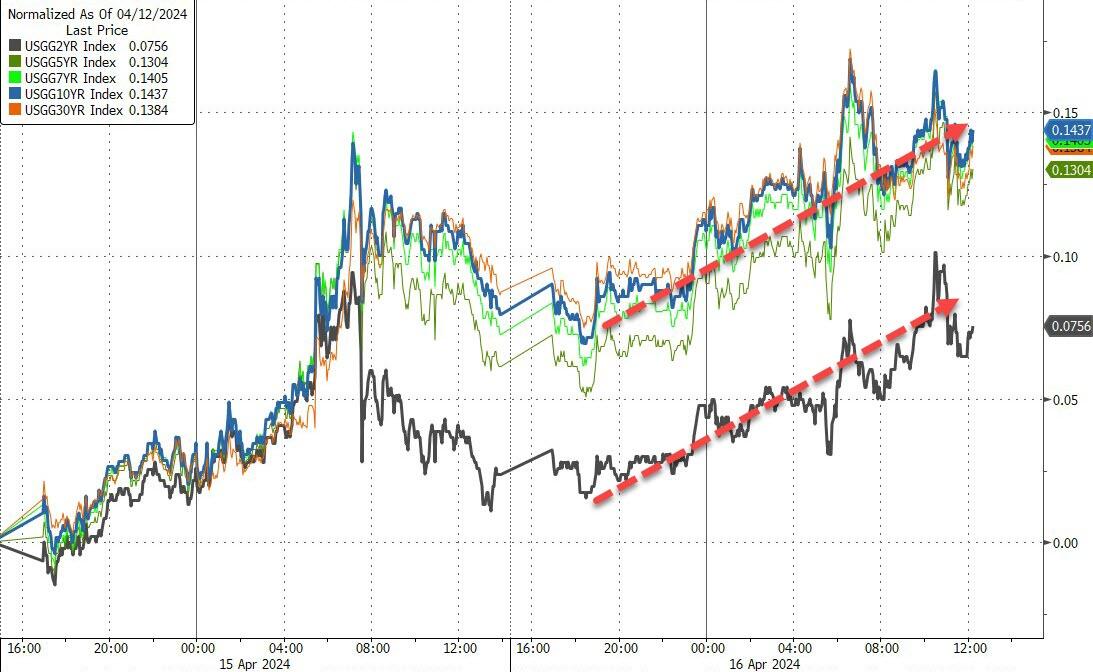
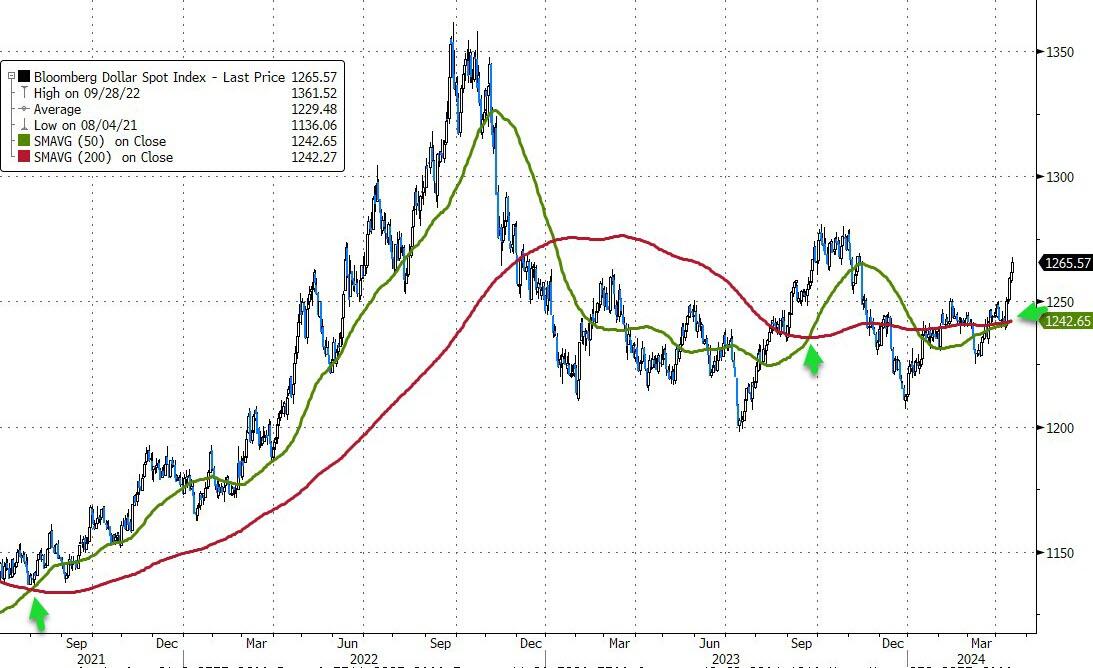
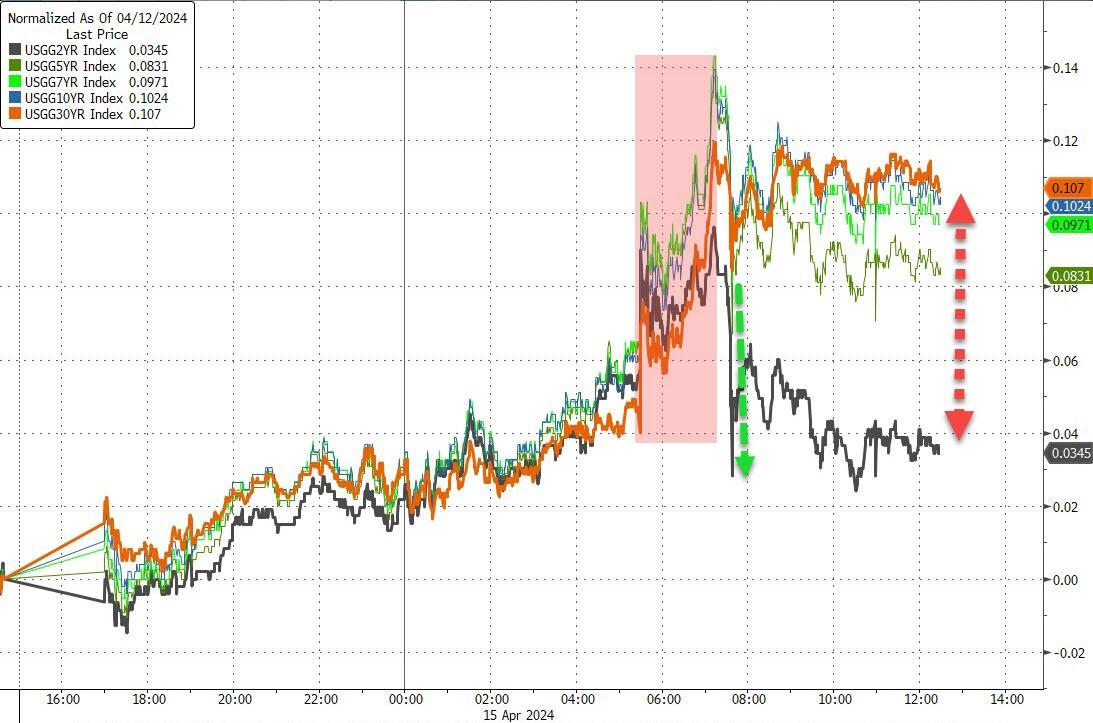
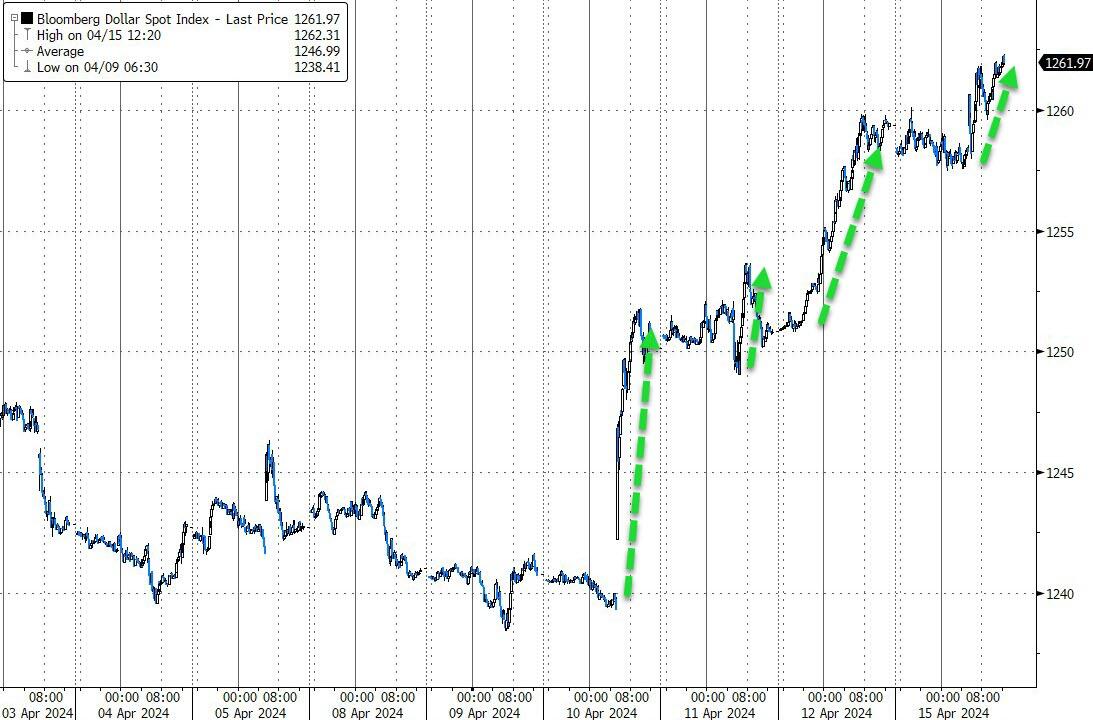
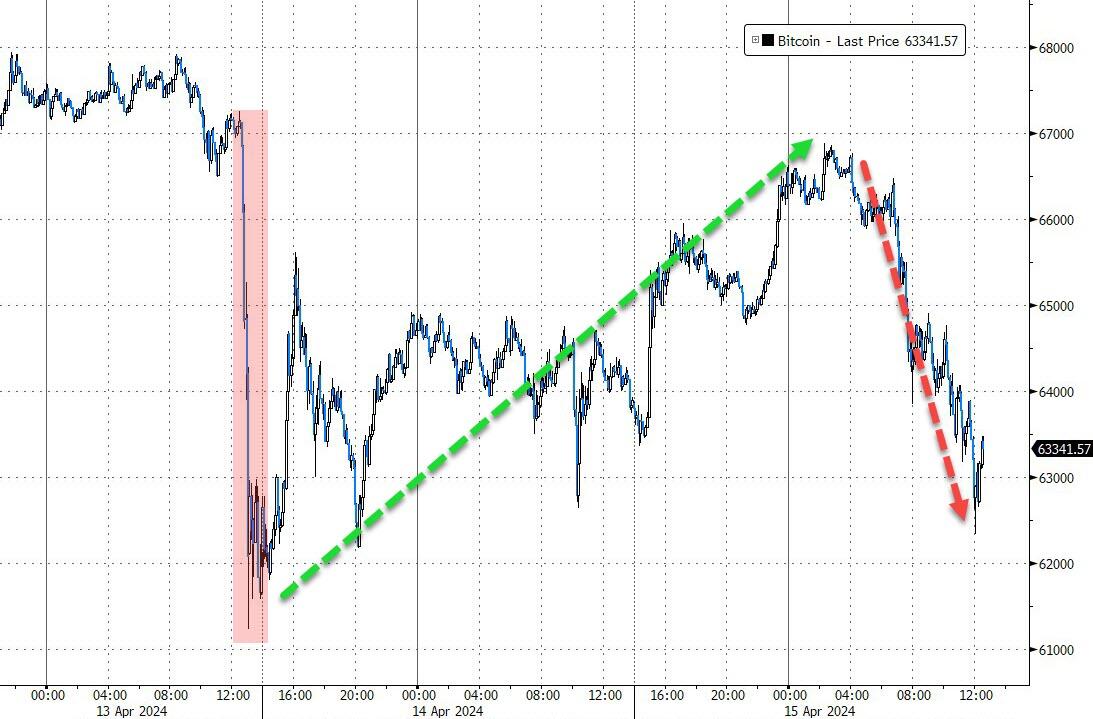
In the bond market, yields rose following an initial drop in response to the Israeli missile strikes. Meanwhile, the dollar experienced its second consecutive week of gains, Bitcoin exhibited volatility ahead of its halving event, and the 2-year yield once again failed to reach the 5% threshold.
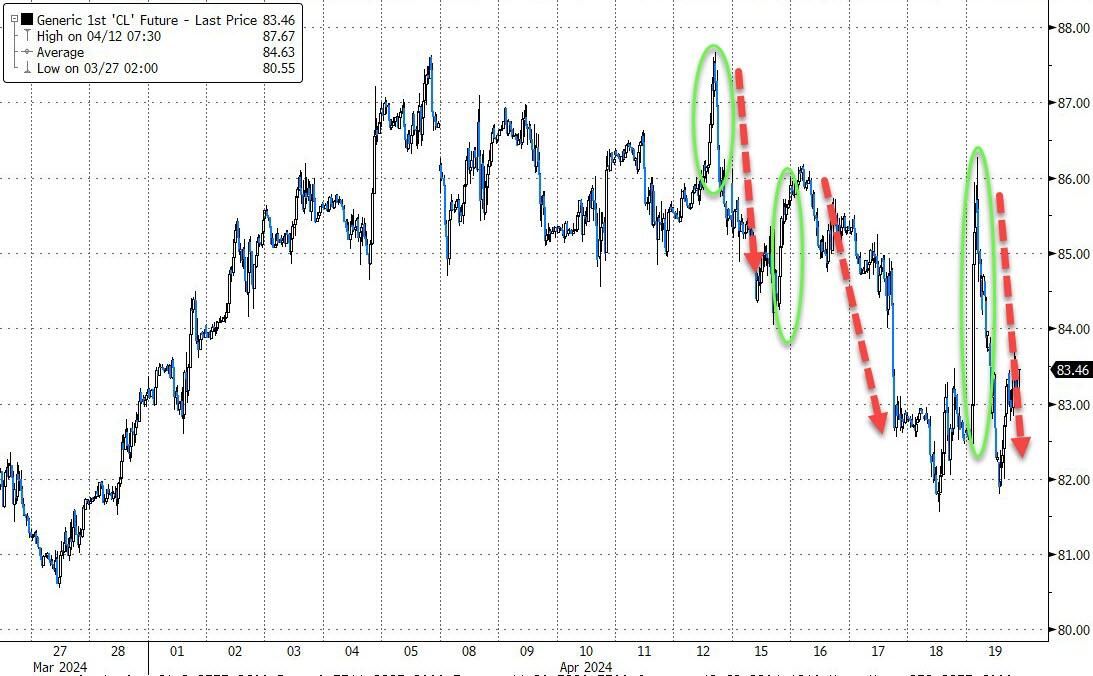
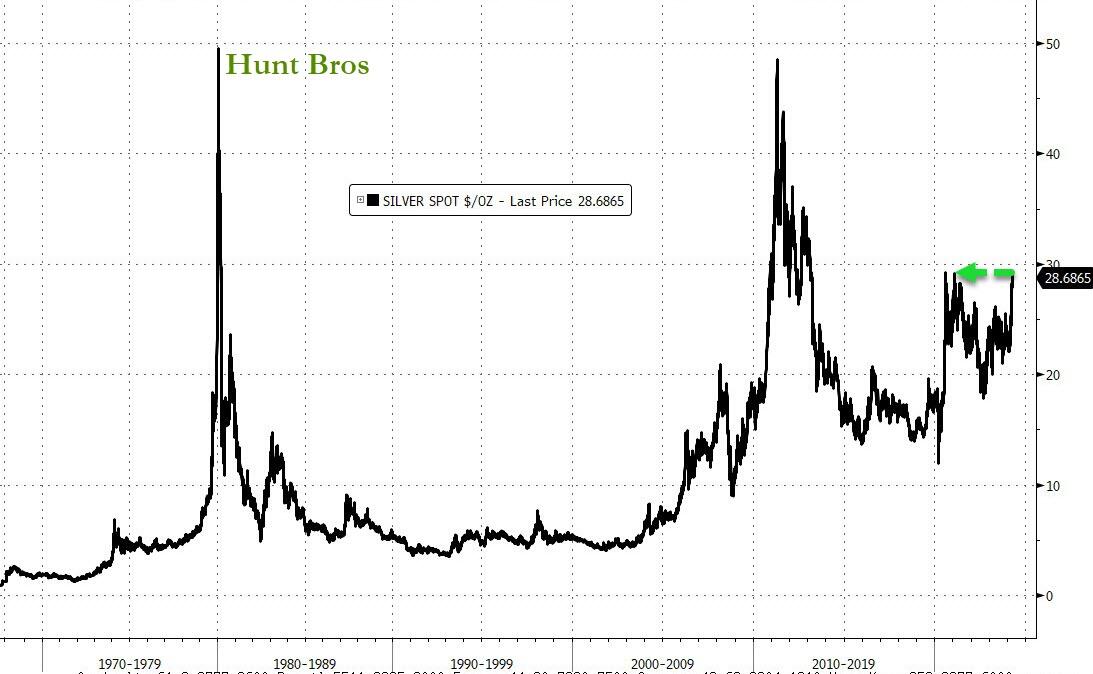
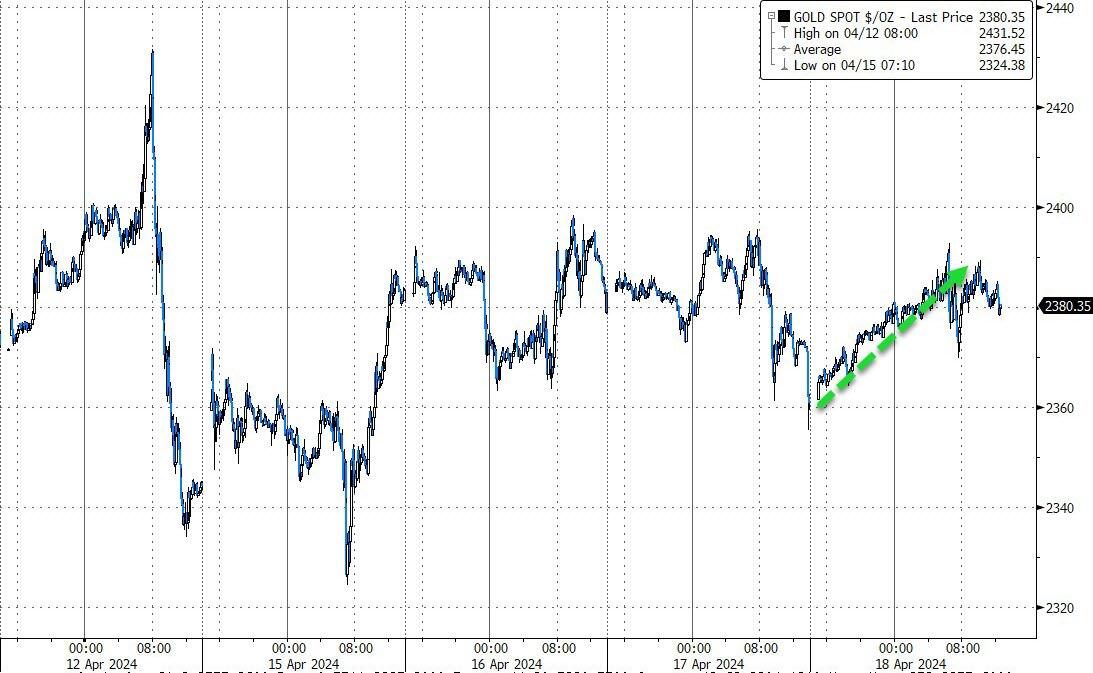
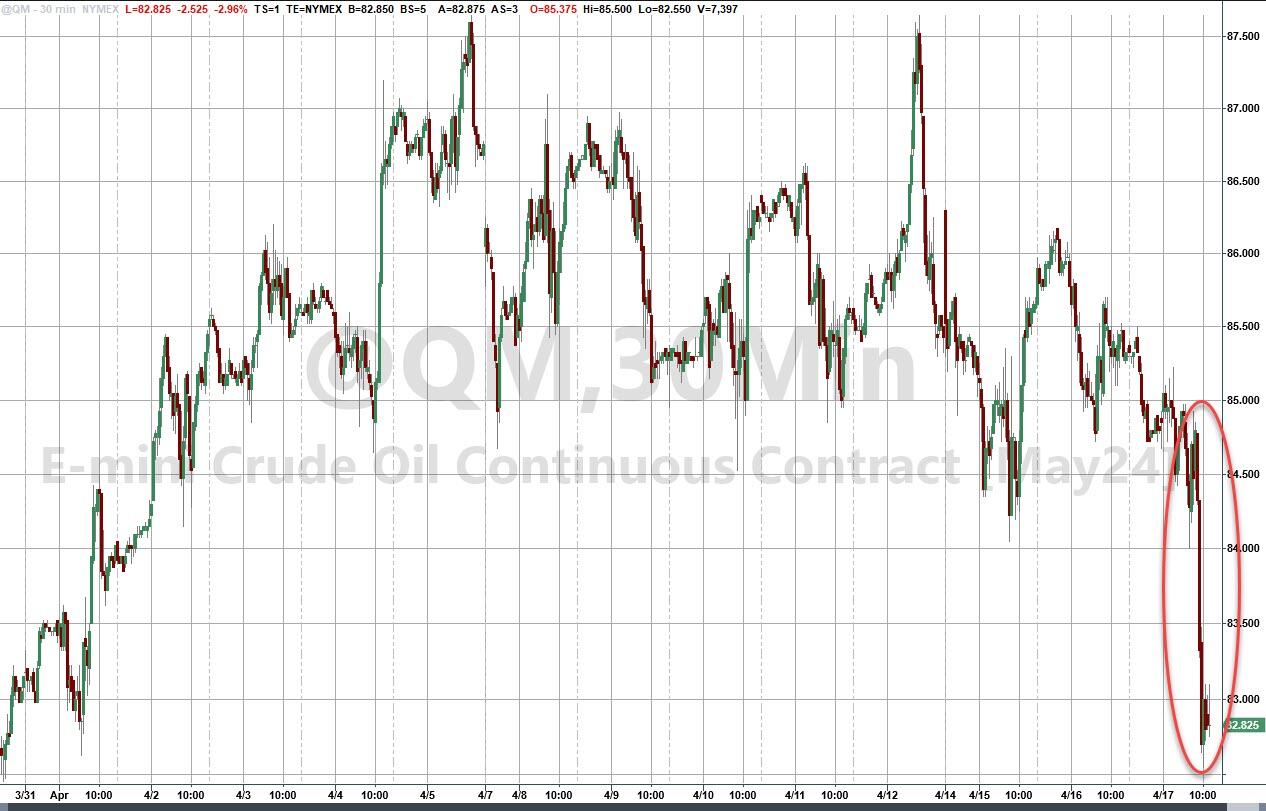
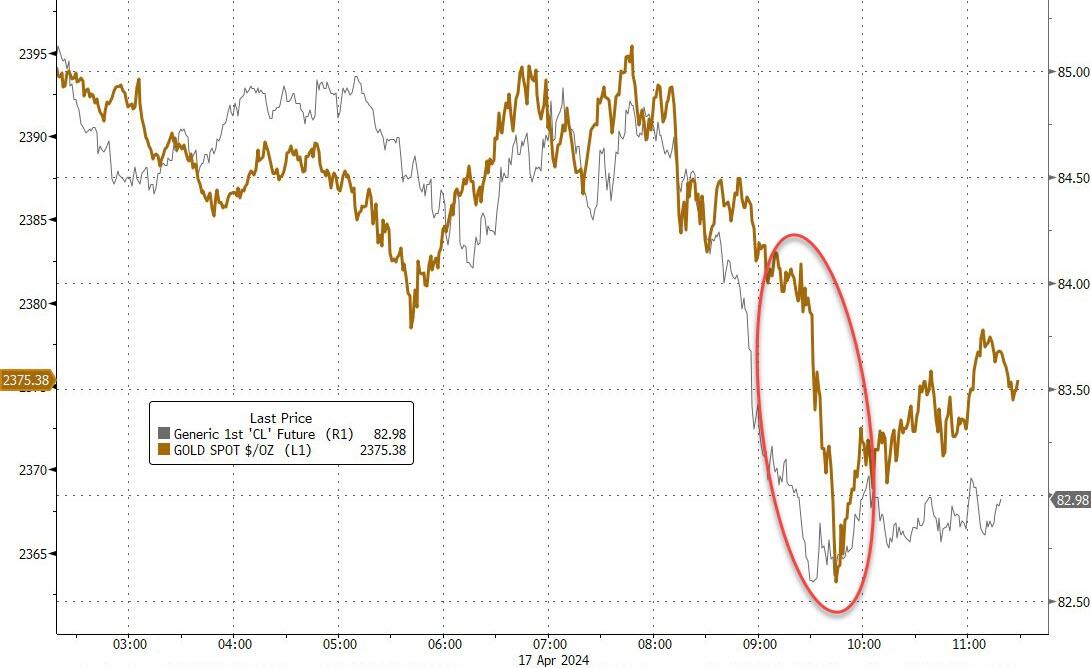
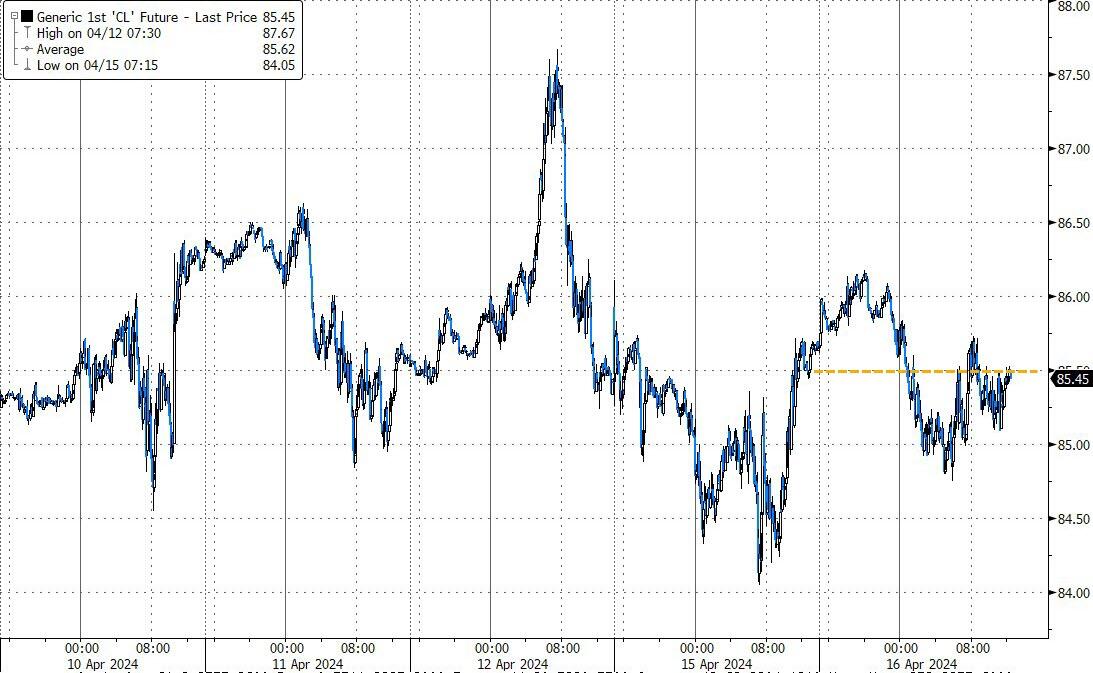
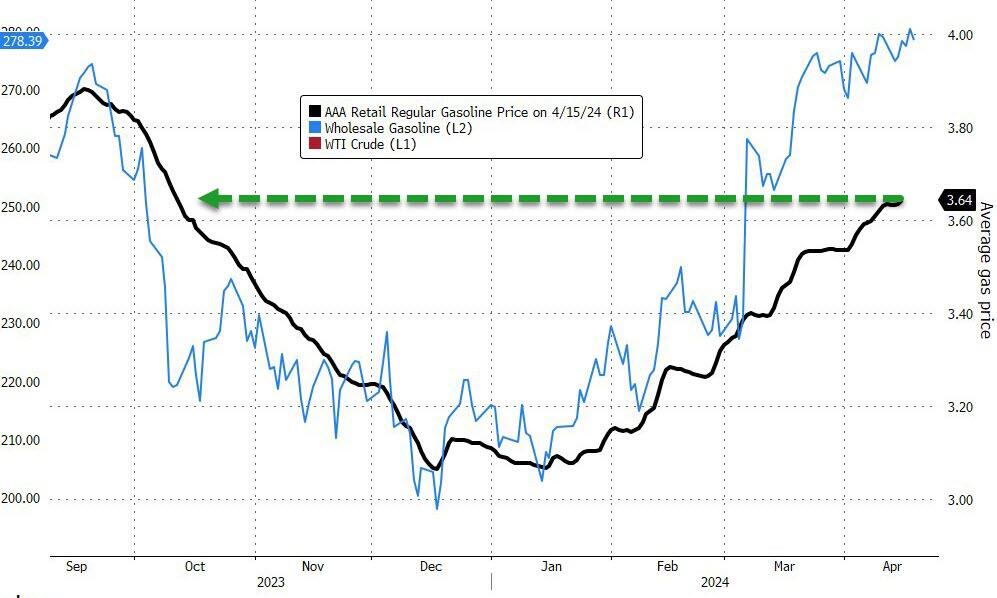
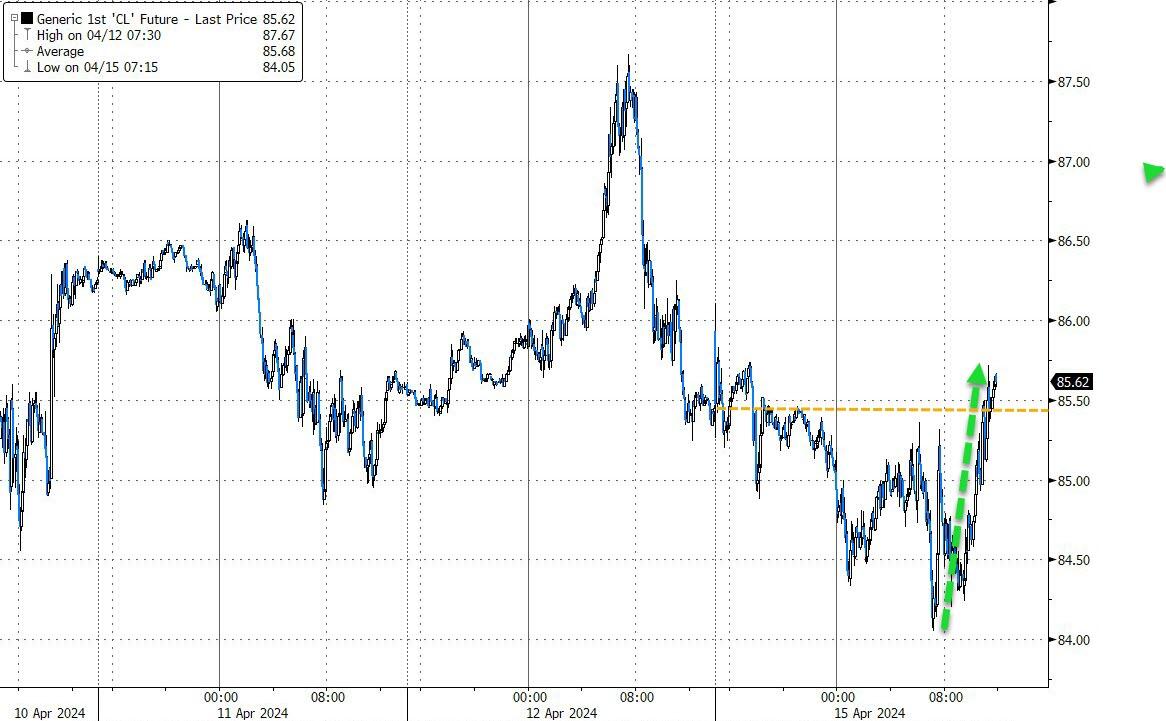
Oil prices concluded the week lower, while gold maintained its strong performance, closing at yet another record high. Silver, too, gained momentum, increasing by 3% over the week to reach its highest point since February 2021.
With precious metals on the rise, one must wonder:
Are they signaling a wake-up call to the equity markets?
Read More