
ETF Tracker StatSheet
You can view the latest version here.
UNCLE SAM’S BUDGET BONANZA: A PRELUDE TO INFLATION’S SECOND ACT?
- Moving the markets
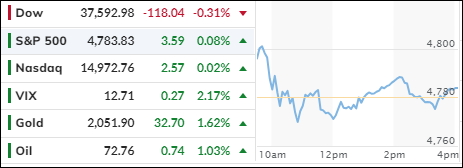
In today’s financial circus, the major stock indexes tiptoed around their opening marks, with traders juggling the lackluster first act of fourth-quarter earnings and munching on a double-feature of inflation reports. The Dow, however, decided to break ranks and march to its own drumbeat.
The plot thickened on Friday when wholesale prices took a surprising bow, dipping by 0.1% in December. This twist came hot on the heels of Thursday’s consumer prices saga, which sizzled a tad more than the economic fortune-tellers predicted, rising 0.3% monthly and 3.4% annually.
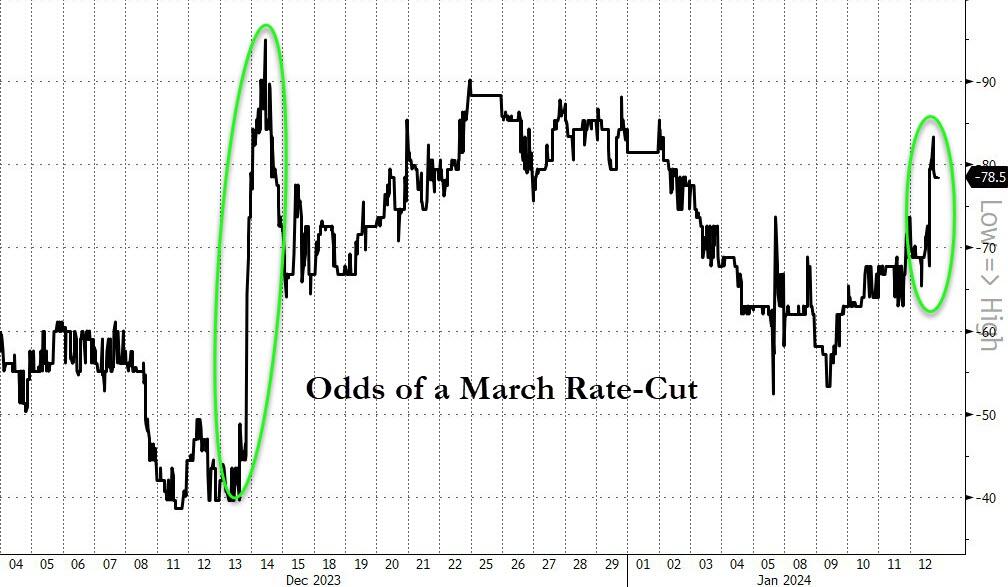
Market optimists, ever the cheerleaders, leaped at the PPI’s unexpected dip, waving pompoms for the notion that December’s CPI spike was just a guest appearance. They’re betting the Fed will roll out the red carpet for interest rate cuts in 2024.
In a dramatic turn, a ‘chill’ PPI has stolen the spotlight from a ‘sizzling’ CPI, sending the markets into a dovish dance, with rate-cut bets hitting the jackpot. The March rate cut odds are now strutting over 80%, likely egged on by the banking sector’s blues, which could prompt the Fed to play the rate-cut card come March. But will this be the magic trick to sidestep a banking blunder?
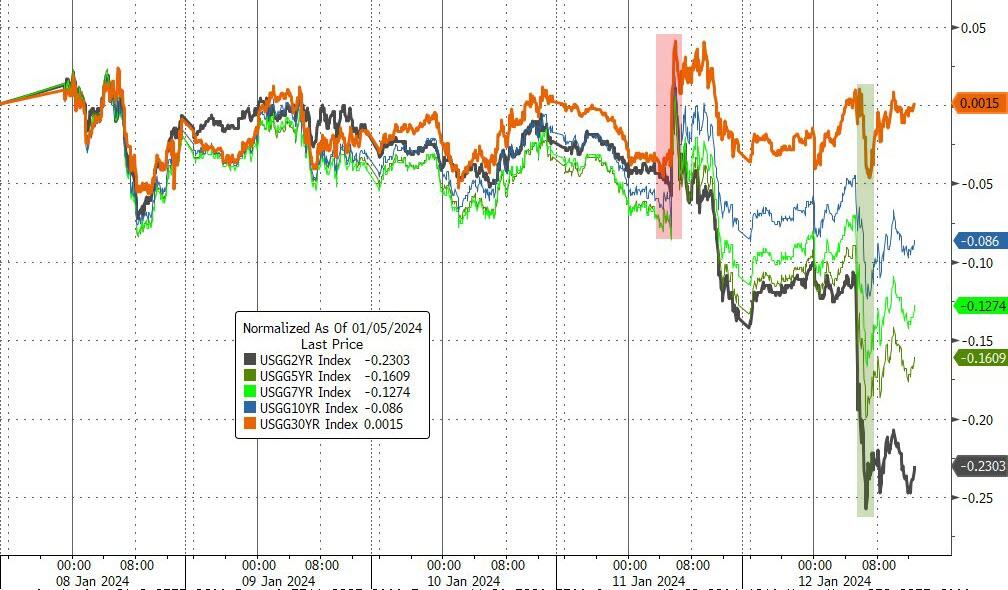
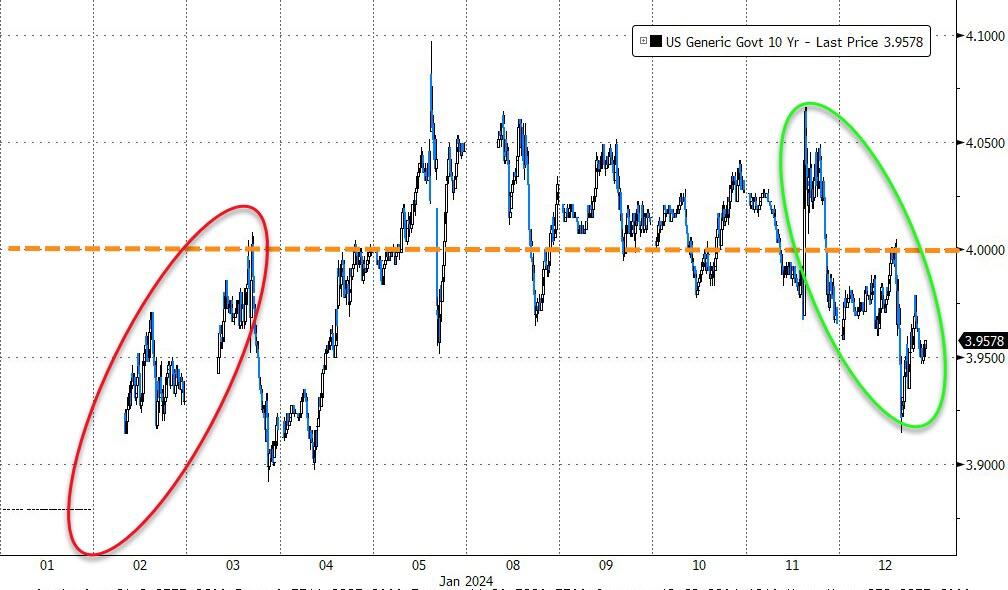
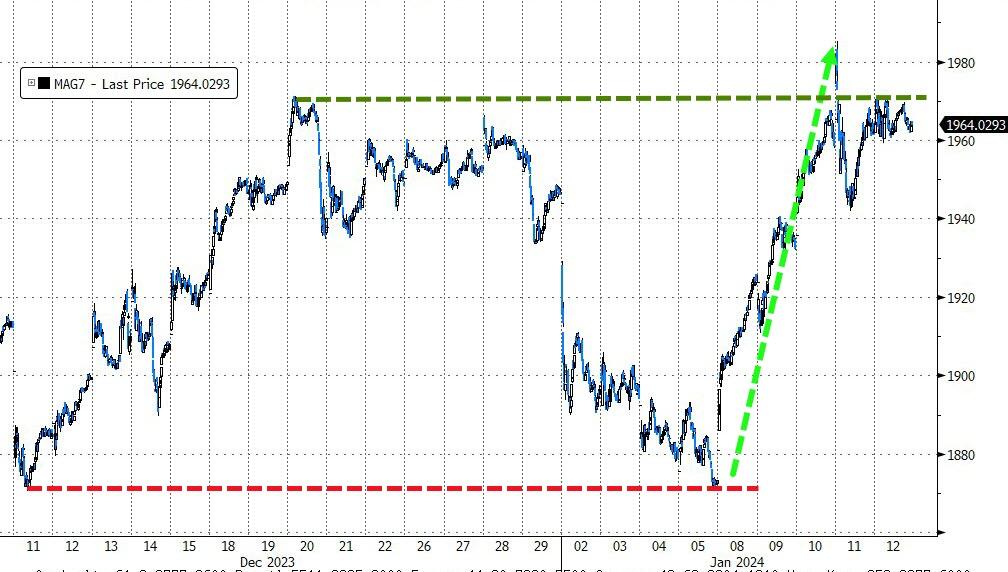
Bond yields took a nosedive this week, with the 10-year yield slipping under the 4% tightrope. The Nasdaq emerged as the week’s ringmaster, boasting a 3% leap, thanks to the MAG7 stocks’ stellar performance. Meanwhile, the Dow and Small Caps kept their balance, and the S&P 500 swung almost 2% higher.
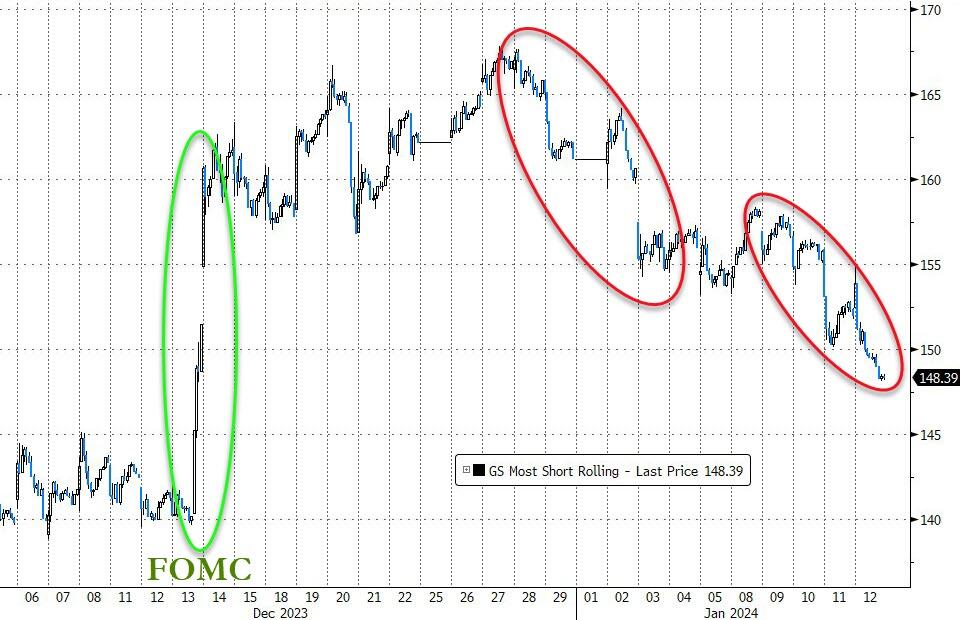
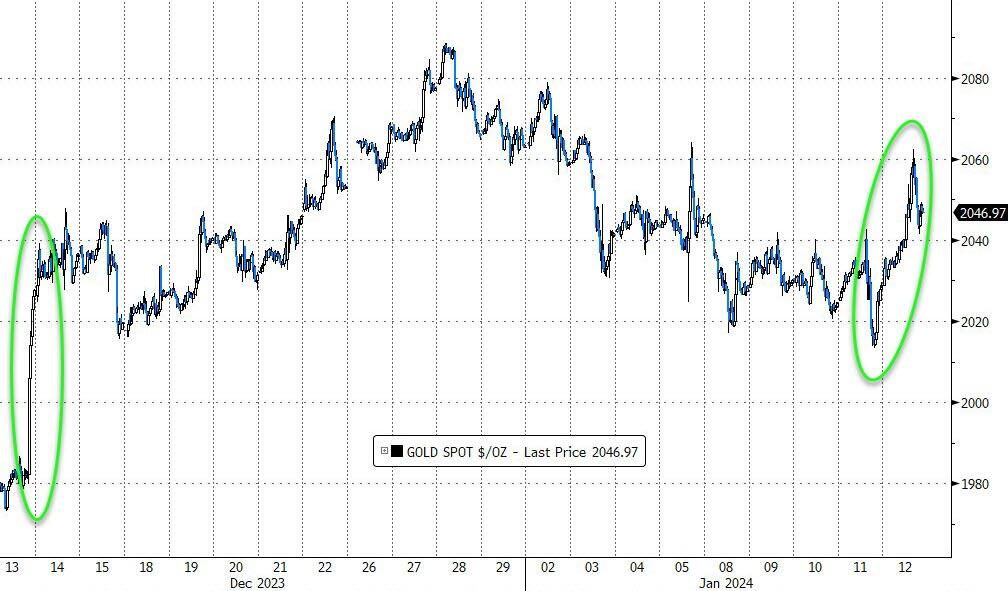
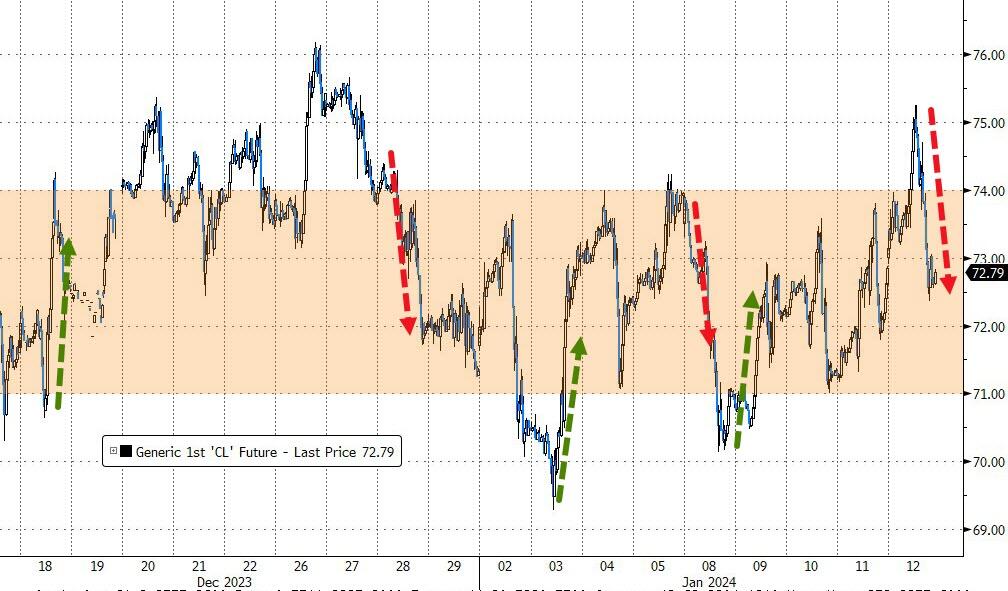
The most shorted stocks took a 4% plunge, wiping away a chunk of December’s losses. Gold, the glittering star, soared in the final act, buoyed by a murky global stage and whispers of lower interest rates. Crude oil, however, stayed caged within its range despite wild fluctuations.
Peering into Uncle Sam’s wallet, we find a fiscal horror show: a $509 billion budget deficit just three months into 2024, second only to 2021’s COVID extravaganza. December’s deficit alone ballooned to $129.4 billion, dwarfing estimates and last year’s figure by over 50%.
This financial frenzy spells a sequel of money-printing madness to bankroll the spending spree. So, folks, brace yourselves—could this be a prelude to an inflation encore?
2. Current “Buy” Cycles (effective 11/21/2023)
Our Trend Tracking Indexes (TTIs) have both crossed their trend lines with enough strength to trigger new “Buy” signals. That means, Tuesday, 11/21/2023, was the official date for these signals.
If you want to follow our strategy, you should first decide how much you want to invest based on your risk tolerance (percentage of allocation). Then, you should check my Thursday StatSheet and Saturday’s “ETFs on the Cutline” report for suitable ETFs to buy.
3. Trend Tracking Indexes (TTIs)
Most of the major stock indexes fluctuated close to their starting points and ultimately closed nearly the same as where they began. The Dow was the exception.
Our TTIs also experienced minor fluctuations and ended slightly lower, which does not alter our existing perspective on the market’s direction.
This is how we closed 1/12/2024:
Domestic TTI: +6.82% above its M/A (prior close +7.31%)—Buy signal effective 11/21/2023.
International TTI: +6.44% above its M/A (prior close +6.46%)—Buy signal effective 11/21/2023.
All linked charts above are courtesy of Bloomberg via ZeroHedge.
———————————————————-
WOULD YOU LIKE TO HAVE YOUR INVESTMENTS PROFESSIONALLY MANAGED?
Do you have the time to follow our investment plans yourself? If you are a busy professional who would like to have his portfolio managed using our methodology, please contact me directly to get more details.
—————————————————————-
Contact Ulli