How Much Diversification Do You Need?

Ulli Uncategorized Contact

In regards to the topic of diversification, reader Wayne had this to say:

I have $40,000 invested in 10 different funds. I read in one of your articles that I only need to be in 2 funds with that amount invested. Should I just pick 2 index funds from your recommended list? How do I diversify into stocks, bonds, international and domestic?

To my way of thinking, before you can discuss diversification, you need to first decide on which investment strategy you are employing.

For example, if you are simply buying and holding, you need to have a different fund selection approach as opposed to trend tracking.

With B&H; you are always exposed to market risk with no safety net in place. That makes it imperative that you own funds/ETFs in your portfolio that (hopefully) will zig when the market zags. Traditionally, this task of neutralizing, when equities head south, has fallen on the bond portion, which in the 2008 debacle did not turn out as planned.

If your mode of operation is trend tracking along with the use of trailing sell stops, then you can go for growth, if that’s what your objective is, without having to worry about a bond portion to bail you out.

Not knowing your circumstances, I can’t comment specifically. However, I have clients with portfolio sizes similar to yours that are invested in 3-4 ETFs covering a broad spectrum, which have produced good returns.

So yes, for a $40k portfolio, you can use 3-4 ETFs, or index funds, and cover just about most of the investment arenas that are worthwhile to be exposed to.

Sunday Musings: Running Out Of Steam?

Ulli Uncategorized Contact

Emerging Markets have been the darling of many investors during this past year. The 1-year chart comparing VWO, ILF vs. the S&P; 500 clearly demonstrates the difference in performance:


During the early phase of an economic recovery, these funds tend to lead the pack and offer great opportunities, but for how long?

If you chart the same funds, but use a 6-months time frame, a different picture emerges:

The S&P; 500 has clearly taken the lead and has recovered far better from the sell-off in February than the emerging markets. While this lag in performance could be temporary and present a current buying opportunity, it also could signal the end of the cycle.

If you bought the emerging markets a year ago, you are sitting on nice profits, if you bought them 6 months ago, you may wondering why they’re lagging the S&P; 500.

While emerging markets are usually leaders on the way up as a recovery materializes, they will also be leaders on the way down, when a recovery stalls or even ends. Since you can never be sure which way things will play out, trend direction and momentum figures can assist you.

In this case, 4-wk momentum did not give much of a clue, but YTD, the S&P; 500 (as represented by SPY) sports a +7.12% figure compared to VWO’s +3.78% and ILF’s +1.23%. SPY also leads in the M-Index department.

The point is that it’s not wise to only look at a long-term chart when comparing funds and evaluating performance and momentum. You also need to look at a shorter time frame when tracking trends to spot any divergences pointing to a directional change that might not have been obvious from a long-term chart.

Disclosure: We have holdings in the above mentioned funds.

High Volume ETFs

Ulli Uncategorized Contact

One of the many components to consider when selecting an ETF to invest in is the average trading volume. It can easily be located at any financial site that shows pricing and charting information.

As previously discussed, high volume can be critical by making it easier to enter and exit a certain market without too much slippage, especially on days when the exit doors get crowded.

To get an overview of trading volume in general, I have taken the listings of the ETF Master and added current average volume figures. The data is as of 4/1/2010, but be aware that those numbers are not static and are subject to change.

You can download the file in PDF format here or in Excel format at this link.

No Load Fund/ETF Tracker updated through 4/15/2010

Ulli Uncategorized Contact

My latest No Load Fund/ETF Tracker has been posted at:

http://www.successful-investment.com/newsletter-archive.php

Despite Friday’s sharp sell-off, the major indexes ended up about unchanged for the week.

Our Trend Tracking Index (TTI) for domestic funds/ETFs has now crossed its trend line (red) to the upside by +4.85% keeping the current buy signal intact. The effective date was June 3, 2009.


The international index has now broken above its long-term trend line by +6.28%. A Buy signal was triggered effective May 11, 2009. We are holding our positions subject to a trailing stop loss.

[Click on charts to enlarge]
For more details, and the latest market commentary, as well as the updated No load Fund/ETF StatSheet, please see the above link.

One Stop Fits All?

Ulli Uncategorized Contact

Stop loss questions are continuing to be the hot topic. One reader posted the following comment:

Have you considered stop loss based on volatility? It is very complex and tricky but better than straight 7 or 8% one fits all.

To be clear, I already differentiate to some degree. My 7% rule applies only to all “widely diversified domestic and international funds/ETFs.” For more volatile sector and country funds, I use 10%.

To slice and dice this further by determining that one ETF with higher volatility should have a 7.75% sell stop while another one with less volatility should have a 6.58% exit point, is simply making things too complicated.

While this may be an interesting project for someone with lots of time on his hands, the differences in outcome maybe minute. I like to look at the big picture and have a plan in place to get out of a position when the trend goes against me. That’s it—no more no less.

You have to remember that this is not an exact science, but merely a method to limit risk. As such, I do not believe carrying this to an extreme will have any advantages. However, if you do engage in this project with your own investments, feel free to share your experiences with me.

A Reader’s Sell Stop Observations

Ulli Uncategorized Contact

Reader Vik has this viewpoint regarding the use of sell stops:

Thanks for all your work. I have expressed my views earlier but I will just repeat them. Trend tracking is excellent method of investing particularly when investing is not your primary job function.

Having said that, I feel that you don’t follow your own method. It would work much better to follow the long term trend instead of the stop loss at 7%.

According to your charts, the long term trend hardly reverses more than once a year. But during the same time, there are several 7% or more dips. I have three issues with trading on that:

1) You have to babysit it every day
2) You lose money on every 7% dip
3) You transact too many times which prohibits investing in some funds.

You have already said that your clients would not like their profits vanish if you went purely by trends instead of 7% dip rule. I think this is more of educating them by historical examples of which method ultimately works better.

Over the past 20 some years, there have been quite a number of market pullbacks that would have turned a major profit into a loss (a cardinal sin of investing), had it not been for the use of trailing sell stops. During the roaring 90s, there was no reason to use anything but the trend lines as exit points, as the bull market was in full swing.

As we entered the first bust in 2000, the name of the game seemed to have changed, which made the use of a sell stop discipline an absolute must. In 2008, you could have gotten away with only using the trend lines as an exit point, but that is with the benefit of hindsight.

It’s a matter of simple math. Trend lines, such as used with my TTIs (Trend Tracking Indexes), move slowly and therefore have a lagging effect, which can endanger your unrealized gains, especially after severe market activity.

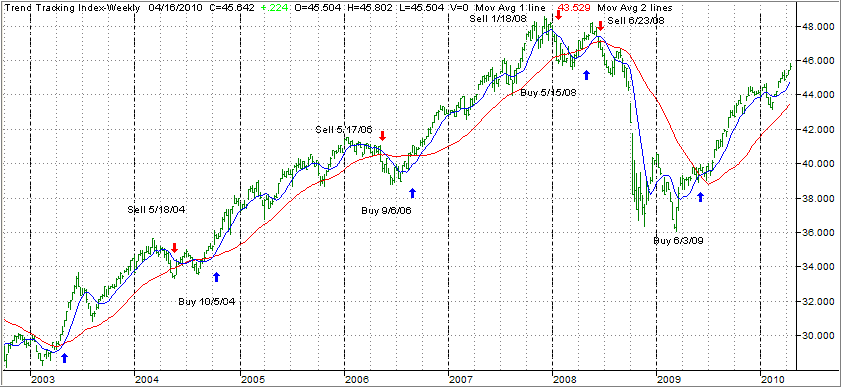
To demonstrate the lag, take a look at 2008 again. After we sold out on 6/23/08, the market corrected so violently to the downside that even after the low was reached on 3/9/09, we did not get a buy signal until 6/3/09.

Now let’s look at the current status of the domestic TTI. It is positioned +4.87% above its long term trend line. If the market heads down from here, your 7% sell stop will bail you out way before the TTI crosses its trend line to the downside, therefore locking in a higher profit.

Of course, if this were to turn into a whip-saw, we’d be looking for a new entry points as discussed in previous posts.

Regarding the above three issue you have with trend tracking:

1. Given how much time most people waste on useless endeavors, like watching TV, spending 5 minutes a day updating stop loss points seems hardly a task at all. I have found that most investors have way too many holdings, which makes updating sell stops more of a chore. For a million dollar portfolio, you should be in no more than 10-12 funds/ETFs.

2. Sometimes you do, but more often than not, you end up being stopped out at a profit as I posted in “Buy-In Vulnerability.”

3. Sure, trading restrictions are an issue we all have to deal with most of the time. Fortunately, ETFs have become the main player, which has solved this problem for many. I have some clients with Fidelity 401k funds, which we purchased at the last buy signal on 6/3/2009, and we have not been stopped out yet despite several pullbacks. I attribute this to a more conservative selection process, which you should use when dealing within a restricted playing field.

What it comes down to is for you to use the approach that you are most comfortable with, and that matches your day-to-day schedule best. I for one prefer the use of trailing sell stops as my exit points, but that does not mean you have to as well.