A World Of Potential Conflicts

Ulli Uncategorized Contact

As I elaborated in yesterday’s post, many readers seem to focus on future events trying to evaluate now as to what the best course of action for their portfolios might be, should this event actually come to pass. Here’s what reader Jerry had to say:

The threat of Israel striking Iran nuclear facilities seems greater as the elections are upon us. If Obama is elected, I believe Israel will strike Iran before year’s end, since he has said in the end he will support the Muslims.

How do I position my portfolio to take advantage of this event? Which oil ETF do I buy options for? What other ETFs would benefit from this also? I would appreciate your thoughts on this scenario.

The problem with Jerry’s scenario is that it is strictly based on predictions. Whether this will happen or not is a totally unknown at this point. I am not a believer in using these types of projections, as realistic as they may seem, as a basis for investment decisions. Why? Because you can be dead wrong in your assumption or the anticipated outcome.

This reminds me of what happened in January 1991 when Iran invaded Saudi Arabia. The world was in shock, speculation ran rampant and the outcome was exactly opposite of what was expected. The domestic markets staged a 1-1/2 year long rally, which still stands as the best return on record we ever had with a Buy cycle for our Trend Tracking methodology.

Sure, times may be different now, but I still believe that the best course of action is to wait for trends to develop first before taking any positions. Going this route will let you confirm that indeed the momentum swings your way, which will enhance your chances of making a better investment decision.

Sunday Musings: Election Confusion

Ulli Uncategorized Contact

Whenever a major event is shaping up, such as the current Olympic Games or the upcoming elections, investors seem to set their sights on these milestones as a basis for making decisions. I have heard arguments like “I’ll hold my China ETF till after the Olympics, and then I’ll sell,” or “I wait till after the elections, and then I’ll buy,” or similar points of view.

Sure, while milestones like these may or may not affect the markets, using them blindly as a guide is an exercise in futility. As MarketWatch points out in their article “Money managers size up post- election economy,” everyone is trying to get an early edge by attempting to figure out what may be the next hot investment item in order to get a head start.

Let’s listen in:

A clichéd view is that a Republican president helps sectors such as defense and healthcare and a Democratic president is good for, well, not much. The reality, of course, is more complicated that that – for instance, markets typically perform better during Democratic administrations than when a Republican is in the White House.

“It’s amazing that with the election as close as it is, we have so few policies that we can bank on,” said Mark Bavoso, head of U.S. asset allocation at Morgan Stanley Investment Management.

Part of this is because both candidates are veering away from policies that typically define their parties and moving more to the center. It’s also because, said Bavoso, that in a turbulent year neither man wants to corner themselves with their promises.

“Uncertainty from the election has been one factor that’s weighed on the markets,” said Brian Levitt, corporate economist at OppenheimerFunds, Inc. He added that, historically, markets prefer one party in the White House and one in Congress. “Free markets like logjam in government,” he said, because it usually means less regulation.

Church said that there’s one fact that faces the country regardless of who wins: George Bush’s legacy. “Bush came in with a budget surplus and he’s leaving a budget deficit,” he said.

And it’s likely the deficit will only increase under a new administration — the Tax Policy Center estimates that under Obama’s plans tax revenues will reach 18.3% of GDP in the next decade, while McCain’s plans will bring in 17.6% of GDP. But even at current levels, spending will account for 19.7% of GDP. The difference of 1%-2% doesn’t sound like much, but GDP over the next 10 years will amount to $185 trillion.

Bavoso said he believes the results of Congressional elections will be just as important as who wins the presidency. Bob Doll, global chief investment officer of equities at BlackRock Inc., said that the biggest question is whether the Democrats reach the magic 60 number in the Senate. With 60 votes, the Democrats would be able to force legislation through the upper chamber regardless of who is president.

Expect a bigger tax bite under a new administration, though the pace and extent of the rises will depend on who wins. Despite McCain’s tax-cutting promise, money managers predict that a Democratic majority in Congress all-but-guarantees the Bush administration’s tax cuts will expire in 2010. In other words, expect higher capital gains, dividend and income taxes by 2011 at the latest.

Doll says that both candidates will raise taxes, and most likely before the expiration date. As Bavoso pointed out, McCain will still need a package that meets the approval of a heavily Democratic Congress.

There you have it. Nothing is certain and neither potential outcome can tell you for sure which sectors might be positively affected by either candidate. It’s all a wild guessing game because the winning candidate will have to face certain realities after being elected that might directly oppose his pre-election (empty) promises.

Whatever the winning candidate decides to do to what extent is simply an unknown as is how Wall Street will react. However, any reaction will be reflected in the underlying trends, which I can measure.

That will give me an opportunity to determine which (domestic/sector) trends are breaking out to the upside (above their long-term trend lines) and will provide me then with an opportunity to take invested positions accordingly. Trying to make that assessment now without cause is simply speculation.

How To Lose 46%

Ulli Uncategorized Contact

One newsletter reader, who wants to remain anonymous, called a couple of days ago and told me that his wife’s portfolio just lost some 46% dropping from $170k to some $91k in about 1-1/2 years.

Your first reaction might be “how could you let this happen,” but I believe that this is, unfortunately, not an isolated case. Whenever investors engage the services of a broker or an advisor, there is some trust involved by assuming that this person knows what he’s doing.

As the portfolio starts to sink into oblivion, you’ll hear explanations like “it’ll come back up,” “a turn around is about to happen,” or my all time favorite “the market can’t go any lower.” There are a host of other excuses, but you get the picture.

This investor’s portfolio was diversified, which means it was set up based on a buy and hold mentality, irregardless of whether market conditions were bullish or bearish at that moment.

The reader was kind enough to share one main component of his portfolio, which was a fund called RHY. Let’s take a look at a 2-year chart:


This is about as bad of a chart you can find if you’re holding a long position. The reader told me that he got in at $16 and finally out at about $1.30 due to his urging and not his brokers. It’s another sad story of total incompetence and lack of a plan to protect a client’s assets.

This illustrates what I have been writing about for years. When you select someone to manage your portfolio for you, the most important question to ask is “what is your exit strategy?”

If there is no clear answer or stammering and a bunch of excuses as to why he doesn’t use one, look for someone else. Once you find such a person, get it in writing by asking for an Investment Policy Statement (IPS), which should exactly describe the methodology employed to get in and out of the market.

No matter which investment approach you favor, losses are part of investing; keeping them small and manageable is the key to long-term investment success.

No Load Fund/ETF Tracker updated through 8/21/2008

Ulli Uncategorized Contact

My latest No Load Fund/ETF Tracker has been posted at:

http://www.successful-investment.com/newsletter-archive.php

Friday’s sharp advance based on lower oil prices and soothing words from the Fed chairman was not enough to keep the major indexes in positive territory.

Our Trend Tracking Index (TTI) for domestic funds/ETFs remains below its trend line (red) by -0.64% thereby confirming the current bear market trend.


The international index now remains -7.93% below its own trend line, keeping us on the sidelines.


For more details, and the latest market commentary, as well as the updated No load Fund/ETF StatSheet, please see the above link.

Is an 18% Yield Worth It?

Ulli Uncategorized Contact

Based on recent emails, I know that many readers are scouring the investment globe for high yielding mutual funds/ETFs hoping to find a way to generate income or an above average rate of return.

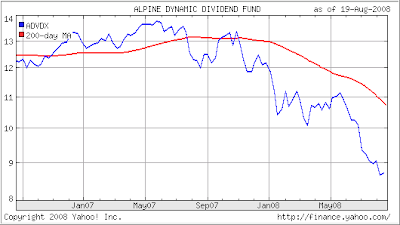
One of the highest yielding funds I have found is ADVDX, which sports a mouth watering annual yield of 18.11%, according to Yahoo.com. Let’s take a look at a 2-year chart:


All of a sudden this fund does not look so good, doesn’t it? Yahoo reports that during first 7 months of 2008, ADVDX has lost 18.61%. And that is the problem with income investing in general when the markets are engaged in a down trend, which is exactly what happened lat year. While income investors were able to generate a nice yield, they ended up losing twice that amount on the principal side. It’s simply robbing Peter to pay Paul, or worse.

While I have invested in ADVDX in the past, I have only done so during a clearly defined bull market and not when the bear was licking his chops. Investing for income in this environment requires the same rules of following trends i.e. be in when the trend is up and out when the trend reverses.

Otherwise, you may find yourself with a nice income on one side but with an overall deteriorating financial position on the other.

The Russian Connection

Ulli Uncategorized Contact

Many investors were extremely excited when the Russian ETF (RSX) debuted in May 2007. While it’s been a bumpy ride, the bias at first was definitely to the upside as the 1-year chart shows:


From the top, which was made on May 19, 2008, it’s been all downhill, and YTD this ETF is down some 23%. Russia’s recent “excursion” into Georgia has not given the world community a warm and fuzzy feeling, which contributed to the recent acceleration to the downside.

Since breaking the long-term trend line to the downside, RSX has lost 21%. As always, this serves as a reminder of the importance of watching where the trend is headed to avoid either giving back all of your profits or limiting your losses.