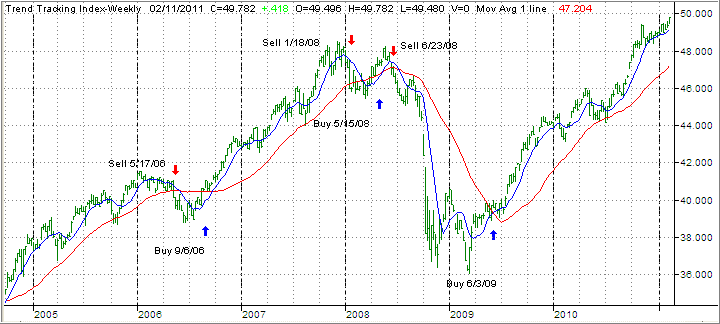
No Load Fund/ETF Tracker updated through 2/9/2011

Ulli Uncategorized Contact

My latest No Load Fund/ETF Tracker has been posted at:

http://www.successful-investment.com/newsletter-archive.php

Continued upside momentum pushed the major indexes to another winning week.

Our Trend Tracking Index (TTI) for domestic funds/ETFs has moved above its trend line (red) by +5.47% (last week +4.85%) and remains in bullish mode.

The international index has broken above its long-term trend line by +9.08% (last week +9.25%). A new Buy signal was triggered effective 9/7/10. If you decided to participate, be sure to use my recommended sell stop discipline.

[Click on charts to enlarge]

For more details, and the latest market commentary, as well as the updated No Load Fund/ETF Tracker StatSheet, please see the above link.

Short Post

Ulli Uncategorized Contact

No post today, since I finally had my long overdue cataract surgery done. It turned out to be successful, but my vision is still a little blurry, which makes reading and writing a bit of a challenge.

I should be back to normal within a day and plan on sending out Friday’s weekly newsletter as usual.

Overcoming Resistance

Ulli Uncategorized Contact


Rising shares of some of the heavyweights like McDonald’s, IBM and Apple definitely contributed to yesterday’s rally, as the S&P; 500 overcame major resistance in the 1,313 area, a level which was last reached in August 2008.

The advance occurred despite some headwind in form of China’s second interest hike in a month designed to control inflationary pressures. Gold and silver were the beneficiaries and finally rallied after having pulled back since the beginning of this year.

Of more concern is what impact China’s slow but continuous tightening will have on global economies as we go forward. A potential real estate bubble, and the desire to rein in inflation, are events whose outcome can’t exactly be measured or anticipated.

Much depends on the magnitude of their inflation fighting efforts. Nevertheless, for the time being the domestic U.S. market hears and sees no evil and continues to head higher.

I have written much about investor complacency and it is alive and well judging by the emails and phone calls I have received. I am not being negative here, but there is only so much a market can gain without any serious correction.

Day Of The Deals

Ulli Uncategorized Contact


Yesterday turned out to be another solid day in the market as a slew of takeover deals, along with continued confidence in the economy, provided the firepower to push the major indexes higher.

Even political turmoil in Egypt appeared to ease, which temporarily alleviated fears of more uncertainty.

While the markets did not end up closing at their highs, which was a bit of a negative, we have now reached some very lofty levels. The Nasdaq, for example, is now within striking distance of taking out its 2007 peak of 2,859; the point from which a pullback occurred, which subsequently turned into the 2008 crash.

If you have more investable funds to deploy, I suggest you move down on M-Index rankings in order to avoid too much volatility when the inevitable correction occurs. I have no idea when that will be, but at these levels, the economy better perform as anticipated, with no major disappointments, or this run up could be over in a hurry.

Revisiting The Biggest ETF Loser

Ulli Uncategorized Contact

Several readers have emailed me and were wondering if there was some credence to articles suggesting Natural Gas (UNG) as an investment was ready to explode.

Maybe there are new fundamental reasons, but I have heard most arguments every so often over the past few years as UNG plummeted further into abyss.

The following 5-year chart clearly depicts the misery those investors, who followed past buy recommendations, have gone through as this ETF gave a new meaning to the word gravity:

Here are some of the current momentum figures:

4-wk: -1.83%
8-wk: -3.13%
12-wk: +3.88%
YTD: -1.67%
%M/A: -11.87% (% below its long term trend line)

The natural tendency for investors is to want to pick the absolute bottom and ride the trend back up. The 3-months chart shows that indeed UNG has popped off its December bottom a few times:


However, so far all breakout attempts have been head fakes. Until UNG actually pierces and breaks clearly above its long-term trend line, defined as %/M/A in the weekly StatSheet, the downside risk is simply too high.

It’s better to be patient and wait for an actual breakout, which increases your odds that a true trend reversal has in fact taken place. Going bottom fishing right now is simply wishful thinking and may satisfy your gambling instinct, but may turn into a disappointing experience.

Disclosure: No holdings

Sunday Musings: Disconnect

Ulli Uncategorized Contact

Emerging markets, the leader of the past, have been holding up relatively well since the Egyptian crisis has erupted as MarketWatch reports:

For emerging markets investors, the unrest in Egypt has been unsettling, to say the least. But the steep losses in Egypt’s now-shuttered stock market barely have affected the returns of emerging-markets mutual funds and exchange-traded funds.

The Egypt market’s 21% slide year-to-date is painful, but Egypt represents about 0.38% of the MSCI Emerging Markets Index (Egypt is not a so-called frontier market, according to MSCI). The emerging-market benchmark is down about 1.4% so far this year. What is Egypt’s contribution to that loss? About eight basis points, or 0.08%.

Of course, the political storm engulfing Egypt is taking aim at other countries in the Middle East and Africa, so fund and ETF investors may be in for more shocks. But this is the price of risk that emerging-markets investors pay in exchange for the promise of extraordinary returns. Only now that risk is extraordinarily high.

Sure, while the effect of the Egyptian uprising has been limited in scope so far, there seems to have been some directional change in the emerging markets since the beginning of this year, which happened even before Egypt entered the picture.

Here’s a 6 months chart showing the S&P; 500 vs. the emerging markets ETF (VWO):


As you can see, since the Fed’s Quantitative Easing initiative (QE-2), which was enacted the beginning of November, VWO has been very volatile and seem to have disconnected from the domestic market, as represented by SPY, since January 2011.

You could argue that this was one of those unintended consequences of QE-2 as was the rise in interest rates. While the S&P; 500 has been on a straight upward path, VWO has headed south and has come off its high by -4.58% as of 2/3/11.

It’s too early to tell whether the major trend of the emerging markets has indeed come to an end, but you should be prepared to exit in case things get worse. Remember, for country funds/ETFs, I recommend the use of a 10% trailing sell stop.

I have written about known and unknown uncertainties. Egypt was definitely an unknown and unexpected one with more fallout potential from other surrounding countries a real possibility.

It appears that the world we are living in grows more uncertain by the day, which eventually will affect the domestic stock market as well. Although right now it seems that things are a lot worse elsewhere than here in the U.S., so we may have some more upside potential.

However, when directional changes occur, they may happen fast and furious, if they are triggered by a major adverse event. Don’t become complacent; always be prepared to exit and establish your strategy now, and not when the market heat is on.

Disclosure: Positions in VWO