Testing Resistance

Ulli Uncategorized Contact


When support levels get broken, they become overhead resistance at the time markets attempt to reverse course and rally again. Such was the case yesterday, when an initial rebound died around the 1,040 resistance number for the S&P; 500.

It was downhill for the rest of the day, but a pop towards during the last 30 minutes of trading moved the major averages back into positive territory. We’re still in that neutral zone between bullish and bearish territory where a break to either side could occur.

Our domestic Trend Tracking Index (TTI) confirms this current uncertainty in terms of trend direction. The TTI retreated and moved closer to its long term trend line but remains below it by a scant -0.04%. That’s certainly not enough for either the bulls or the bears to declare victory.

We have to wait for further market developments to get a better feel as to whether this buy cycle really has come to an end and that the bears have taken charge.

Where’s The Support?

Ulli Uncategorized Contact

With the S&P; 500 support level of 1,040 having been decisively broken, the question some readers had is: Where is new support coming in as we enter bear market territory?

Miynanville tried to shed some light on that question in “Why We Should Be Talking About S&P; 840:”

With the magical 1040 level being tested in the S&P; 500, many technicians and talking heads are looking at this level as the final step before Armageddon. Running through the various newsletters and blogs, a common theme seems to be that if 1040 doesn’t hold, then the 960 level is the last stand before traders get a one-way ticket to test the March 2009 lows of 666. From that point, it’s death and destruction to the American economic system as we know it, or so the naysayers would have you believe.

From my perch, as a money manager and daily commentator in various media outlets, I agree that 1040 holds a lot of psychological weight. If a break of this level holds, it should turn many market participants fully bearish and cause a downward cascade that will be difficult to stop. The proverbial line in the sand has been drawn,and the S&P; is clawing and scraping at this very moment to remain with its head above this low water mark.

Trying to stay two steps ahead of the action, I roll out the weekly charts to anticipate the next areas of support. I’ve marked several areas on the weekly chart below that have been battlegrounds in the past. No, these aren’t Fibonacci retracements but merely areas where the action stalled as traders, investors, and mutual funds jockeyed for position.

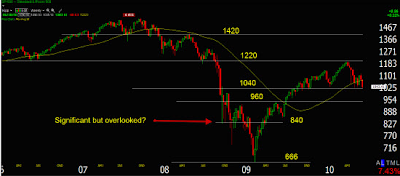
The first two months of 2009 would have been the first time traders might have taken note of how much air time 840 was receiving. Prices seemed to be drawn back to this area like sheet metal to a magnet. When selling pressure resumed and the S&P; hit its eventual bottom at 666, 840 was the last area of consolidation. In textbook fashion, 840 once again was an area of consternation and tight play as the S&P; bounced off the lows. From there, there was no turning back as the S&P; raced to 1200.

Now turn your eyes back to the weekly chart for a bigger-picture view. 840 and 960 may never come into play as the markets could catch a second wind and be off like a racehorse. But if 1040 does relinquish control to the bears, then all eyes will be fixated on the next levels of support. It’s my opinion that 840 should be added to the discussion, and that 666 isn’t inevitable as we struggle for footing. 960 to 666 is a long step off the end of the plank, but my bet is on 840 being a safety net. So yes, I’d be a buyer of the S&P;… at 840.

There you have it. From 1,040 to 960 to 840 to 666, these are the numbers to watch for, if the bear has its way. This is not a prediction that we will actual get to the bottom, although the possibility exists, but merely a demonstration of where the support levels are located.

Every level can serve as a springboard to renewed bullish action, but if broken, it will confirm the bearish scenario. With the market having closed at 1,023 last Friday, personally, I will be watching the 1,000 level. Not that it has any technical significance, but it does have a psychological one. I believe once that has been pierced to the downside, we will get to 960 in a hurry.

Of course, positive economic developments, along with a rip-roaring upcoming earnings season, can reverse this current bearish direction, but I doubt it. It may take a lot of zigzagging, but I think the die has been cast, and the major trend will be south.

Whether I am right or wrong does not matter, what matters is that you protect yourself from the increased downside risk via my recommended sell stop discipline.

We may not see a repeat of 2008, but slow and consistently sliding prices will have just as bad of an effect on your portfolio as an outright crash.

Sunday Musings: Deflation And Double Dip Recession

Ulli Uncategorized Contact

Reader Rick emailed the following question:

I have been reading several blogs and newsletters that are stating that the US may be looking at a Double Dip recession later this year but even more so in 2011. What is your take on this possibility?

Also, I am seeing more and more mention of deflation without much being said about where to position a portfolio or what to invest in if deflation does hit. Would you please comment on a deflationary scenario?

Yes, I think a slide back into a recession is a distinct possibility. Actually, we might be still in one had it not been for the reckless spending of trillions of stimulus dollars. Since we are on the back side of busted real estate/credit bubble, we are a bit in unchartered territory, the exact outcome of which is still an unknown.

There is no way to anticipate what will happen and what your future portfolio should look like. The beauty of trend tracking is that we don’t have to guess. We first determine where the major trend is at. Right now, domestically, we’re still dancing above/below the long-term trend line by a small percentage with a potential break below it lurking in the near future.

Once that happens, we will have to evaluate which areas are still showing increasing momentum figures as featured in my weekly StatSheet. Then we can determine if any sectors have merit or if outright short investments via ETFs like SH or SDS are sensible.

Trying to establish positions now or making major portfolio changes in anticipation of deflation or double dip recession makes no sense to me. As always, my recommendation is to wait and let market show us the way.

Looking at the big picture, if you were to divide the investment world into 5 major asset classes, you might come up with the following:

Bonds (+1.95%)
U.S. Stocks (-7.95%)
Foreign Stocks (-9.26%)
Commodities (-9.56%)
Real Estate (-0.66%)

All of these 5 are well represented in the ETF world and can be bought at anytime. The numbers in parentheses (as of 7/2/10) represent the percentage each asset class is positioned above or below its respective long-term trend line indicating whether it is in bullish or bearish territory.

All are in bear market territory with the exception of bonds. That pretty much tells you the current state of affairs as to where the major trends are headed. Given that fact, I think trying to outguess market direction and attempt to position a portfolio at this time is like trying to catch a falling knife.

Stay in those areas where the momentum is, which currently is in bonds and selectively on the short side of the market until directional changes become apparent.

Patience is crucial as we may be slipping into an economic environment for which there has been no precedent.

Deadly Bottom Fishing

Ulli Uncategorized Contact

Some readers like to look at fundamentals as a primary decision tool to add a position to their portfolio. Just because fundamental data seem to paint a rosy picture about a certain sector being ready to explode, does not mean that I will.

Never ever have the famous words “it can’t go any lower” rung truer as in the case of natural gas. Over the past few months, I have received several emails about the imminent turnaround in that arena and how great of an opportunity current pricing would be.

One look at a 2-year chart of UNG (courtesy of YahooFinance) tells you the real story:

It represents a sector stuck deeply in a downward trend since about August of 2008, when the trend line was broken to the downside. This is about as graphic as you can get as to why bottom fishing can be hazardous to your financial health.

It supports my view that a simple chart can quickly demonstrate where a sector is headed, while fundamentals will never show you as clear a picture.

Sure, eventually UNG will turn around and present a great buying opportunity. However, you want to first see a clear change in form of the trend line being broken to the upside. While this may take some time to accomplish, it will always be accompanied by improved momentum figures as featured in my weekly StatSheet.

While you can get lucky going bottom fishing, a better mode of operation is to put the odds of a successful investment on your side first. That means not trying to hunt for the lowest price but let upward momentum be your guide as to when to enter.

Disclosure: No positions in UNG

No Load Fund/ETF Tracker updated through 7/1/2010

Ulli Uncategorized Contact

My latest No Load Fund/ETF Tracker has been posted at:

http://www.successful-investment.com/newsletter-archive.php

The bears ruled, and the major indexes lost 5-7% for the week .

Our Trend Tracking Index (TTI) for domestic funds/ETFs barely slipped below its trend line (red) by -0.40% (last week +1.19%). For more on how to handle this, please see the above link.

The international index has now broken below its long-term trend line by -4.49% (last week -1.84%). A Sell Signal was triggered effective May 7, 2010. We are no longer holding any positions in that arena.

[Click on charts to enlarge]

For more details, and the latest market commentary, as well as the updated No load Fund/ETF StatSheet, please see the above link.