The Flattening Trend Line—Part II

Ulli Uncategorized Contact

Yesterday, I talked about the flattening of the trend line and its potential effect on a buy signal. Today, let’s look at a historical chart of the domestic Trend Tracking Index (TTI) to determine if a rising trend line should you keep you in the market, even though our trading rules signal a ‘Sell.’

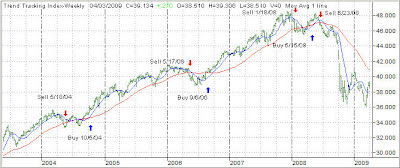
Take a look a the graph below, which shows the price action along with our ‘Buy’ and ‘Sell’ signals over the past 6 years:


[Click chart to enlarge]

There were 4 sell signals identified by the large red arrows. You can look at each one of them and note that the trend line was still rising when the ‘Sell’ occurred. The first 3 ended up to be whip-saws as the markets subsequently resumed their long-term upward trend.

Here’s where percentages can get you into trouble. If you were to conclude that 75% of the time a rising trend line renders a sell signal invalid, then you would be right—until you’re wrong. This is where the magnitude factor kicks in. Had you made the decision to stay in the market and ignore the ‘Sell’ on 6/23/08 as well, your portfolio would be in the same shape as that of the buy-and-hold crowd.

Three times you would have been right over 6 years by avoiding a whip-saw, but the fourth time you would have gotten clobbered.

My experience from following these trends for over 20 years simply tells me that you can never be sure. I have learned that it is better to live with an occasional whip-saw than to arbitrarily use rising or falling trend lines to fine tune my decisions.

The simplicity of following all buy and sell signals regardless of outcome is what will keep you consistently on the right side of the long-term trend; even though at the time it may not always seem that way.

If you adopt the long-term view, as I tried to by using these occurrences over a 6-year period, you may find these whip-saws to be nothing more than a necessary evil on your way to safely avoiding bear market disasters.

The Flattening Trend Line—Part I

Ulli Uncategorized Contact

One reader pointed to a CNBC video featuring a short presentation about a “flattening trend line.” Take a look but disregard the useless chatter afterwards:

While I don’t use the 150-day moving average as shown in this demonstration, this nevertheless poses an interesting question. Does entering the market (using our entry rules), after the trend line of the Trend Tracking Index (TTI) has flattened, enhance the chances of success?

In other words, are the odds of the price trend continuing to the upside greater when a trend line has flattened as opposed to getting a buy signal while it is still falling?

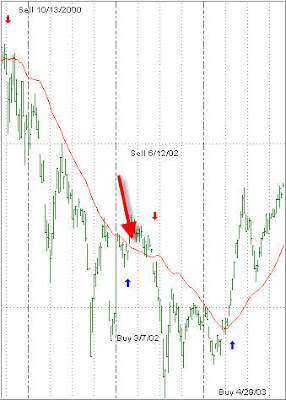
To find an answer, I had to look back to the last bear market of 2000, where our sell signal kept us out of domestic equities from 10/13/2000 until 4/29/2003.

However, that time frame was interrupted by a short whip-saw period (which was long enough to result in a profit) from 3/7/02 until 6/12/02. Take a look at that enlarged portion of the chart:


As you can clearly see, the trend line (red) was still descending as the ‘Buy’ on 3/7/02 was generated. At the moment the ‘Sell’ was triggered on 6/12/02, it had actually turned up slightly.

Since this is the only example I could find, it certainly is not conclusive to say that buy signals, while the trend line is still descending, will always lead to whip saws.

To gain more insight, let’s look at the opposite tomorrow: The effect of selling when the trend line is still rising. Maybe that will lead us to a better conclusion.

In This Rally We Trust

Ulli Uncategorized Contact

The recent market rebound has shown a lot of legs ever since the S&P; 500 made a 12-year low on March 9th. This prompted many readers to ask whether this is still a bear market bounce or possibly the beginning of a new bull market.

Reader Mel had this comment:

As I’ve said before, I appreciate very much your sharing your opinions, including your passing on of the writings and videos of others. But for those of us who have been following your advice to stay on the sidelines (with the exception of the new hedge strategy) during the past few weeks, it would be very helpful if you could include a few lines in your daily blog just stating that you don’t trust this rally, even as the market continues to move higher 🙂

Thank you again for sharing your knowledge and opinions.

I pointed out in Bear Market Rallies that rebounds off new lows can be fierce and lengthy in duration. Of course, a subsequent correction can be just as violent as we’ve seen during the first couple of months of 2009.

To me, this is not a matter of trusting this rally. While I believe that this bear market is far from being over, it does not mean that we won’t get a prolonged period of rising prices even to a point where our domestic TTI signals an outright buy. If that happens, I will follow the trend; however, my hands will be placed firmly around the trigger for our exit points.

The line between bullish and bearish territory is clearly drawn in the sand, so there is never any question as to where long-term market direction is at. I’ve seen many newsletter writers being labeled over years to be either perennial bulls or bears.

I am neither.

If the market crosses the major trend line into bullish territory, I am bullish. If it heads south and crosses below the line, I am bearish. It’s as simple as that. I have no bias either way and let the market tell me what position to take.

Sometimes, when a period, such as this bear market, goes on for some time, a few readers have commented that I am too negative. That is incorrect; I simply go with the trend and my views at the time support the current reality and not some wishful thinking.

This allows me to treat events in the market place without too much emotion and simply focus on what’s most important, which is to be onboard when a major trend develops.

No Load Fund/ETF Tracker updated through 4/2/2009

Ulli Uncategorized Contact

My latest No Load Fund/ETF Tracker has been posted at:

http://www.successful-investment.com/newsletter-archive.php

Despite a sharp sell off on Monday, the major averages recovered and closed higher for the 4th week in a row.

Our Trend Tracking Index (TTI) for domestic funds/ETFs remains below its trend line (red) by -4.08% thereby confirming the current bear market trend.


The international index now remains -8.14% below its own trend line, keeping us on the sidelines.

For more details, and the latest market commentary, as well as the updated No load Fund/ETF StatSheet, please see the above link.

The Stimulus Bill

Ulli Uncategorized Contact

Stimulating the economy at all costs has been the mantra of the past few months. Even the current G-20 meeting London will have its main focus on how to improve economic conditions worldwide.

Personally, I don’t expect anything in terms of a tangible action plan since some participants are not convinced that reckless stimulation will bring the desired results.

Reader Tom sent in this humorous description of not only how a stimulus bill works but also what the likely result will be:

Shortly after class, an economics student approaches his economics professor and says,
“I don’t understand this stimulus bill. Can you explain it to me?”

The professor replied, “I don’t have any time to explain it at my office, but if you come over to my house on Saturday and help me with my weekend project, I’ll be glad to explain it to you.” The student agreed.

At the agreed-upon time, the student showed up at the professor’s house. The professor stated that the weekend project involved his backyard pool.

They both went out back to the pool, and the professor handed the student a bucket. Demonstrating with his own bucket, the professor said, “First, go over to the deep end, and fill your bucket with as much water as you can.” The student did as he was instructed.

The professor then continued, “Follow me over to the shallow end, and then dump all the water from your bucket into it.” The student was naturally confused, but did as he was told.

The professor then explained they were going to do this many more times, and began walking back to the deep end of the pool.

The confused student asked, “Excuse me, but why are we doing this?”

The professor matter-of-factly stated that he was trying to make the shallow end much deeper.

The student didn’t think the economics professor was serious, but figured that he would find out the real story soon enough.

However, after the 6th trip between the shallow end and the deep end, the student began to become worried that his economics professor had gone mad. The student finally replied, “All we’re doing is wasting valuable time and effort on unproductive pursuits. Even worse, when this process is all over, everything will be at the same level it was before, so all you’ll really have accomplished is the destruction of what could have been truly productive action!”

The professor put down his bucket and replied with a smile, “Congratulations. You now understand the stimulus bill.”

The Geithner Plan Explained

Ulli Uncategorized Contact

Some readers have asked how a private/public partnership to remove toxic assets from banks’ balance sheets would actually work. Much has been written about it, although not always in understandable terms.

Hat tip goes to Mish at Global Economics for pointing to the following video, which attempts to clarify the details of its implementation. You will probably be as surprised as I was to find out who would potentially invest in such a scheme.
Take a look. The video is about 12 minutes long, but well worth the time to better understand the concept:

[youtube=http://www.youtube.com/watch?v=n-arbfLTCtI]