06-17-2011

Ulli Newsletter Archives Contact

ETF/No Load Fund Tracker StatSheet

————————————————————-

THE LINK TO OUR CURRENT ETF/MUTUAL FUND STATSHEET IS:

https://theetfbully.com/2011/06/weekly-statsheet-for-the-etfno-load-fund-tracker-updated-through-6162011/

————————————————————

Market Commentary

Friday, June 17, 2011

ETFs IN RETREAT: STAGGERING NORTH, SOUTH AND NOWHERE

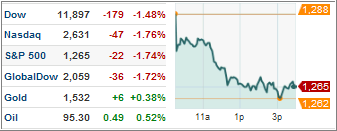
Tuesday’s relief rally (or was it a dead cat bounce?) is now a distant memory, only visible in the rear view mirror, as Wednesday’s return to reality took back all of the previous day’s gains and then some.

There was nothing new, as the same old worries about global growth, domestic inflation and the now out of control spinning Greek debt crisis took their toll and sent the major market ETFs to the mat. The remainder of the week was spent in aimless meandering depending on the news reports du jour.

In the end, the Dow and the S&P 500 managed to eke out tiny gains for the week, while the Nasdaq lost. In case you missed it, and you are one looking for extreme high returns, the Greek 2-year bond is now sporting a mind boggling 30% yield. Does that sound like an investment that will be around in 2 years? I think not.

Our Trend Tracking Indexes (TTIs) slipped with the markets and, as I posted on Wednesday, the International TTI has now entered officially bear market territory, since it had dropped considerably from last Friday’s close.

Here’s where both indicators stand in relation to their long-term trend lines after the close today:

Domestic TTTI: +1.87% (last week +2.16%)
International TTI: -1.69% (last week -0.70%)

European politicians are now in a feeding frenzy desperately trying to overcome their differences and maintain face while attempting to convince the world that Greece deserves more rescue funds no matter what.

I am certain that this debt debacle will continue to be front page news next week as will be the FOMC rate decision along with a few economic reports like home sales, initial claims, GDP and durable orders.

Be sure to track your trailing sell stops on all holdings, if you do your own investing. Earlier this week, I liquidated our positions in the energy sector (VDE) and today, I sold the emerging markets (VWO). Interestingly, while VWO was still positioned slightly above its sell stop point, it had pierced its respective long-term trend line to the downside making that move a priority.

Volatile times in the market are certain to stay with us a while longer, so prepare your next move ahead of time. That way, you don’t sweat it when the market heat is on.

Have a great week.

Ulli…

————————————————————-

READER Q & A FOR THE WEEK

All Reader Q & A’s are listed at our web site!
Check it out at:

http://www.successful-investment.com/q&a.php

A note from reader Myth:

Q: Ulli: I want to try one of your model portfolios for my 401(k). I’m thinking of selling my current holdings in my 401k and buy those funds in one of those portfolios. Is that a good idea? I don’t manage my 401k well so I want to try yours. I have a brokerage account in my 401k which would allow me to do that.

A: Myth: Yes, you can do that, but not right now. We are on the verge of slipping into bear market territory, and you should be watching your sell stops and not adding new positions or switching to a different portfolio.

———————————————————-

WOULD YOU LIKE TO HAVE YOUR INVESTMENTS PROFESSIONALLY MANAGED?

Do you have the time to follow our investment plans yourself? If you are a busy professional who would like to have his portfolio managed using our methodology, please contact me directly or get more details at:

https://theetfbully.com/personal-investment-management/

———————————————————

Back issues of the ETF/No Load Fund Tracker are available on the web at:
https://theetfbully.com/newsletter-archives/

ETF/No Load Fund Tracker For Friday, June 17, 2011

Ulli ETF Tracker Contact

ETF/No Load Fund Tracker StatSheet

————————————————————-

THE LINK TO OUR CURRENT ETF/MUTUAL FUND STATSHEET IS:

https://theetfbully.com/2011/06/weekly-statsheet-for-the-etfno-load-fund-tracker-updated-through-6162011/

————————————————————

Market Commentary

Friday, June 17, 2011

ETFs IN RETREAT: STAGGERING NORTH, SOUTH AND NOWHERE

Tuesday’s relief rally (or was it a dead cat bounce?) is now a distant memory, only visible in the rear view mirror, as Wednesday’s return to reality took back all of the previous day’s gains and then some.

There was nothing new, as the same old worries about global growth, domestic inflation and the now out of control spinning Greek debt crisis took their toll and sent the major market ETFs to the mat. The remainder of the week was spent in aimless meandering depending on the news reports du jour.

Read More

Weekly StatSheet For The ETF/No Load Fund Tracker – Updated Through 6/16/2011

Ulli ETF StatSheet Contact

ETF/Mutual Fund Data updated through Thursday, June 16, 2011

If you are not familiar with some of the terminology used, please see the Glossary of Terms.


1. DOMESTIC EQUITY MUTUAL FUNDS/ETFs: BUY— since 6/3/2009

As announced via a blog post, on 6/2/2009, the TTI triggered a buy signal with an effective date of 6/3/2009. We will use the 7% trailing stop loss of our positions as an exit point or the crossing of the trend line to the downside, whichever occurs first.

As of today, our Trend Tracking Index (TTI—green line in above chart) has broken above its long term trend line (red) by +2.06%.

Read More

High Volume ETFs On The Cutline – Updated Through 6/15/2011

Ulli ETFs on the Cutline Contact

While Tuesday’s rebound raised hopes of a turn in short-term market direction, Wednesday’s sharp drop put an end to that hope – at least for the time being. Weakness in all areas of the market becomes especially clear in the High Volume Cutline report due to it covering only 90 ETFs.

To clarify, High Volume (HV) ETFs are defined as those with an average daily volume of $10 million or higher.

These ETFs are generated from my selected list of 90 that I use in my advisor practice. It cuts out the “noise,” which simply means it eliminates those ETFs that I would never buy because of their volume limitations.

Here are the changes in positions by some of the widely held indexes:

XLY (Consumer Discretionary) from +20 to +7.

VTI (Total Stock Market Index) from +19 to +5.

SPY (S&P 500) from +12 to +4.

IWM (Russell 2000) from +13 to +3

And sinking below the cutline were the following ETFs:

EFA (Foreign Large Blend) from +18 to -11.

VWO (Emerging Markets) from +7 to -14.

BRF (Brazil Small Cap) from +10 to -16

First, take a look at the table and then read my latest market update:

Read More

Triple Punch Knocks Down Major Market ETFs – International Sell Signal Generated

Ulli Market Commentary Contact

The day started out to the downside, as a triple punch took the starch right out of yesterday’s rebound rally, which at this point looks like a dead cat bounce.

Industrial production barely grew in May, manufacturing in the New York region unexpectedly fell and consumer prices rose 0.2%, which was slightly ahead of expectations.

Add to that a falling home builders housing market index and a downwardly revised number for capacity utilization, and you are finally seeing the emperor without clothes, i.e. real data of an economy without stimulus.

The Greek debt saga shifted into overdrive pushing the euro to its lowest level in a month against the dollar. The EU is deadlocked on a second rescue package for Greek, and it appears at this time that a default in the near future has become a distinct possibility.

Read More

6 ETF Model Portfolios You Can Use – Updated through 6/14/2011

Ulli Model ETF Portfolios Contact

The continued sell-off, saved by yesterday’s rebound, caused a shift in YTD performance of our various portfolios. The income portfolio (#5) moved back into the #1 spot with a gain of +4.89%, which was followed by the #3 portfolio with +4.79% and the #1 portfolio +4.28%.

VEU (Foreign Large Blend) triggered its trailing sell stop and was sold on 6/13/11. This affected the holdings in portfolios #2, #3 and #4. With the markets showing continued weakness, I will wait before replacing this position.

We also came close to liquidating our holding in VDE (Energy), which had clearly pierced its 10% trailing sell stop. Thanks to yesterday’s rally, we dropped back below it and lived another day to talk about it.

Again, the idea behind these models is not for you to be invested in the top performer but in a portfolio that represents ‘your’ personal risk tolerance – and not someone else’s.

Take a look at this week’s numbers:

Read More