Online Broker Commission Cuts Continue

Ulli Uncategorized Contact

The NYT featured an interesting article titled “What To Look For In An Online Broker,” which features a comparison of the major players in the business:

Charles Schwab fired the first shot when it cut its trading commissions last month, and now Fidelity and E*Trade have followed with price cuts of their own.

All of the changes may have made you think about switching brokers. Or, maybe you’re wondering if this should be a factor as you shop for a new brokerage account.

First, a quick review: Schwab cut its trading commissions to a flat fee of $8.95 in January. A few weeks later, Fidelity lowered its trading fees to $7.95. And last Friday, E*Trade said it would drop its fee to $9.99 or less per trade. None of them has cut prices below the $7 per trade charged by Scottrade, which remains the cheapest among the largest online brokers.

Why now? One reason the brokers cut commissions was to simplify their pricing and charge flat fees. Before the changes, Schwab, Fidelity and E*Trade all charged additional fees (about 1.5 cents per share) on top of their base commissions for people who traded more than, say, 1,000 or 2,000 shares, said Matt Snowling, an analyst who covers the online brokerage industry at FBR Capital Markets.

And as stock prices plummeted in late 2008 and early 2009, the size of the average trade in many widely held stocks increased. So it wasn’t unusual for investors to trade thousands of shares (think Citigroup at $3) — and that could add another $50 or so on top of the base commission. “The fact that none of the moves set a new price point below Scottrade is telling that we are not entering a true price war,” he added.

All of this is good news for the average investor. Lower trading commissions are always welcome, though these changes won’t really affect you if you don’t trade that often — and most long-term investors don’t (nor should they).

When you’re shopping for a broker, you need to consider the tools, services and funds they offer — that’s what really differentiates providers these days. For instance, while most brokers offer hundreds if not thousands of mutual funds, many will charge a “transaction fee” that can run up to $50 or more to invest in funds that aren’t on their “preferred” lists. So when you’re shopping around, make sure you won’t have to pay one of these fees to invest in your favorite funds. If you’re a fan of Vanguard index funds, for instance, you probably don’t want to invest in them through Schwab, which charges nearly$50 every time you make a deposit.

A 2009 study by J.D. Power and Associates asked more than 5,000 self-directed investors about their satisfaction with the major online brokerage players, and they ranked Charles Schwab at the top of the list. Vanguard came in second, followed by Scotttrade. Schwab’s customers were happy with its tools, account information, educational offerings, and interactions with its Web site. Vanguard, meanwhile, got high grades for its account offerings and phone-based interactions. And Scottrade received good marks for its trading charges and fees, as well as interactions through its branch offices.

The study also found that investors who used the tools and resources offered by their brokers were more satisfied than those who did not. That shows that price isn’t always the most important factor. Nor should it be.

If you are in the hunt of finding/evaluating a new online broker, I suggest you read the above link in its entirety.

Price wise there is not much difference so tools and resources may come into play for some. For example, if you are following the trend tracking method of investing, take a look and see if someone offers a simple but effective way to track your sell stops.

Or, if your work schedule has you on the road quite a bit, inquire about the possibility of using your cell phone as a trading tool, should you have the need to enter sell stop orders.

I agree that the decision of which broker you select should not be all about price, but mainly how you work and invest and who gives you the tools to best implement your investment strategy.

Is It Time To Sell Bond Funds?

Ulli Uncategorized Contact


One reader has a portion of his portfolio invested in bond funds and is wondering if they still make sense. This is what he had to say:

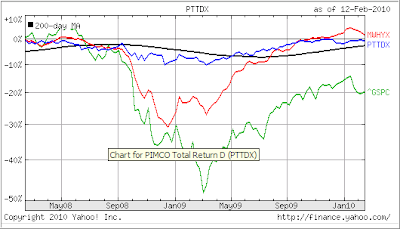
Do you have any insights and advise for people who are currently holding bonds such as MWHYX and PTTDX in their portfolios? While both of these funds have performed phenomenally over the past decade is now the time to consider dumping them?

In the past I have always been a big believer in having a bond component in my portfolio, and it has served me well.

With interest rates set to rise, and a “bond bubble” having formed should investors dump these bond funds from their portfolios?

First, eventually the “bond bubble” will bring down the stock market, unless it is pulled off its current level by another trigger.

Second, we don’t have higher interest rates yet; they are merely a known factor lurking on the horizon with no specific time frame. The Fed announced last week that “accommodating” interest rates are here to stay for the time being—whatever that means.

To me, the solution, as to whether you should sell your bond funds or not, is very simple. Follow the trend! Apply the customary sell stop strategy to bond funds just as you would to equity funds.

Take a look at the above chart in which I am comparing the funds you own with the S&P; 500. It’s obvious that your junk bond fund (MWHYX) tracks the S&P; 500 though with somewhat less volatility. The more diversified PTTDX has shown more stability during the downturn of 2008 and into 2009.

As a result, I suggest you use a 7% trailing stop loss for MWHYX and a lesser number, maybe 5% or so, for PTTDX. That way you don’t have to guess if now is a good time to sell or not. You simply let the market tell you when it’s time to exit.

Disclosure: I don’t have any positions in the funds discussed above.

Sunday Musings: It’s All About Personal Choice

Ulli Uncategorized Contact

Some new readers of this blog are not up to speed as to what trend tracking is all about and still have a buy-and-hold mentality. Here’s one comment I recently received:

While a 7% sell stop strategy may prevent major losses during a Market melt down, they also greatly inhibit the upside over the long run.

John Bogle, and many other highly respected investors point out the folly of trying to time the Market. There have been innumerable studies that show that moving in and out of ETF’s and Mutual funds over the long run can cost an Investor as much as 25% on return.

While I do admit that being stopped out might prevent a major portfolio loss, it also locks in many 7% losses while at the same time incurring Tax and trading expenses.

Here’s the thousand dollar question! Once your stopped out, when do you decide to buy back in? And when you do buy back in is there any guarantee the Market won’t stop you out again for another 7% loss? Of course this loss will be on newly invested money that probably missed out most of the rally after the first stop out.

Since all of these issues have been addressed before, I will just comment in general. Most studies in support of buy and hold (b&h;) have been done by the staunchest supporters of that investment approach, which makes the results biased.

Dalbar and Morningstar come to mind. I’ve seen some of the results in the past, and it seemed to me that they attempted to cherry pick those periods that supported their point of view, because bear markets were never included as if they did not exist.

You have to realize that the reason b&h; gets so much support is that that’s where the compensation for many comes from. Wall Street’s army of commissioned brokers needs to have a way to generate revenue no matter what the market is doing. If you’re not invested and in cash on the sidelines (for good reasons), no commissions can be generated.

The meltdown of 2008 has supported my long-held view that it is more important to control downside risk than to participate in every up tick of the market. Case in point is the sharp rebound of 2009, over which most brokers have gone wild, yet the S&P; 500 still needs to rise 22.55% (as of Friday) to reach the level our Trend Tracking Indexes signaled a sell on June 23, 2008.

With the markets starting to crack, this will be a tough one to make up, and could very well take many years.

There always seems to be a battle brewing, and investors, just like sports fans, have the urgent need to see a winner, no matter what. Back in the late 80s and 90s, it was load mutual funds vs. no load funds. Over the past few years, it was ETFs vs. no load funds and, of course, there is always at good time to pit trend tracking vs. b&h.;

Personally, I think it’s the wrong attitude. This is not about one being superior to the other; it should have to do with personal choice only, and my preference is the use of trend tracking.

I have received the phone calls back in 2001 when investors lost a big chunk of their portfolios and again in 2008 when disaster struck. I’ve heard the sad stories as a result of having held assets through a bear market that ended up changing lives forever.

Despite my bias, it is not a matter of right or wrong. If you can accept the fact that every so often a bear market wipes out some 50% of your portfolio, then you should stick with b&h.; If you can’t handle that, then you should consider trend tracking. It’s all about having a choice about what fits your emotional make up better and not a matter of right or wrong.

To be clear, no one investment approach is perfect. We live with the imperfections of trend tracking by getting whipsawed occasionally and try to keep investment losses manageable so that they can be made up quickly.

On a fundamental basis, I need to point out that years (or decades) of financial mismanagement have come to an end with the burst real estate/credit bubble, not just here in the U.S. but worldwide.

As a result, there is a gigantic debt overhang and inability to pay along with reduced revenues on all levels ranging from Federal, State and municipalities the outcome which has not been absorbed yet by the current economic rebound.

My view is that economic and global uncertainly is here to stay and with it the ever present danger that a bear market can strike again. As I have repeatedly posted, the alleged economic recovery was built on nothing but hype, hope and government stimulus.

I for one prefer not living in an investment dreamland where I can simply buy and hold a mutual fund or ETF without worry. Once reality sets in again, I will be glad that there is an investment option that will keep my portfolio from getting a serious haircut.

That’s my choice—you have to make yours.

Above The Sell Stop

Ulli Uncategorized Contact

One reader was looking for some clarifications as the Trend Tracking Indexes (TTIs) have retreated sharply with recent market activity. This is what he had to say:

You mentioned some of your sell stops were hit. I have to believe all were hit since hardly anything has withstood a 7% loss, this Tuesday’s rebound notwithstanding.

So given that the TTI is still above the trend line, are we to deploy into those funds that are higher on the charts? Or, are to chill until they take out their highs before jumping in?

Also you mention “we are closer to bear market territory”. Are you talking about “sell everything” situation – assuming there are still some positions we haven’t been stopped out of – or are you talking about actually shorting the market?

As is no surprise, the most volatile funds and ETFs are the first ones to trigger their sell stops as the market corrects. However, not all 7% trailing stops have been triggered, since we owned some conservative holdings that have so far stayed above the sell stop level. I talked about that in more detail in “Using The Benefit of Hindsight.”

If you have been stopped out, be patient as it is not clear yet that the uptrend has resumed. Please review my thoughts on reinvesting as described in “Deploying Stopped Out Money.”

Yes, we have clearly moved closer to bear market territory. What that means is that the TTIs have moved within striking distance of piercing their long term trend lines to the downside.

If that occurs, we will have left the bullish zone. At that moment, you should have no positions at all. As I have posted before, the international TTI has raced ahead of the domestic TTI with the result that we no longer hold any international positions.

Once any of the TTIs cross into bear territory, you can, if you are an aggressive investor, short the overall market by selecting the appropriate ETF. Will I do so? No, most of my clients are too conservative, so I will stay on the sidelines watching the debacle unfold. There may be a long opportunity in certain sectors, but it is too early to tell, which ones they may be.

However, I believe that once this market heads south, we will see a dollar rally, so I have my eyes feasted on UUP, although right now I don’t have any positions in it.

No Load Fund/ETF Tracker updated through 2/11/2010

Ulli Uncategorized Contact

My latest No Load Fund/ETF Tracker has been posted at:

http://www.successful-investment.com/newsletter-archive.php

The sideways pattern continued although the major indexes managed to close slightly higher.

Our Trend Tracking Index (TTI) for domestic funds/ETFs has now crossed its trend line (red) to the upside by +2.96% keeping the current buy signal intact. The effective date was June 3, 2009.


The international index has now broken above its long-term trend line by +1.74%. A Buy signal was triggered effective May 11, 2009. We are holding our positions subject to a trailing stop loss.


[Click on charts to enlarge]

For more details, and the latest market commentary, as well as the updated No load Fund/ETF StatSheet, please see the above link.

More Commission Free ETFs

Ulli Uncategorized Contact

After Schwab had thrown down the gauntlet a few months ago by offering a small menu of commission free ETFs, it was only a matter of time before someone else picked it up. MarketWatch reports in “Big brokers cut commissions to draw ETF assets:”

Online brokers are fighting hard for a greater share of the fast-growing exchange-traded fund business, and investors stand to benefit from lower costs.

Two of the nation’s largest brokerage platforms are allowing customers to buy and sell some exchange-traded funds for free in a bid to attract business. The move could compel rivals to follow suit, encouraging investors to buy and sell ETFs.

Last week, Fidelity Investments said clients can trade several outside-managed ETFs online without paying commissions.

The Boston-based investment giant also cut U.S. online stock-trading commissions by as much as 60% to a flat rate of $7.95 a trade.

Fidelity’s alliance with ETF heavyweight BlackRock Inc. could mark a major milestone for the business. Fidelity is allowing customers to trade 25 iShares ETFs from BlackRock for free.

Some analysts said Fidelity’s move could be a response to Charles Schwab Corp. launching its first proprietary ETFs in November with commission-free online trades for Schwab clients.

Schwab’s eight ETFs had slightly more than $570 million in assets under management as of Feb. 3, said spokesman David Weiskopf.

Fidelity launched its first and only ETF in 2003, the Fidelity Nasdaq Composite Index Tracking Stock. It had about $127 million in assets at the end of January, according to Fidelity.

“Our customers have been showing an increasing interest in ETFs,” said James Burton, president of Fidelity’s retail brokerage business, in an interview.

He declined to discuss the financial details of the deal with BlackRock other than to say it was a multiyear marketing agreement. Burton also declined to comment on whether Fidelity plans to grow its own ETF lineup beyond its single offering. “We study a wide array of product opportunities all the time,” he said.

While I am all in favor of low or now fees, I also want to sound a word of caution. Just because something is free in the investment world, does not mean it’s appropriate.

When following trends in the market place, your main concern should be the momentum figures as shown in my weekly StatSheet. The higher the ranking, the more volatile the fund/ETF! You should make your selections based on your risk tolerance along with upward trending momentum numbers.

To select an ETF that has moved below its own long-term trend line, is showing mostly negative returns in all columns, but has no commission, should not be a candidate if you want to be long in the market.

If you go through the appropriate selection process, and you find two ETFs with identical features, and one is commission free, then by all means go ahead and select that one.

Otherwise, you are putting the cart before the horse, which will lead to investment choices that are not in tune with trend tracking principles.