
ETF Tracker StatSheet
You can view the latest version here.
DEAD-CAT BOUNCE OR FRESH START? THE MARKET AWAITS ITS NEXT CLUE
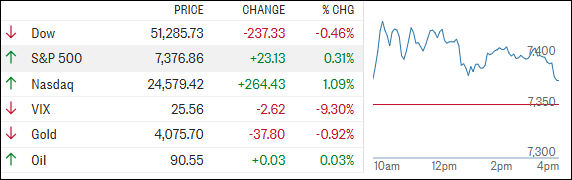
[Chart courtesy of MarketWatch.com]
- Moving the market
Friday brought a little relief after Thursday’s market tantrum.
The Nasdaq bounced back as traders stepped in to scoop up beaten-down chip and AI stocks, helping the tech-heavy index recover some of the ground lost during its sharp slide into correction territory.
The S&P 500 joined the rebound, while the Dow once again played the role of the reluctant participant.
The real story of the week was concentration risk. When a handful of technology giants and semiconductor names carry so much weight, weakness in those stocks can quickly drag the broader indexes lower.
We saw that in dramatic fashion on Thursday, when the Magnificent Seven collectively shed roughly $1 trillion in market value and helped trigger the worst one-day decline since April 2025.
Today’s better-than-expected jobs report added another wrinkle to the outlook. Payrolls grew by 165,000 in October versus expectations for just 59,000, while unemployment slipped to 4.1%.
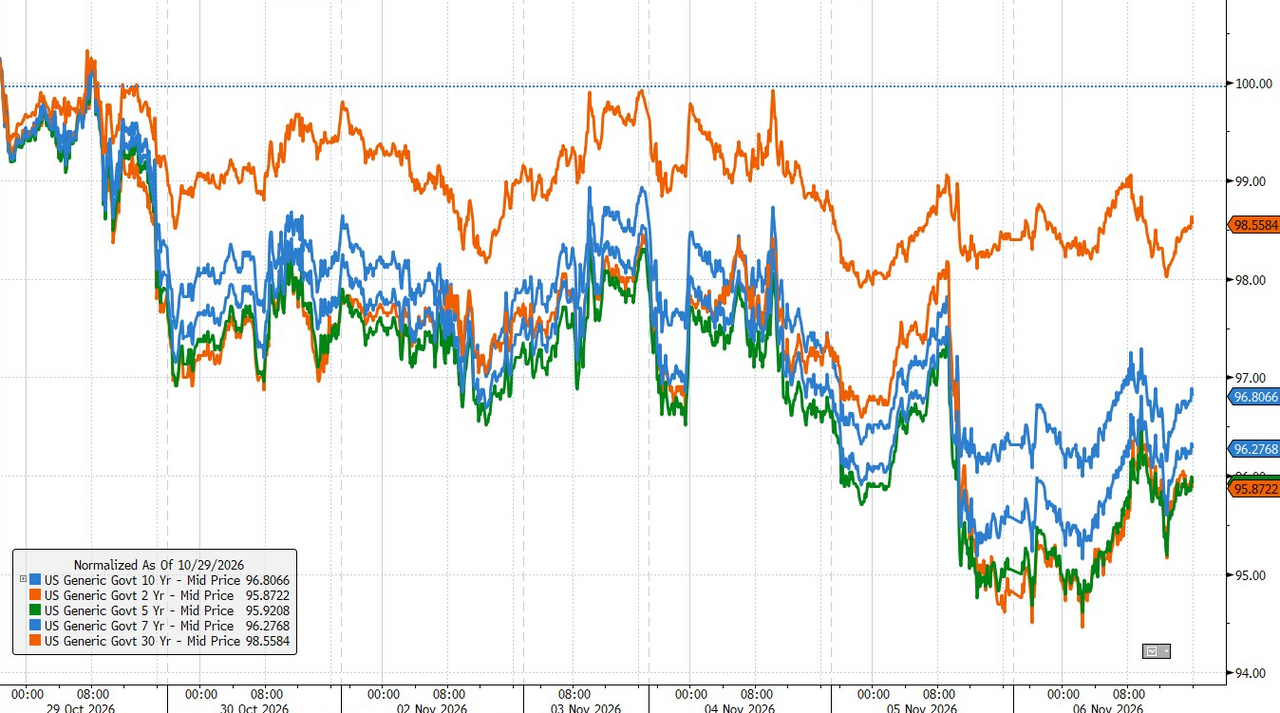
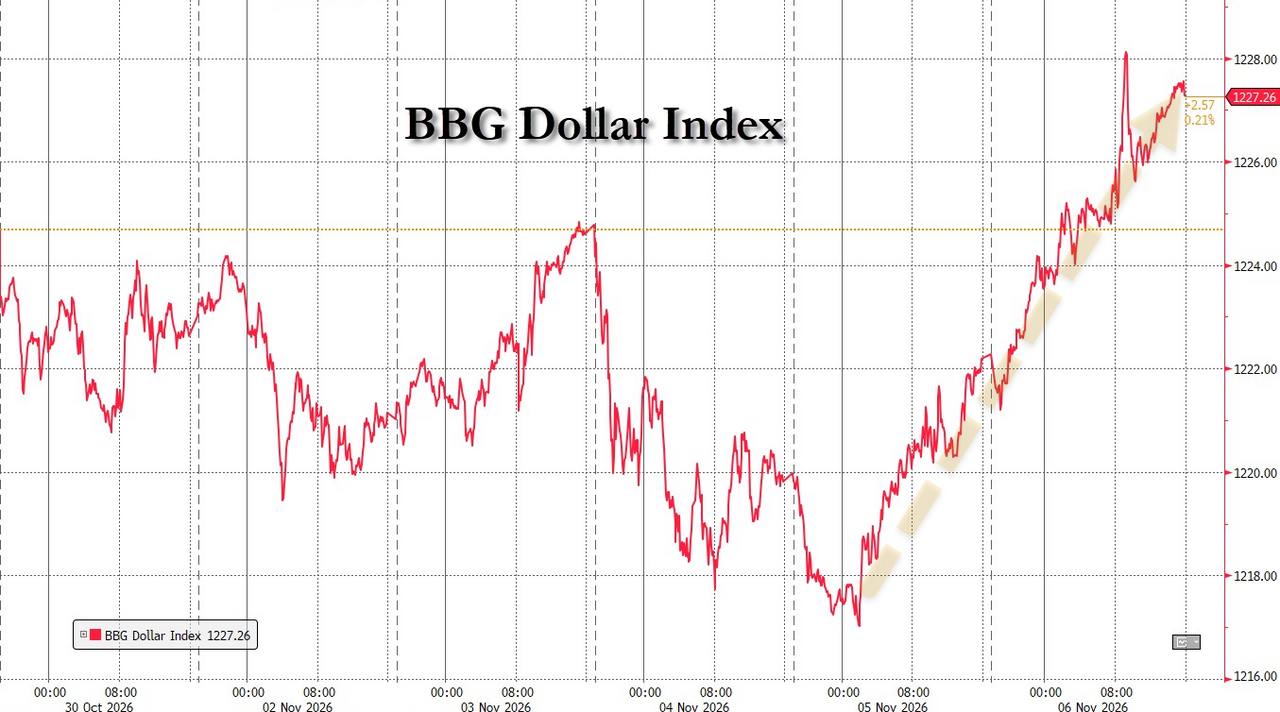
That’s good news for the economy, but it also revives concerns that the Fed may not be done tightening, which helps explain why bond yields and the dollar moved higher.
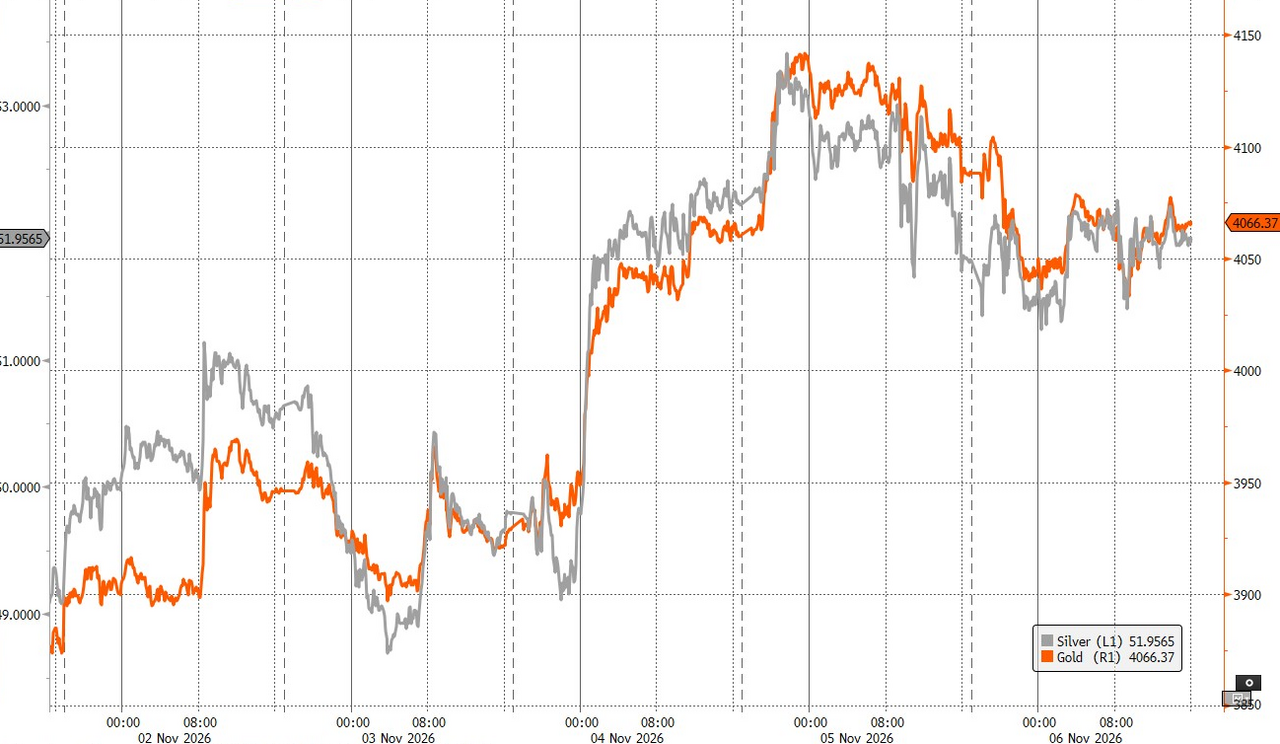
Elsewhere, gold and silver gave back some gains today but still finished the week in positive territory. Bitcoin followed the Nasdaq’s lead and climbed back above $76,000.
History suggests Nasdaq corrections often create attractive opportunities over the following three to six months, but the path is rarely smooth. After a week that felt more like a roller coaster than a market, today’s rebound was welcome.
The big question is whether it was simply the dead-cat bounce everyone expected, or the first sign that sellers are finally running out of ammunition.
With next week’s CPI report and another round of earnings on deck, are the markets trying to tell us something?
2. Current domestic “Buy” Cycle (effective 5/20/2025); International “Buy” Cycle (effective 5/8/25)
Our domestic bullish cycle that began on November 21, 2023, concluded on April 3, 2025, following a market downturn triggered by President Trump’s tariff policy announcement.
This development caused significant declines across major indexes and broader market indices. However, markets subsequently rebounded, culminating in a new domestic “Buy” signal taking effect May 20, 2025.
Concurrently, our International Trend Tracking Index (TTI) experienced parallel volatility. On April 4, 2025, it breached critical thresholds, prompting a “Sell” recommendation. This position reversed as global markets recovered, with the International TTI regaining sufficient momentum to issue a new “Buy” signal effective May 8, 2025.
3. Trend Tracking Indexes (TTIs)
Today felt a bit like a three-legged race: the S&P 500 and Nasdaq managed to find their footing and bounced back, while the Dow kept stumbling and finished in the red.
The metals took a breather today, though they still logged a solid gain for the week.
As for our TTIs, they eased back both today and over the week. No alarms yet, though. They remain above their trend lines, which means the bulls still have the benefit of the doubt.
For now, the trend remains our friend, even if it’s taking a well-earned coffee break.
This is how we closed 11/06/2026:
Domestic TTI: +4.06% above its M/A (prior close +4.72%)—Buy signal effective 5/20/25.
International TTI: +1.74% above its M/A (prior close +3.14%)—Buy signal effective 5/8/25.
All linked charts above are courtesy of Bloomberg via ZeroHedge.
———————————————————-
WOULD YOU LIKE TO HAVE YOUR INVESTMENTS PROFESSIONALLY MANAGED?
Do you have the time to follow our investment plans yourself? If you are a busy professional who would like to have his portfolio managed using our methodology, please contact me directly to get more details.
Contact Ulli